In today’s data-driven marketing landscape, media buying is an essential part of any successful advertising strategy. With numerous metrics and performance indicators to track, it can become overwhelming to analyze the effectiveness of your media buys. However, a well-structured Media Buying KPI Dashboard in Power BI can simplify the process and provide real-time insights into the performance of your advertising campaigns. This comprehensive guide will explore the features, best practices, advantages, and how you can implement a KPI dashboard in Power BI to track your media buying success.
Click to Purchases Media Buying KPI Dashboard in Power BI
What is a Media Buying KPI Dashboard?
A Media Buying KPI Dashboard is a tool that aggregates data from various media campaigns to provide a comprehensive view of key performance indicators (KPIs). The purpose of this dashboard is to help marketers and media buyers track the success of their campaigns in real-time, enabling them to make data-driven decisions for future investments.
In Power BI, the dashboard combines both graphical and tabular data into a single, interactive platform. This allows for easy monitoring of crucial metrics such as Total Revenue, Click-Through Rate (CTR), Cost Per Acquisition (CPA), and Return on Investment (ROI). By visualizing this data, teams can quickly assess the effectiveness of their media buys and optimize campaigns for better results.
Key Features of the Media Buying KPI Dashboard in Power BI
The Media Buying KPI Dashboard in Power BI integrates a variety of features that make it a valuable tool for marketers. Below are the main features that contribute to its efficiency:
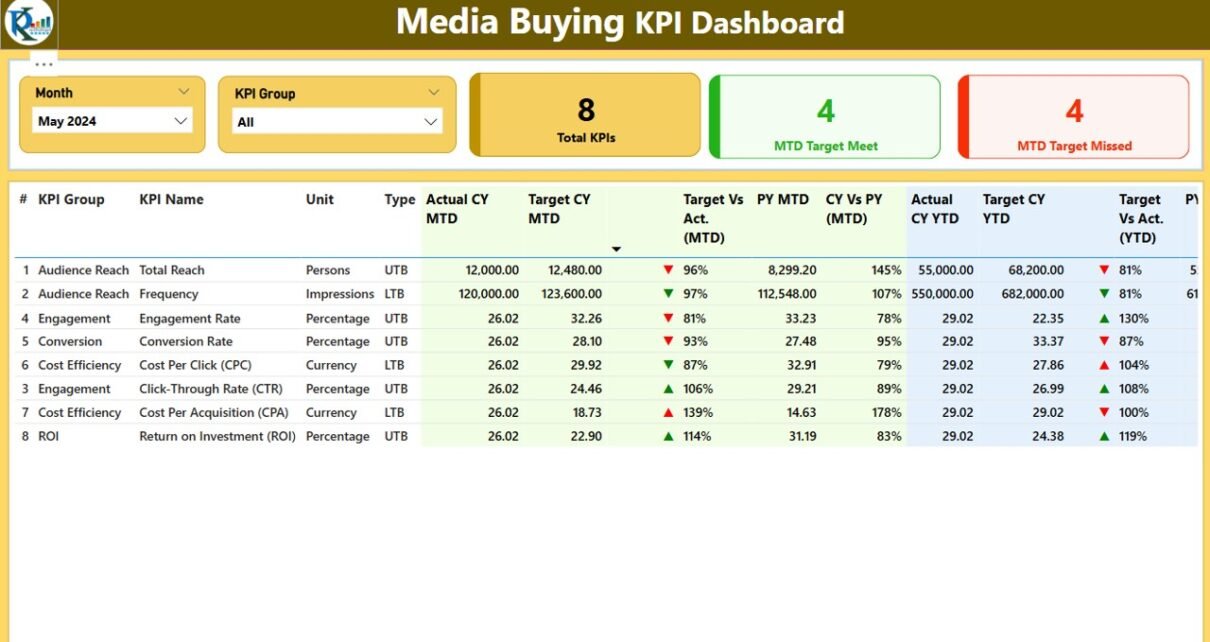
Summary Page
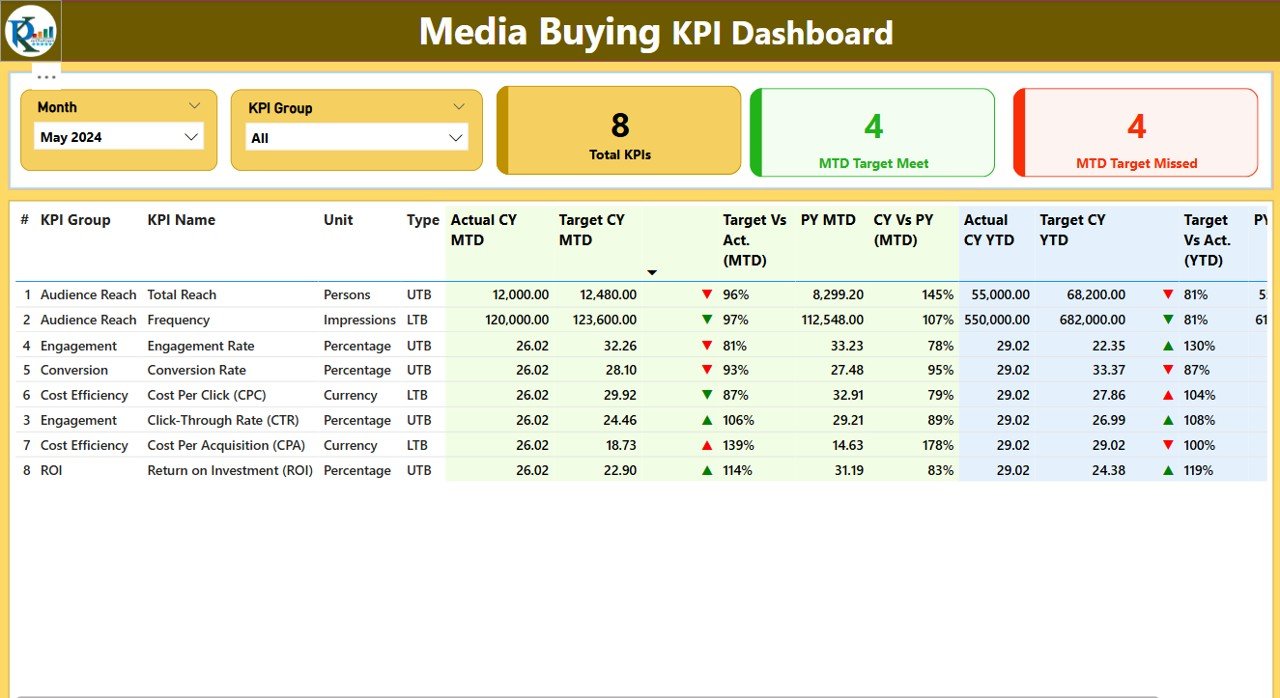
The Summary Page is the central hub of the dashboard. It provides a bird’s-eye view of the most critical KPIs and performance metrics. This page includes the following components:
-
Month and KPI Group Slicers: Users can filter data by month and KPI category to focus on specific periods or KPI groups.
-
Key Metrics Cards: These cards display the total number of KPIs, MTD (Month-to-Date) Target Met count, and MTD Target Missed count, giving users a quick snapshot of performance.
Detailed KPI Table: This table showcases detailed information about each KPI, including:
- KPI Number: The sequence number of the KPI.
- KPI Group: The category or group under which the KPI falls.
- KPI Name: The name of the KPI.
- Unit: The unit of measurement used for the KPI.
- Type: Whether the KPI is Lower the Better (LTB) or Upper the Better (UTB).
- Actual CY MTD: The actual performance value for the current year (MTD).
- Target CY MTD: The target performance value for the current year (MTD).
- MTD Icons: Green or red icons indicate whether the KPI is meeting its target.
- Target vs Actual (MTD): A percentage comparison of the target vs actual values for MTD.
- Previous Year (PY) MTD: The MTD performance from the previous year for comparison.
- CY vs PY (MTD): A percentage comparison between the current MTD and the previous year’s MTD.
Click to Purchases Media Buying KPI Dashboard in Power BI
KPI Trend Page
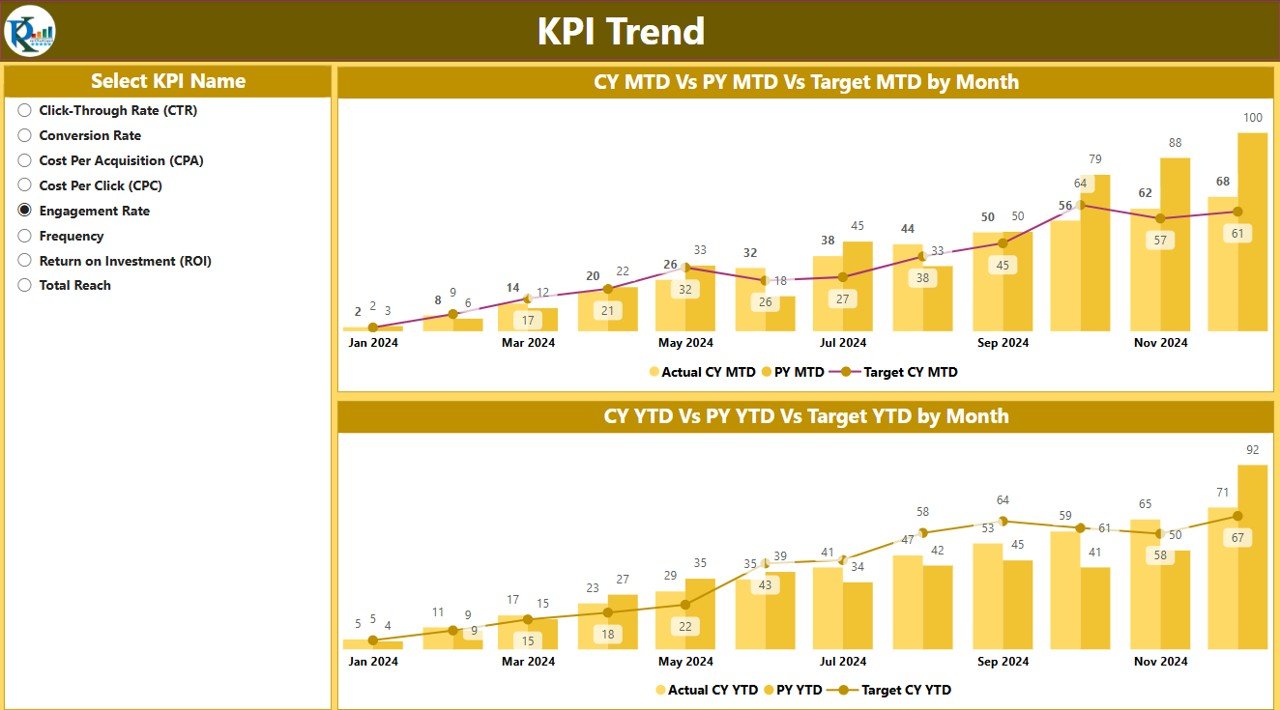
The KPI Trend Page visually compares performance across time, showing actual values for the current and previous years, along with the set targets. Here are the features of this page:
-
Combo Charts: Two combo charts visualize the Actual Numbers for the Current Year, Previous Year, and Targets for both MTD and YTD (Year-to-Date).
-
KPI Selector: A slicer on the left allows users to filter the chart by specific KPIs for deeper insights.
KPI Definition Page
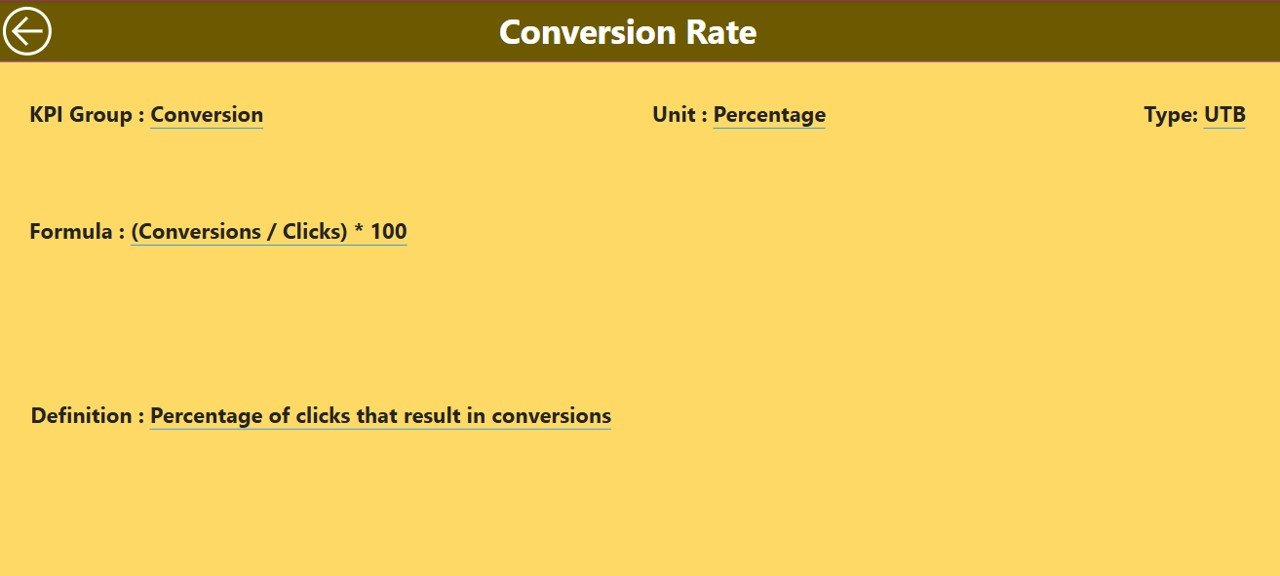
This hidden page provides in-depth details about each KPI. It is accessible through drill-through from the Summary Page. The KPI Definition page includes:
-
KPI Formula: The calculation formula for the KPI.
-
KPI Definition: A detailed explanation of what each KPI measures and how it contributes to media buying goals.
-
Back Button: A quick way to navigate back to the main page of the dashboard.
Excel Data Integration
The data for this dashboard is pulled from an Excel file, ensuring that all information is up-to-date and easy to manage. There are three key worksheets:
-
Input_Actual Sheet: Contains actual values for KPIs, broken down by month and year.
-
Input_Target Sheet: Contains target values for KPIs, broken down by month and year.
-
KPI Definition Sheet: Contains metadata about each KPI, such as its number, name, unit, formula, and type.
Advantages of a Media Buying KPI Dashboard in Power BI
Using a Media Buying KPI Dashboard provides several advantages for businesses looking to optimize their media buying efforts. Let’s dive into some of the key benefits:
1. Real-Time Data Access
One of the primary advantages of using Power BI for media buying KPIs is the ability to access real-time data. This means that teams can monitor the effectiveness of their media buys as the campaigns progress. No more waiting for monthly reports—your dashboard will provide up-to-the-minute performance statistics, enabling faster decision-making.
2. Improved Decision Making
By consolidating all KPIs into a single platform, the dashboard helps decision-makers see the bigger picture. They can easily identify trends, opportunities, and areas for improvement, leading to more informed decisions about future media buys.
3. Data Visualization for Better Insights
The use of charts, graphs, and color-coded icons makes it easier to understand the performance of different KPIs. For example, the green and red arrows for MTD and YTD performance give a quick visual cue about whether a KPI is on track, allowing teams to act swiftly if a campaign is underperforming.
4. Easy Comparison Across Years
The ability to compare current performance (MTD and YTD) with the same periods in the previous year allows businesses to identify growth trends or areas where they are falling short. This comparison can help identify seasonality patterns, budget discrepancies, or changes in the competitive landscape.
5. Customizable for Your Business
The dashboard is fully customizable. You can modify the KPIs, change the categories, and adjust the slicers to reflect the specific needs of your business. Whether you focus on CTR, CPA, or ROI, you can tailor the dashboard to highlight the most relevant metrics for your team.
Click to Purchases Media Buying KPI Dashboard in Power BI
Best Practices for Implementing a Media Buying KPI Dashboard in Power BI
To get the most out of your Media Buying KPI Dashboard, it’s essential to follow best practices during its implementation and use. Here are some guidelines to help you optimize your Power BI dashboard:
1. Set Clear KPIs
Before you create your dashboard, it’s important to define which KPIs will be tracked. Make sure these KPIs align with your business objectives. For example, if your goal is to improve brand awareness, focus on metrics like impressions and reach. If your goal is to increase sales, focus on conversion rates and cost-per-conversion.
2. Regularly Update the Data
Ensure that the data feeding into the dashboard is updated regularly. Power BI allows for automated data refreshes, but it’s still important to check the data at least once a week to ensure that the numbers are accurate.
3. Create Custom Views for Different Stakeholders
Different team members may need to focus on different metrics. For example, the marketing team may be more interested in CTR, while the sales team may focus on ROI. Create custom views or slicers to allow each stakeholder to view the data that is most relevant to them.
4. Use Conditional Formatting
Power BI offers robust conditional formatting options, which can be used to highlight important trends or outliers. For example, you can use red and green icons to indicate whether a KPI is meeting or missing its target. This allows for quicker visual assessments and helps teams to prioritize their actions.
5. Monitor Trends Over Time
Ensure that the trend data for KPIs is visualized clearly, so that you can monitor performance over time. Look for long-term trends, seasonality, and cyclical patterns that can inform future media buying decisions.
Frequently Asked Questions (FAQs)
What are the key KPIs for media buying?
The key KPIs for media buying include Cost Per Acquisition (CPA), Click-Through Rate (CTR), Return on Investment (ROI), Impressions, Conversion Rate, and Reach. These metrics help assess the effectiveness of your advertising campaigns.
How can I use Power BI to track my media buying performance?
Power BI allows you to create interactive dashboards that visualize your media buying KPIs. By connecting your data to Power BI, you can track performance in real-time, compare current data with historical data, and make data-driven decisions to optimize future campaigns.
What data sources can I connect to Power BI for media buying?
Power BI supports integration with a wide variety of data sources, including Excel, Google Analytics, social media platforms, ad networks like Google Ads, and CRM systems. By pulling data from these sources, you can get a complete picture of your media buying performance.
Can I automate data refreshes in Power BI?
Yes, Power BI allows you to set up automated data refreshes. You can schedule updates for your dashboards to ensure that you always have access to the most up-to-date information.
Conclusion
A Media Buying KPI Dashboard in Power BI is an invaluable tool for marketers looking to optimize their media buying efforts. By visualizing and tracking KPIs in real-time, businesses can make more informed decisions, optimize campaigns, and achieve better results. By following best practices for dashboard implementation and regularly updating data, you can ensure that your media buying strategy remains efficient and effective.
Visit our YouTube channel to learn step-by-step video tutorials
Click to Purchases Media Buying KPI Dashboard in Power BI

