The Exam Boards KPI Dashboard in Excel tracks exam board performance across 7 structured worksheet tabs, delivering MTD and YTD analysis with conditional formatting arrows and trend charts for every KPI. Over 65% of education boards worldwide still rely on spreadsheets for performance reporting, and this template turns raw exam data into actionable insights in under 10 minutes — no macros, no coding, no recurring software fees.
Exam boards face increasing pressure to demonstrate accountability through measurable KPIs — from pass rates and marking turnaround times to center accreditation compliance and candidate enrollment growth. Without a structured tracking system, performance data sits in scattered files and quarterly reports arrive weeks late. The Exam Boards KPI Dashboard in Excel solves this by consolidating all KPIs into a single interactive workbook with month-by-month comparisons against targets and prior year benchmarks.
Key Features of Exam Boards KPI Dashboard in Excel
Click here to Purchase the Exam Boards KPI Dashboard in Excel
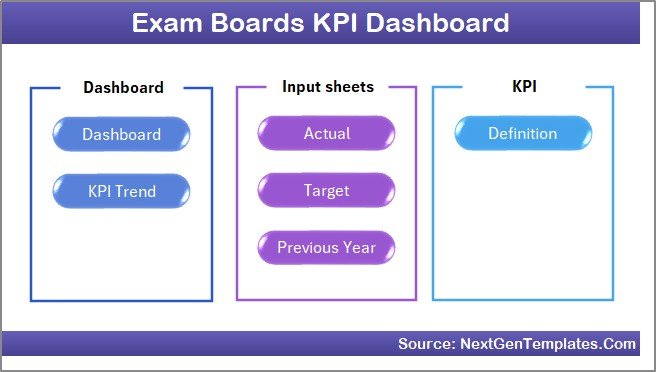
The Exam Boards KPI Dashboard in Excel displays MTD Actual, Target, and Previous Year data alongside YTD comparisons for every KPI, with conditional formatting arrows showing whether each metric is trending up or down. A month selector dropdown on cell D3 instantly updates the entire dashboard for any selected period. The KPI Trend sheet provides individual KPI deep-dives with group classification, unit type, LTB/UTB indicators, formula definitions, and dual MTD/YTD trend charts comparing Actual, Target, and Previous Year performance.
Three dedicated input sheets — Actual Numbers, Target Numbers, and Previous Year Numbers — keep data entry organized and separate from analysis. The KPI Definition sheet lets you customize KPI names, groups, units, formulas, definitions, and type (LTB or UTB) to match your exam board’s specific requirements. This separation of input from output ensures data integrity and makes the template suitable for multi-user environments.
Dashboard Pages Explanation
1. Home Sheet
This is the index sheet where 6 navigation buttons provide quick access to every worksheet in the template. It serves as the central hub for navigating between the Dashboard, KPI Trend, input sheets, and KPI Definition pages.
Home Page
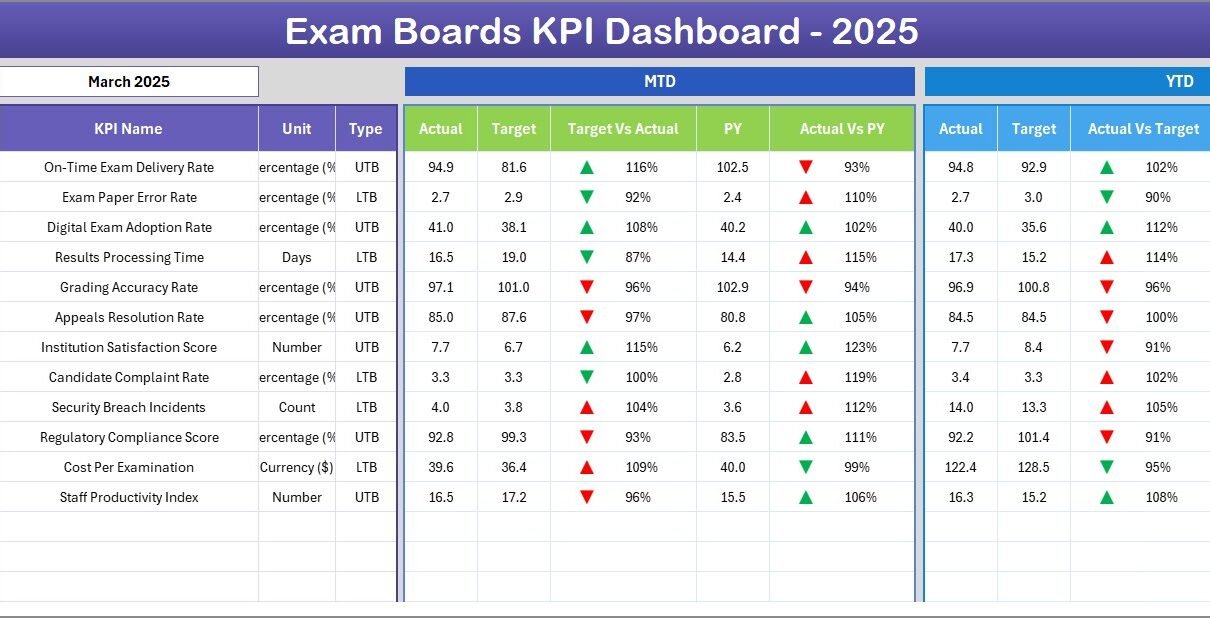
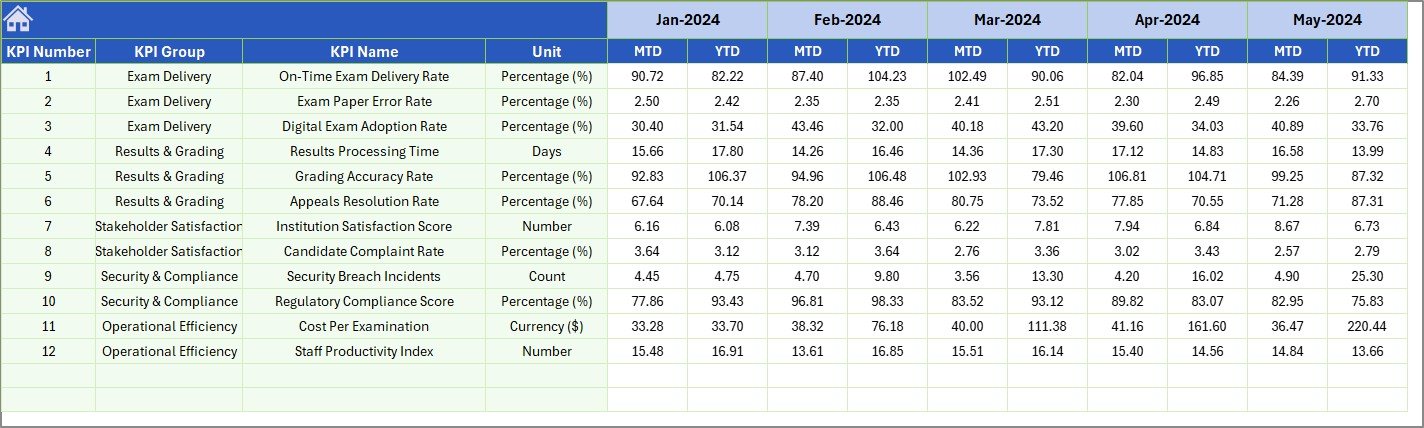
2. Dashboard Sheet
This is the main analytics sheet. It displays all KPI performance data in a consolidated view. Select any month from the dropdown on cell D3, and the entire dashboard refreshes. For each KPI, you see MTD Actual, Target, and Previous Year values with Target vs Actual and PY vs Actual comparisons. Conditional formatting arrows highlight favorable and unfavorable variances instantly. YTD figures follow the same structure, giving you both short-term and cumulative performance at a glance.
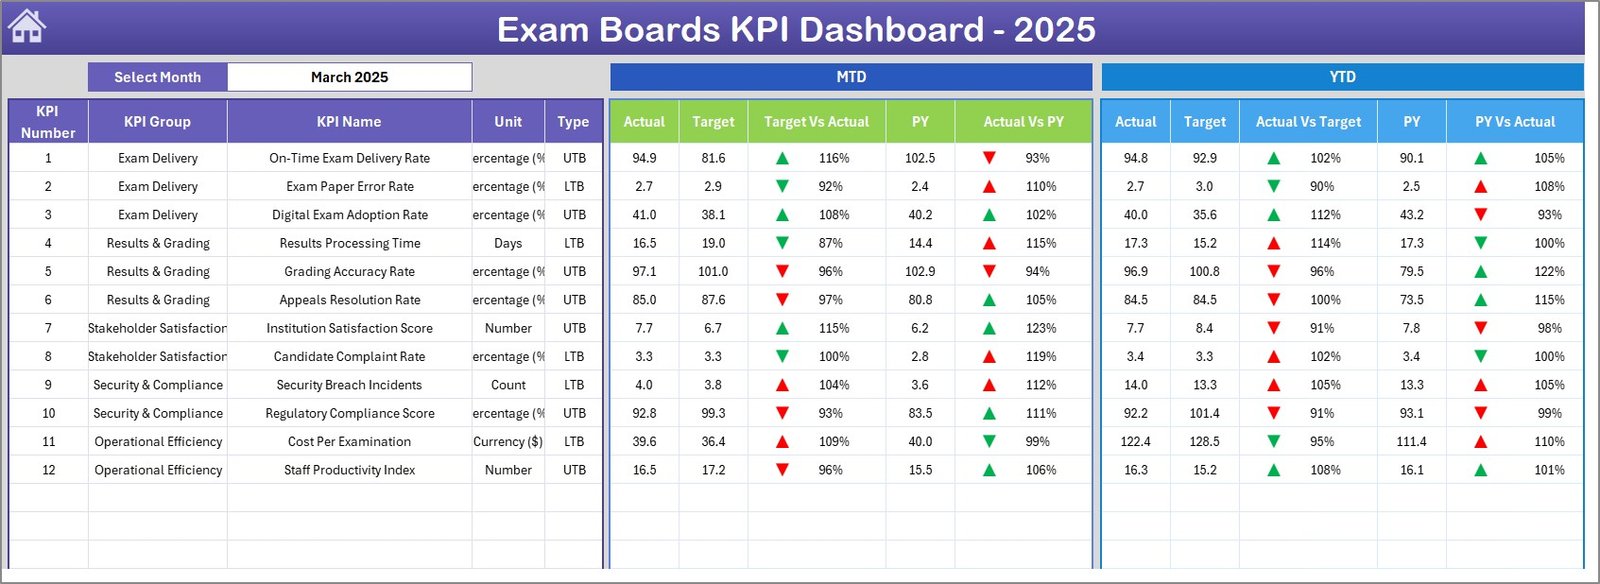
Exam Boards KPI Dashboard
3. KPI Trend Sheet
Select any KPI from the dropdown on cell C3 to view its detailed profile. The sheet displays the KPI Group, Unit, Type (LTB or UTB), Formula, and Definition. Below the profile, dual trend charts show MTD and YTD performance lines for Actual, Target, and Previous Year — making it easy to spot seasonal patterns or declining metrics before they become audit issues.
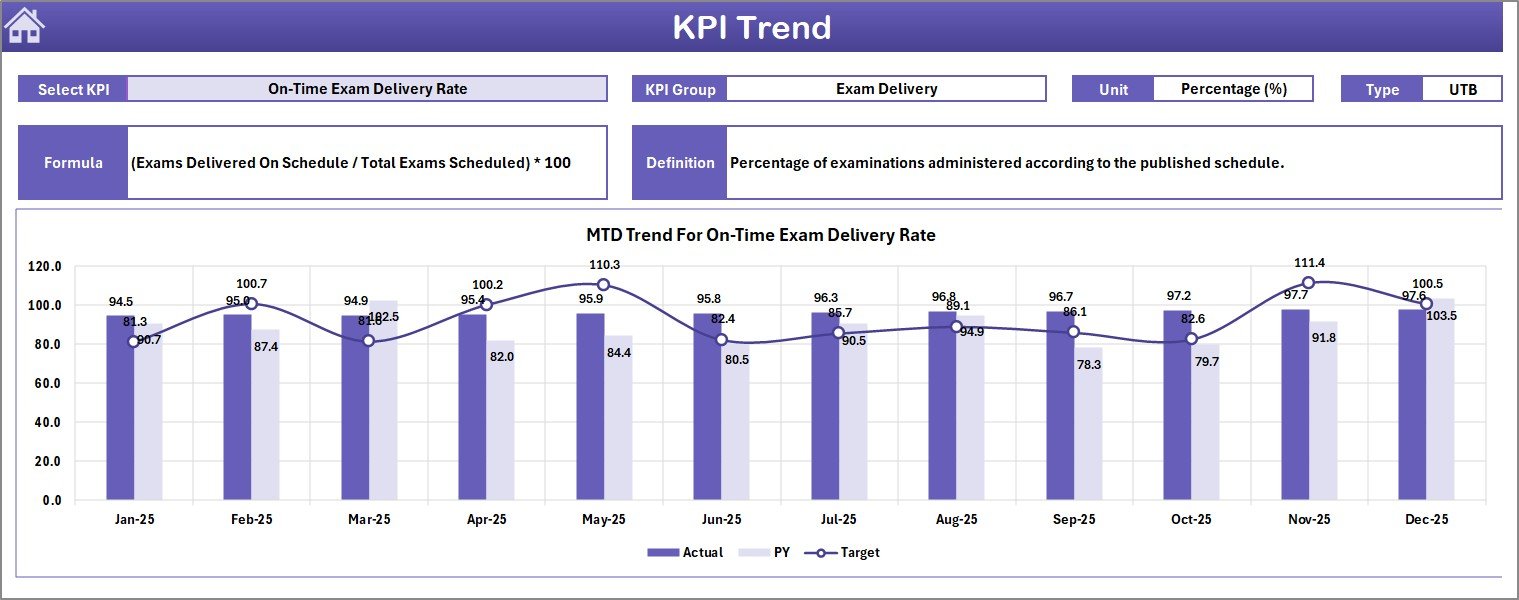
KPI Trend Sheet
4. Actual Numbers Input Sheet
Enter the actual numbers for YTD and MTD for each month. Set the first month of your reporting year on cell E1, and the template aligns all monthly columns accordingly. This sheet feeds the Dashboard and KPI Trend pages directly.
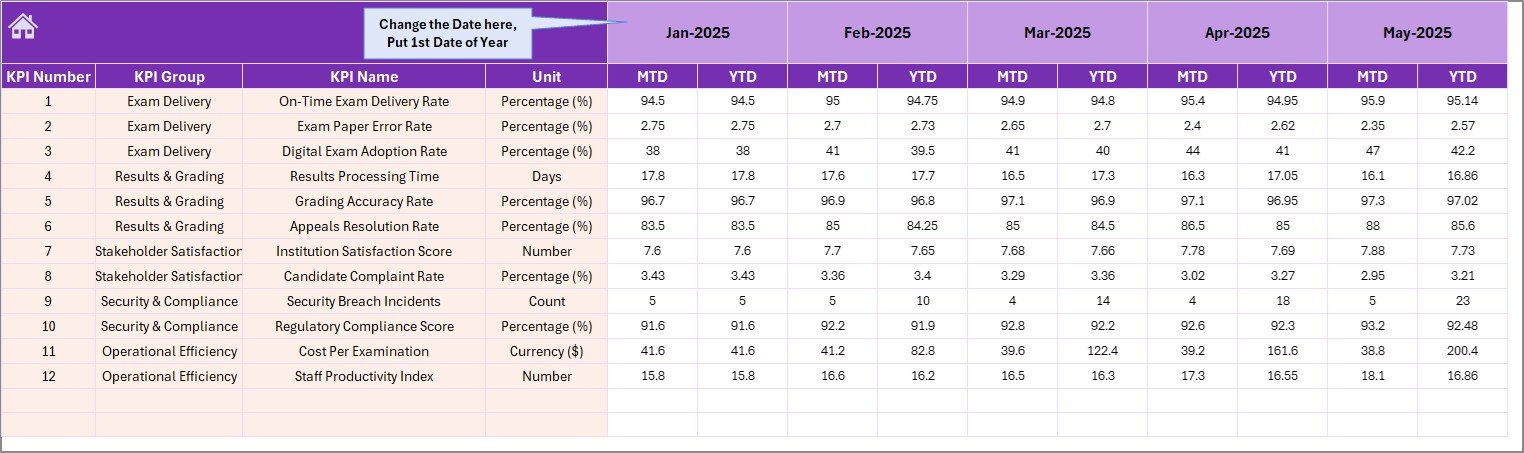
Actual Numbers Input Sheet
5. Target Number Input Sheet
Enter the target numbers for each KPI for every month as both MTD and YTD values. Targets drive the conditional formatting logic on the Dashboard sheet — green arrows for on-target or above, red for below target performance.
Target Number Input Sheet
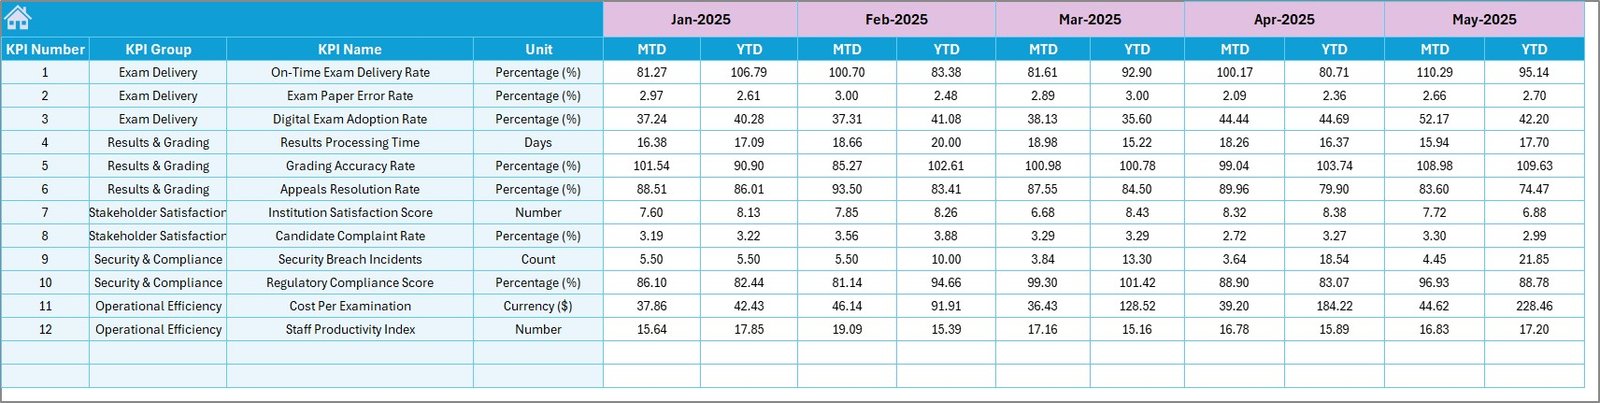
6. Previous Year Numbers Sheet
Enter the previous year’s actual numbers in the same format as the current year inputs. This enables year-over-year comparisons on the Dashboard sheet, showing PY vs Actual variances for both MTD and YTD.
Previous Year Number Input Sheet
7. KPI Definition Sheet
Define every KPI with its Name, Group, Unit, Formula, and Definition. The last column specifies the KPI type as LTB (Lower the Better) or UTB (Upper the Better), which controls how conditional formatting interprets performance — ensuring that a decrease in error rate shows as positive while a decrease in pass rate shows as negative.
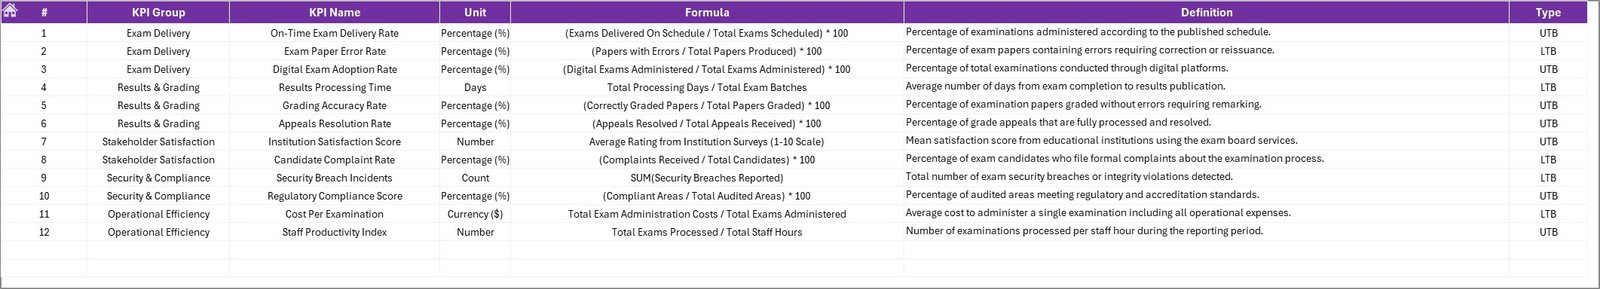
KPI Definition Sheet
Exam Boards KPI Dashboard in Excel vs. Google Sheets KPI Dashboard vs. Blackboard Analytics — Feature Comparison
| Feature | Exam Boards KPI Dashboard in Excel | Google Sheets KPI Dashboard | Blackboard Analytics / Paid SaaS |
|---|---|---|---|
| Cost | $14.99 one-time | Free (DIY effort) | $6–$25 / user / month |
| Platform | Microsoft Excel (desktop + web) | Google Sheets (web only) | Cloud SaaS |
| Setup Time | Under 10 minutes | 30–60 minutes | 2–4 weeks |
| Real-Time Team Collaboration | Via Excel Online / SharePoint | Yes (native) | Yes |
| Mobile Access | Excel Mobile App | Google Sheets App | Yes |
| Customizable KPI Definitions | Yes — LTB/UTB, formulas, groups | Manual setup required | Limited to preset metrics |
| MTD + YTD + PY Comparison | Yes — built-in | Requires custom formulas | Yes |
| Year-1 Cost at 5 Users | $14.99 total | $0 (DIY effort) | $360–$1,500 |
| Trend Charts per KPI | Yes — dual MTD + YTD | Manual chart setup | Yes |
For exam boards and education institutions that want detailed KPI tracking without paying monthly SaaS fees, the Exam Boards KPI Dashboard in Excel sits in the sweet spot.
Who Should Use This Template
Click here to Purchase the Exam Boards KPI Dashboard in Excel
✅ Perfect for:
- Exam board administrators tracking pass rates, enrollment, and operational KPIs across multiple centers
- Education quality assurance teams monitoring assessment standards and compliance metrics
- School district coordinators comparing exam performance across institutions
- Academic consultants delivering performance reports to education clients
- State and national exam bodies needing a lightweight reporting tool alongside their core systems
❌ Not a fit if:
- You need real-time API integrations with student information systems like PowerSchool or Infinite Campus
- You are an individual teacher tracking classroom-level grades (a gradebook template is better suited)
- Your organization requires automated data feeds from LMS platforms like Blackboard, Canvas, or Moodle
Real-World Use Cases
Rajesh manages exam operations for a state education board in India. He uses the Exam Boards KPI Dashboard in Excel to track 15 KPIs including pass rates, exam center utilization, and result processing time across 200+ centers. Each quarter, he presents YTD performance to the board of directors — the conditional formatting arrows make it immediately clear which metrics need attention, without wading through raw data tables.
Maria coordinates assessments for a UK-based exam body covering 3 qualification levels. She enters monthly actual and target numbers for metrics like candidate registration growth, marking turnaround time, and appeals resolution rate. The KPI Trend charts help her spot declining metrics early enough to intervene before they become formal audit findings.
David runs quality assurance for a regional exam board in Nigeria. He tracks MTD and YTD performance for center accreditation compliance, question bank utilization, and examiner training completion. The Previous Year comparison helps him demonstrate year-over-year improvement to education ministry stakeholders — a requirement for continued accreditation.
Advantages of Exam Boards KPI Dashboard in Excel
Click here to Purchase the Exam Boards KPI Dashboard in Excel
- No recurring costs — $14.99 one-time purchase versus $6–$25/user/month for SaaS analytics platforms, saving education boards thousands annually
- No IT dependency — runs in standard Excel without macros, plugins, or IT infrastructure changes
- Full KPI customization — define your own KPIs with groups, units, formulas, definitions, and LTB/UTB classification
- Three-way comparison — Actual vs Target vs Previous Year for both MTD and YTD gives a complete performance picture
- Instant month switching — single dropdown on cell D3 refreshes the entire dashboard for any month
- Works offline — no internet required for Excel Desktop, ideal for exam boards in regions with limited connectivity
Opportunities for Improvement
- The template uses manual data entry — exam boards with automated data pipelines from student information systems may need to export and paste data monthly
- The dashboard does not include automated email alerts when KPIs breach thresholds; this would require VBA macros or integration with Power Automate
- For exam boards tracking 50+ KPIs, the single-page Dashboard view may become dense — consider splitting into departmental sub-dashboards for large organizations
- The Previous Year sheet supports only one prior year; organizations wanting 3-5 year trend analysis would need to extend the structure
Best Practices
Click here to Purchase the Exam Boards KPI Dashboard in Excel
- Define KPIs before entering data — start with the KPI Definition sheet to establish clear names, groups, and LTB/UTB classification before populating input sheets
- Update monthly — enter actual numbers promptly after each reporting period closes to keep the dashboard current and useful for decision-making
- Set realistic targets — align targets with your board’s strategic plan and historical baselines rather than aspirational numbers that make every KPI show red arrows
- Use the KPI Trend page for board presentations — the individual KPI view with definition + trend charts provides the context leadership needs without information overload
- Archive previous year data — before starting a new fiscal year, save a copy of the workbook to maintain historical records. Learn more about Excel dashboard techniques on Microsoft Excel Support
Explore Relevant Templates
📌 Secondary Schools Dashboard in Excel — Track student enrollment, attendance, and academic performance across secondary school departments.
📌 Primary Schools Dashboard in Excel — Monitor primary school KPIs including teacher-student ratios, test scores, and budget allocation.
📌 Tutoring Business Dashboard in Excel — Analyze tutoring session metrics, revenue, student progress, and tutor performance.
📌 Student Academic Performance Dashboard in Google Sheets — Also available in Google Sheets for teams preferring cloud-native analytics.
📌 Browse all Education Templates on NextGenTemplates for more academic analytics solutions.
Frequently Asked Questions
Click here to Purchase the Exam Boards KPI Dashboard in Excel
What KPIs does the Exam Boards KPI Dashboard track?
The Exam Boards KPI Dashboard in Excel tracks any KPIs you define — common examples include pass rate, candidate enrollment, exam center utilization, marking turnaround time, appeals resolution rate, and examiner training completion. You customize all KPIs on the KPI Definition sheet.
How long does setup take for the Exam Boards KPI Dashboard?
Setup takes under 10 minutes. Define your KPIs on the KPI Definition sheet, enter your actual and target numbers on the respective input sheets, and the Dashboard and KPI Trend pages update automatically with conditional formatting and charts.
Can I track both MTD and YTD performance?
Yes. The Exam Boards KPI Dashboard in Excel shows MTD Actual, Target, and Previous Year alongside YTD Actual, Target, and Previous Year for every KPI. Variance arrows indicate whether each metric is above or below target.
What does LTB and UTB mean in the KPI Definition sheet?
LTB stands for Lower the Better — used for metrics like error count or appeals rate where a decrease is favorable. UTB stands for Upper the Better — used for metrics like pass rate or enrollment growth. This classification controls how conditional formatting interprets performance.
How does this compare to Blackboard Analytics or a paid SaaS tool?
The Exam Boards KPI Dashboard costs $14.99 one-time versus $6–$25 per user per month for SaaS platforms. It offers the same KPI tracking and trend analysis without requiring IT integration, vendor contracts, or recurring fees.
Can I add more KPIs to this dashboard later?
Yes. Add new KPI rows on the KPI Definition sheet and enter corresponding data on the Actual, Target, and Previous Year input sheets. The Dashboard and KPI Trend pages will include the new metrics automatically.
Does this template work with Excel Online and SharePoint?
Yes. The Exam Boards KPI Dashboard in Excel is compatible with Excel Desktop, Excel Online, and SharePoint. Teams can collaborate on the same file through OneDrive or SharePoint with real-time co-authoring.
About the Author
Built by PK — Microsoft Certified Professional with 15+ years of Excel, Google Sheets, and Power BI experience. Founder of NextGenTemplates, reaching 300K+ subscribers across YouTube channels. Every template is hand-built and tested before release.
Conclusion
The Exam Boards KPI Dashboard in Excel gives exam board administrators, quality assurance teams, and education coordinators a structured way to track MTD and YTD performance against targets and prior year benchmarks — all in a single Excel workbook with 7 organized sheets, conditional formatting arrows, and trend charts.
Click here to Purchase the Exam Boards KPI Dashboard in Excel
✅ Instant download · One-time payment · No subscription · Lifetime access
🎥 Visit our YouTube channel for step-by-step video tutorials: Youtube.com/@PK-AnExcelExpert