Managing photography projects, bookings, clients, and payments can quickly become overwhelming—especially when your business starts growing. As a photographer or studio owner, you must stay on top of several performance areas like total bookings, payment tracking, client satisfaction, and photo editing progress.
The Photography Dashboard in Excel offers a smart, ready-to-use solution that helps you monitor and analyze all your photography business metrics in one place. Whether you run a wedding photography studio, a corporate photography agency, or a freelance creative business, this Excel-based dashboard simplifies data management and boosts efficiency.
In this detailed guide, we’ll explore everything about the Photography Dashboard in Excel—its structure, features, benefits, and best practices. You’ll also learn how it can transform how you track bookings, manage revenue, and delight your clients.
Click to buy Photography Dashboard in Excel
What Is a Photography Dashboard in Excel?
A Photography Dashboard in Excel is an interactive and visual analytics tool built entirely in Microsoft Excel. It consolidates your data—like bookings, payments, client feedback, photo editing status, and lead sources—into one centralized dashboard.
Instead of jumping between multiple spreadsheets, the dashboard presents all your information through easy-to-read charts, KPI cards, and trend visuals.
It’s perfect for:
- Professional photographers managing multiple clients.
- Photography studios tracking shoots, payments, and packages.
- Freelancers analyzing income sources and performance trends.
- Creative agencies monitoring client satisfaction across different lead channels.
This dashboard is completely customizable, dynamic, and requires no coding knowledge—you can simply enter your data and get instant visual insights.
Structure of the Photography Dashboard in Excel
The dashboard includes several interconnected sheets that work together to give a 360° view of your business performance. Each sheet focuses on a specific area of analysis.
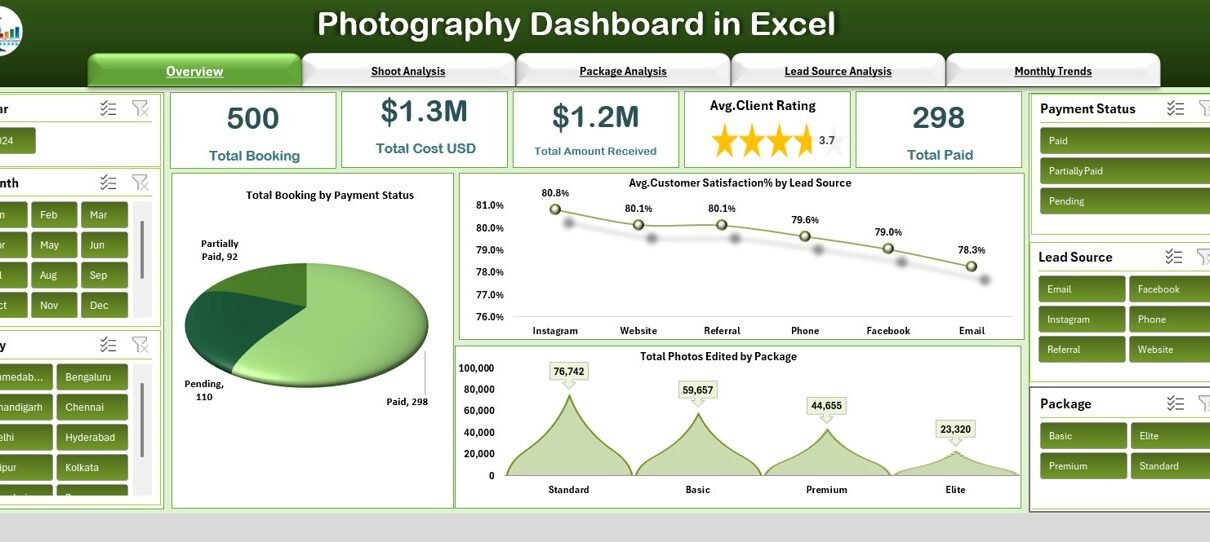
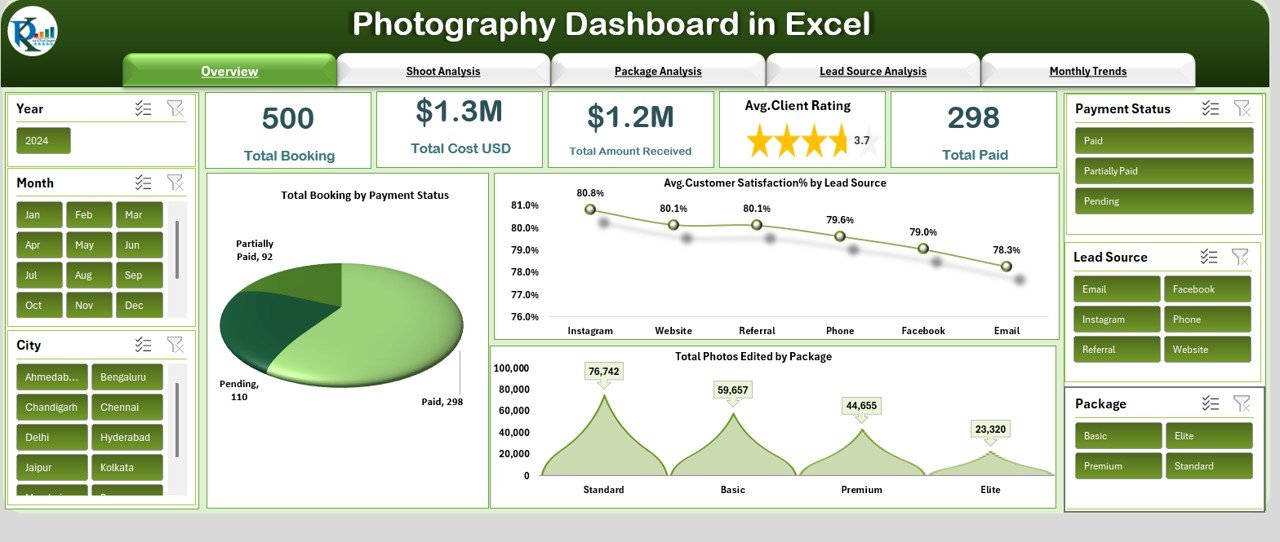
Overview Sheet Tab
This is the main hub of the dashboard. It displays key performance indicators (KPIs) in card format and interactive visuals for quick insights.
Cards Displayed:
- Total Bookings – Total number of photography sessions booked.
- Total Cost (USD) – Total expenses incurred across all shoots.
- Total Amount Received (USD) – Cumulative revenue earned.
- Avg. Client Rating – Average rating given by clients after their sessions.
- Total Paid – Total number of bookings that have been fully paid.
Charts Displayed:
- Total Bookings by Payment Status – Shows how many clients have paid, are pending, or partially paid.
- Average Customer Satisfaction (%) by Lead Source – Reveals which marketing source (social media, referral, website, etc.) generates the most satisfied clients.
- Total Photos Edited by Package – Tracks the editing progress and workload based on package type.
This page provides a quick snapshot of your photography business performance—ideal for daily reviews or client reporting.
Click to buy Photography Dashboard in Excel
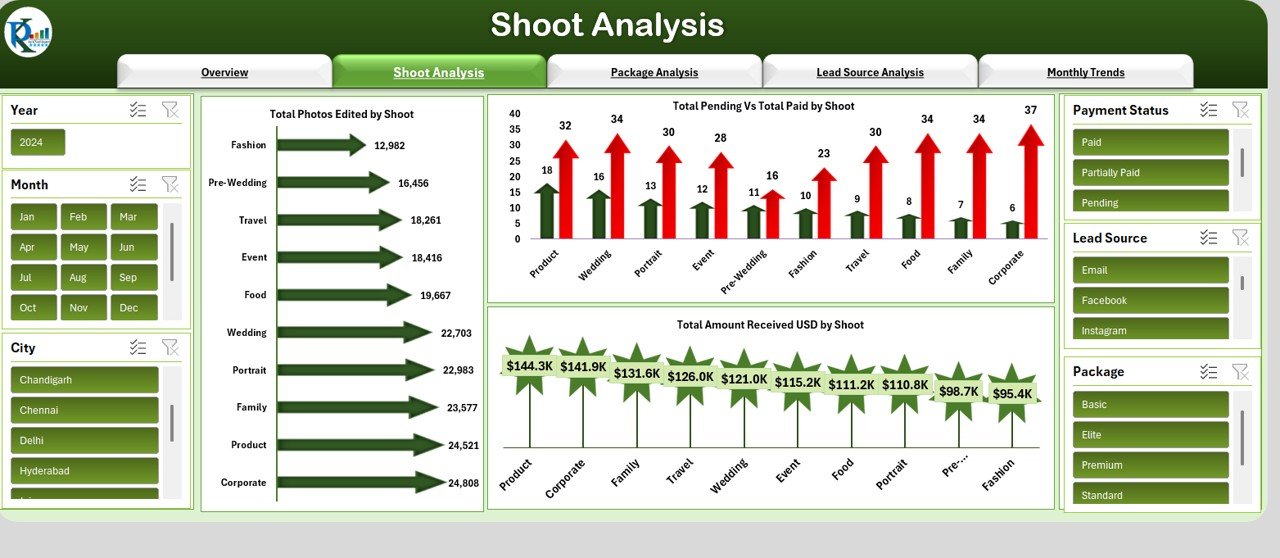
Shoot Analysis Sheet
The Shoot Analysis sheet gives detailed insights into performance at the shoot level.
Charts Included:
- Total Photos Edited by Shoot – Displays how many photos have been edited for each shoot.
- Total Pending vs Total Paid by Shoot – Helps identify outstanding payments and cash flow status.
- Total Amount Received (USD) by Shoot – Shows revenue per individual shoot.
This analysis allows you to monitor operational efficiency, editing timelines, and financial collections shoot by shoot.
Click to buy Photography Dashboard in Excel
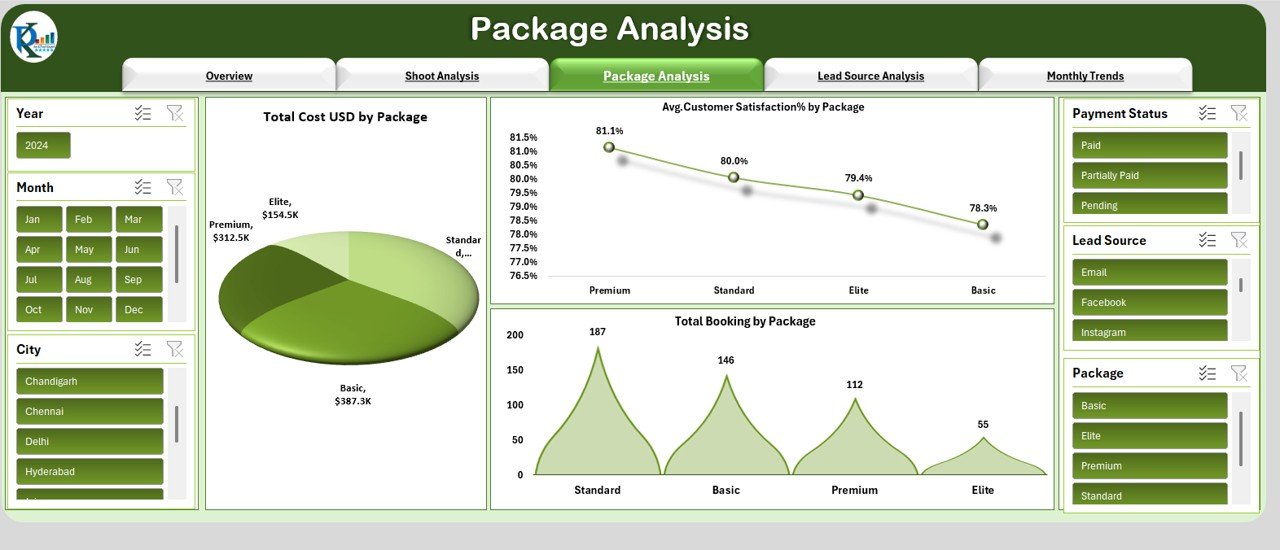
Package Analysis Sheet
Different photography packages often generate different levels of profit and satisfaction. This sheet helps you compare and optimize package offerings.
Charts Displayed:
- Total Cost (USD) by Package – Analyzes cost structure and profitability by package type.
- Average Customer Satisfaction (%) by Package – Highlights which packages lead to higher customer happiness.
- Total Bookings by Package – Reveals the popularity of each photography package.
Using this analysis, photographers can refine pricing, enhance packages, and focus on high-performing services.
Click to buy Photography Dashboard in Excel
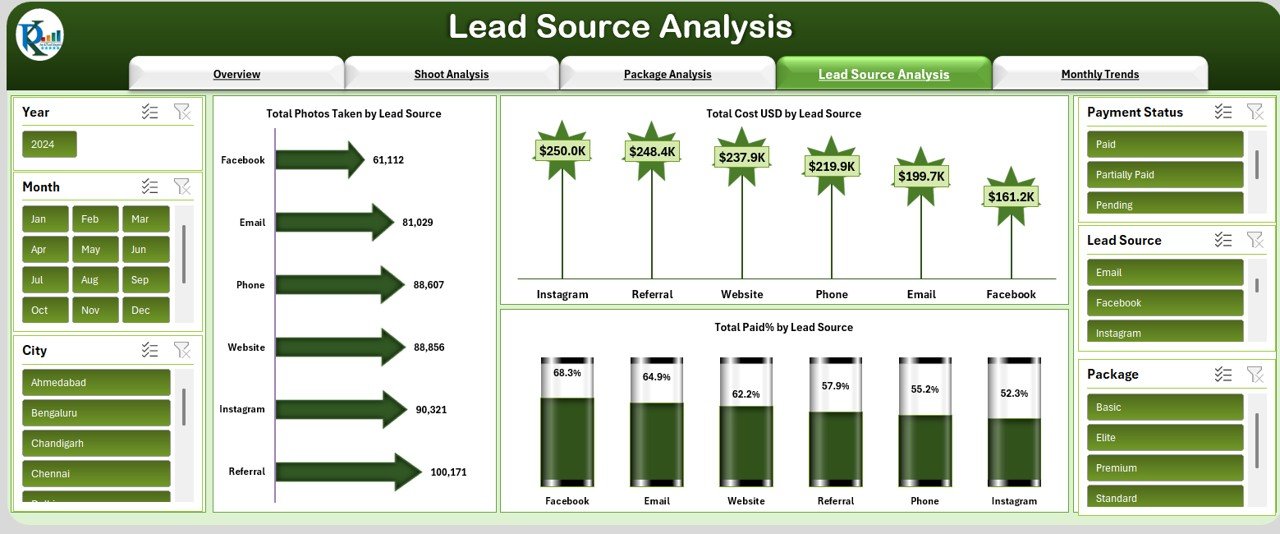
Lead Source Analysis Sheet
Understanding where your clients come from is key to refining your marketing strategy.
Charts Displayed:
- Total Photos Taken by Lead Source – Connects shoot volume to lead generation channels.
- Total Cost (USD) by Lead Source – Tracks how much is spent acquiring clients from each source.
- Total Paid (%) by Lead Source – Measures the payment completion rate by lead source.
This helps you evaluate ROI across marketing platforms such as Instagram, Facebook, word-of-mouth, or your website.
Click to buy Photography Dashboard in Excel
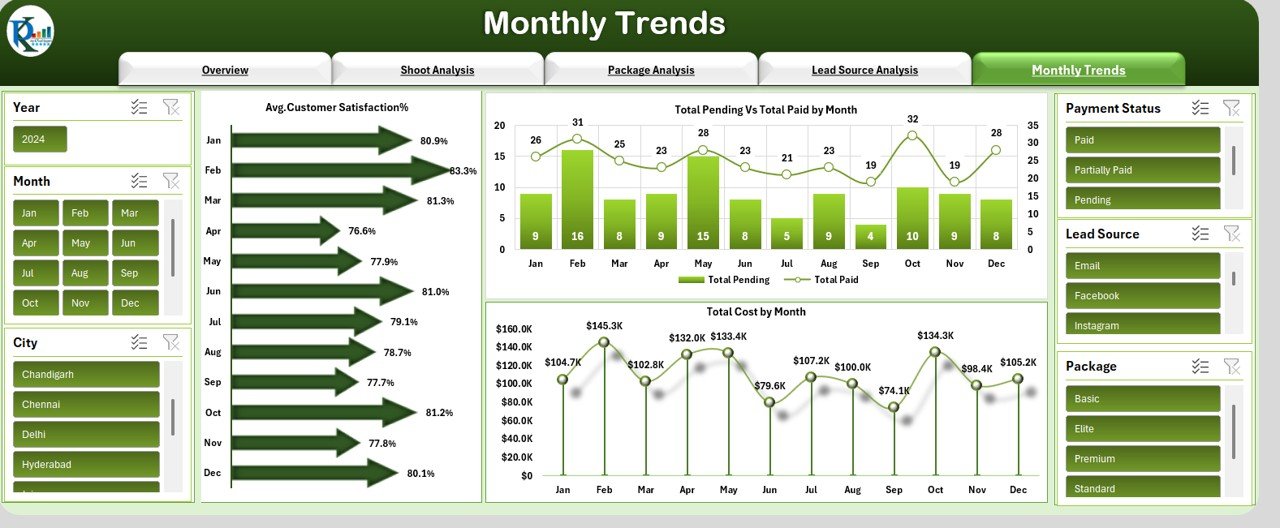
Monthly Trends Sheet
The Monthly Trends sheet focuses on performance over time—perfect for identifying seasonal patterns.
Charts Displayed:
- Average Customer Satisfaction (%) – Tracks how client ratings evolve month by month.
- Total Pending vs Total Paid by Month – Visualizes cash flow trends.
- Total Cost by Month – Displays monthly cost distribution to understand budget utilization.
This section is essential for forecasting future performance, planning workload distribution, and managing financial targets.
Click to buy Photography Dashboard in Excel
Advantages of the Photography Dashboard in Excel
Using a photography dashboard can transform how you manage your business. Below are the major benefits:
- Centralized Data Management
You no longer need multiple spreadsheets. The dashboard consolidates bookings, payments, client reviews, and shoot performance in one file.
- Improved Financial Tracking
With real-time visuals on payments and costs, you can quickly identify pending amounts and high-profit shoots.
- Time-Saving Automation
The dashboard updates all charts automatically when you refresh or add new data—no manual calculation needed.
- Better Client Insights
You can easily see which lead source brings in the happiest clients and which packages drive the most sales.
- Data-Driven Decision Making
From analyzing satisfaction levels to tracking editing progress, the dashboard empowers you to make smart, evidence-based business decisions.
- Enhanced Marketing Strategy
By identifying your most successful lead channels, you can focus your marketing efforts where they matter most.
- Customization Flexibility
The dashboard is fully customizable. You can add KPIs, modify charts, or tailor visuals to your brand.
How to Use the Photography Dashboard Effectively
To make the most of this Excel dashboard, follow these simple steps:
- Input Your Data Regularly:
Add every new booking, payment update, and client review promptly. - Define KPIs Clearly:
Decide which metrics matter most—revenue, satisfaction, or cost efficiency. - Use Filters and Slicers:
Filter data by month, package, or lead source to get deeper insights. - Analyze Trends Monthly:
Review your performance every month to identify what’s working well. - Focus on Underperforming Areas:
If certain lead sources or packages underperform, investigate and adjust strategies. - Keep Data Consistent:
Maintain consistent data formatting (e.g., date, currency, rating scale) to ensure accurate analysis.Add New KPIs: Include additional metrics such as editing turnaround time or referral rate.
- Use Conditional Formatting: Highlight overdue payments or low ratings automatically.
- Insert Slicers: Add slicers for month, client, or shoot type to create an interactive experience.
- Incorporate Pivot Charts: Use pivot charts for deeper data segmentation.
- Link to External Files: Connect your Excel dashboard with Google Sheets or CRM exports for live data feeds.
Best Practices for the Photography Dashboard in Excel
To ensure smooth usage and reliable insights, follow these best practices:
Keep Data Entry Clean and Structured
Use standardized input formats (e.g., “MM/DD/YYYY” for dates, consistent capitalization for package names). This ensures all formulas and charts update correctly.
Review Dashboard Monthly
Set a monthly review routine to analyze performance trends and update strategies.
Secure Your Data
If multiple users access the file, protect sheets or set password permissions to avoid accidental edits.
Use Visual Cues Wisely
Limit colors to highlight important insights—use green for success, red for issues, and yellow for pending actions.
Track Customer Feedback
Add a separate column in your data tab to record client feedback and use it to enhance service quality.
Back Up Regularly
Keep a backup copy to avoid losing historical data or analytics settings.
Continuously Update KPIs
As your business evolves, revise or expand the KPIs to match new services or client expectations.
Conclusion
The Photography Dashboard in Excel empowers photographers to make informed, data-driven decisions without needing specialized software. From tracking bookings and payments to analyzing client satisfaction and profitability, this dashboard brings every key insight together.
By regularly updating your data, customizing KPIs, and following best practices, you’ll unlock valuable business intelligence that helps improve client relationships, streamline operations, and boost revenue.
Whether you’re managing a large studio or running a solo business, this Excel dashboard is your all-in-one photography management companion.
Frequently Asked Questions (FAQs)
- What is the main purpose of a Photography Dashboard in Excel?
It helps photographers track performance metrics like bookings, payments, client satisfaction, and photo editing progress in one place.
- Can beginners use this dashboard easily?
Yes! The dashboard is fully user-friendly—no coding or advanced Excel skills are required.
- Can I customize the KPIs and charts?
Absolutely. You can add, remove, or rename KPIs, and modify charts to match your specific needs.
- How often should I update my data?
It’s best to update your data daily or weekly for the most accurate results.
- Does this dashboard work on Mac and Windows?
Yes. It’s compatible with both Mac and Windows versions of Microsoft Excel.
- Can I use this dashboard for different photography types?
Yes! It’s adaptable for wedding, event, product, portrait, or corporate photography.
- Does the dashboard calculate profits automatically?
Yes. Once you enter your cost and revenue data, formulas automatically calculate profit margins and totals.
- Is it possible to track client satisfaction in this dashboard?
Yes. You can add or import ratings and feedback for each client to monitor satisfaction trends.
- Can I share this dashboard with my team?
Yes. You can share it via cloud drives like OneDrive or Google Drive for collaborative updates.
- Is this dashboard suitable for freelancers?
Definitely! Freelancers can use it to manage shoots, monitor cash flow, and evaluate marketing effectiveness.
Visit our YouTube channel to learn step-by-step video tutorials
Watch the step-by-step video tutorial:
Click to buy Photography Dashboard in Excel