Port projects involve large budgets, complex timelines, multiple contractors, strict SLAs, and high operational risks. Because of this complexity, port authorities and logistics organizations need accurate, real-time visibility into cost, schedule, performance, and risk. However, many teams still depend on scattered Excel files, manual status reports, and static presentations. As a result, decision-making becomes slow and reactive.
A Port Project Management Dashboard in Excel solves this problem effectively. It brings all project data into one interactive, ready-to-use dashboard. Moreover, it transforms raw project information into clear insights that support faster and smarter decisions.
In this article, we will explain how this dashboard works, what each sheet shows, and how port organizations can use it to control cost, manage risk, and improve project delivery.
What Is a Port Project Management Dashboard in Excel?
A Port Project Management Dashboard in Excel is a centralized reporting and monitoring tool designed specifically for managing port-related projects. It tracks project progress, budget vs actual cost, revenue, profit, delays, SLA compliance, and risk levels in one place.
Because the dashboard is built in Excel, it offers:
-
Easy data entry
-
Automatic calculations
-
Interactive charts
-
Clear performance indicators
-
No dependency on expensive software
As a result, project managers, finance teams, and port leadership gain instant visibility into project health.🧩 Key Features of the Dashboard
This dashboard is a ready-to-use solution and includes:
-
An Overview Sheet with KPI cards
-
Multiple analysis sections for cost, schedule, risk, and SLA
-
Monthly trend tracking
-
Clean visuals for executive reporting
Let’s explore each section in detail.📊 Overview Sheet Tab
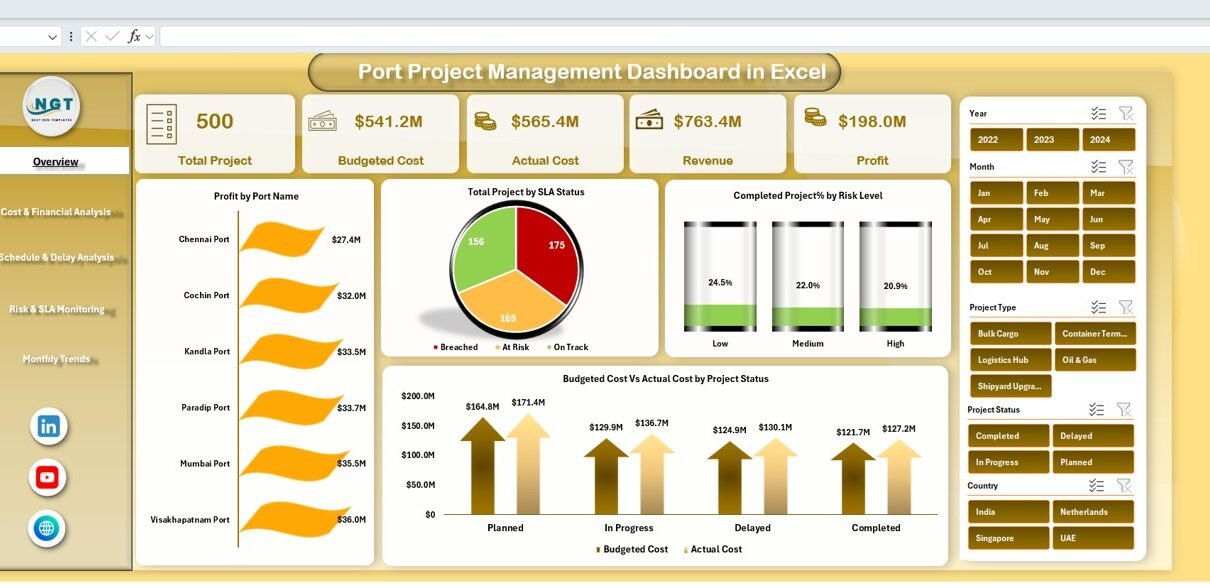
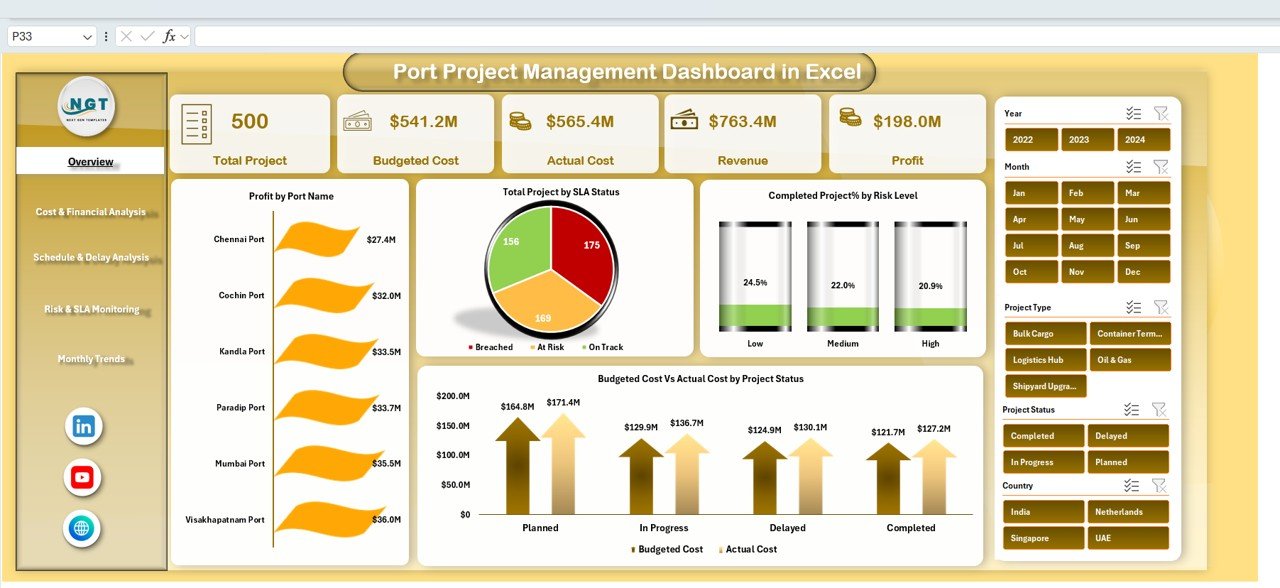
The Overview Sheet acts as the executive summary of the entire dashboard. It shows key project KPIs at a glance.
KPI Cards in the Overview Sheet
Click to Buy Port Project Management Dashboard in Excel
Total Project
Shows the total number of port projects currently tracked.
Budgeted Cost
Displays the total planned budget for all projects.
Actual Cost
Shows how much cost has already been incurred.
Revenue
Highlights the total revenue generated from port projects.
Profit
Calculates profit by subtracting actual cost from revenue.
These KPI cards help leadership understand overall financial health instantly.
Charts in the Overview Sheet
Profit by Port Name
This chart compares profit across different ports and highlights top-performing locations.
Total Project by SLA Status
Shows how many projects meet SLA, breach SLA, or remain under review.
Completed Project % by Risk Level
Helps understand how project risk affects completion rates.
Budgeted Cost vs Actual Cost by Project Status
Clearly highlights cost overruns or savings based on project progress.
Click to Buy Port Project Management Dashboard in Excel
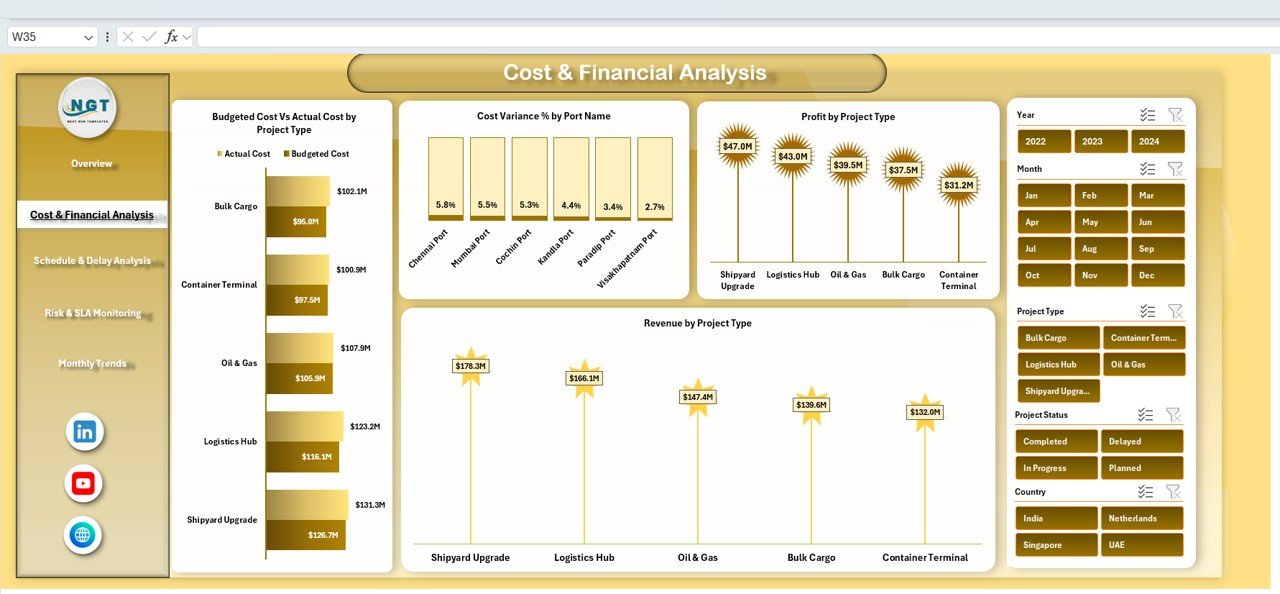
Cost & Financial Analysis
This section focuses on financial control and profitability.
Cost & Financial Charts
Budgeted Cost vs Actual Cost by Project Type
Identifies which types of port projects tend to exceed budgets.
Cost Variance % by Port Name
Highlights ports with strong or weak cost control.
Profit by Project Type
Shows which project categories generate higher margins.
Revenue by Project Type
Helps prioritize project types with better revenue potential.
Because financial visibility remains critical in port operations, this section plays a key role in cost governance.
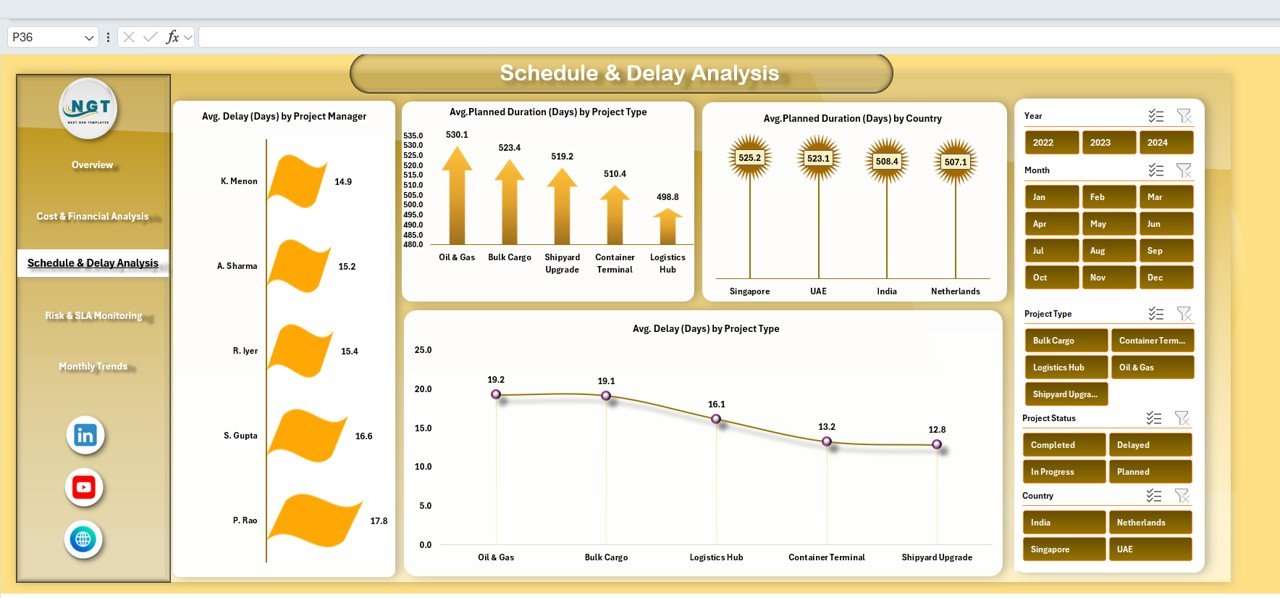
Schedule & Delay Analysis
Delays in port projects cause operational disruption and financial loss. Therefore, this section focuses on timeline performance.
Click to Buy Port Project Management Dashboard in Excel
Schedule & Delay Charts
Average Delay (Days) by Project Manager
Identifies managers who consistently deliver on time or face delays.
Average Planned Duration (Days) by Project Type
Helps compare planned timelines across project categories.
Average Planned Duration (Days) by Country
Supports benchmarking across geographic regions.
Average Delay (Days) by Project Type
Highlights which project types are more prone to delays.
With these insights, project leaders can take preventive action early.
Click to Buy Port Project Management Dashboard in Excel
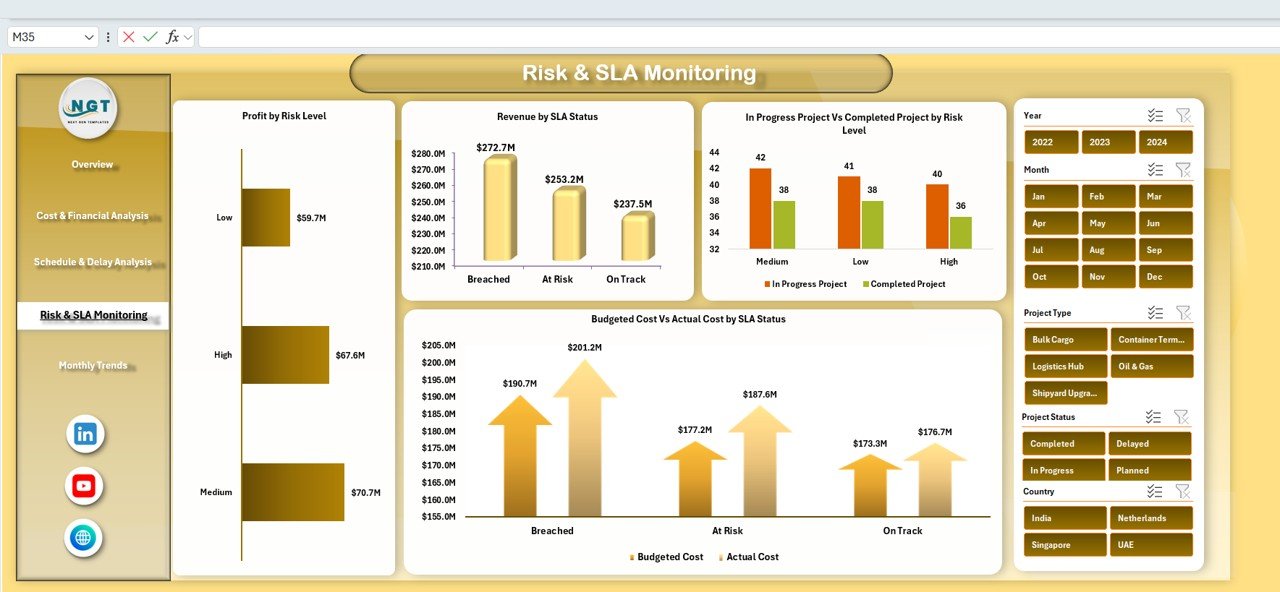
Risk & SLA Monitoring
Risk and SLA compliance define success in port projects. This section ensures strong governance.
Risk & SLA Charts
Profit by Risk Level
Shows how risk exposure affects profitability.
Revenue by SLA Status
Helps understand revenue impact of SLA compliance.
In-Progress vs Completed Projects by Risk Level
Highlights how risk slows or accelerates completion.
Budgeted Cost vs Actual Cost by SLA Status
Reveals whether SLA breaches lead to cost overruns.
This section enables leadership to manage risks proactively instead of reactively.
Click to Buy Port Project Management Dashboard in Excel
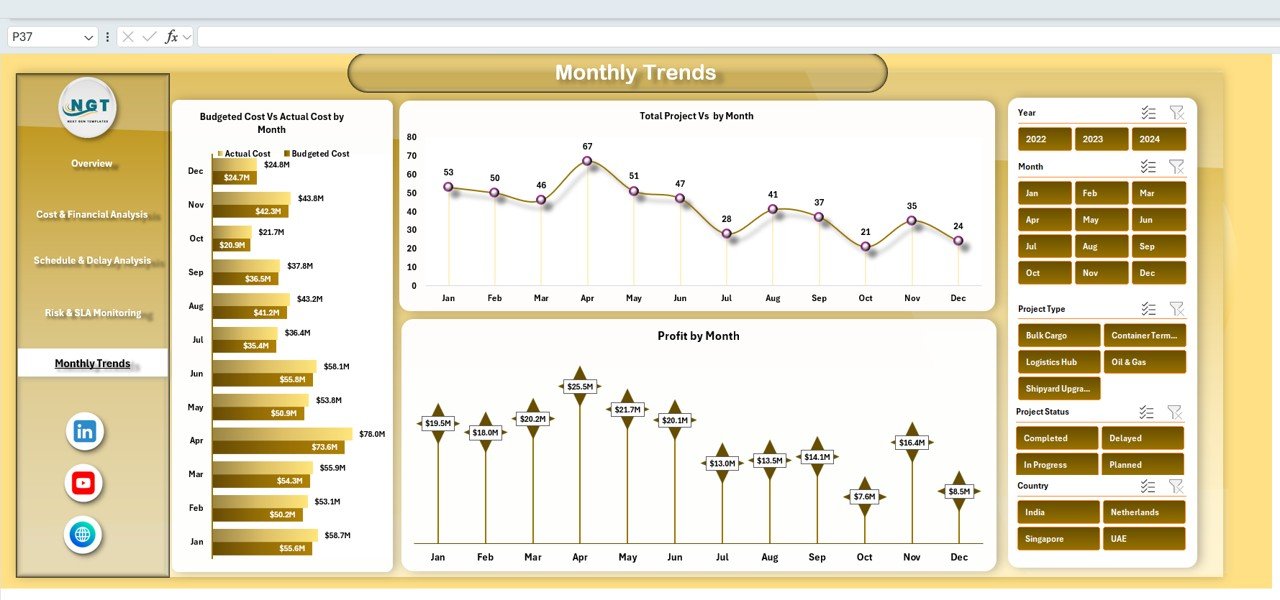
Monthly Trends Analysis
Monthly trends help teams understand performance patterns over time.
Monthly Trend Charts
Budgeted Cost vs Actual Cost by Month
Shows cost control consistency across months.
Total Projects by Month
Tracks workload fluctuations and resource demand.
Profit by Month
Helps identify seasonal profitability patterns.
Because port operations often show seasonal variation, these trends support long-term planning.
Click to Buy Port Project Management Dashboard in Excel
Advantages of Using a Port Project Management Dashboard in Excel
Centralized project visibility
All project metrics stay in one place.
Better cost control
Teams identify overruns early.
Improved decision-making
Leadership uses real-time insights.
Enhanced SLA monitoring
Compliance tracking becomes transparent.
Reduced reporting effort
Automation replaces manual reports.
High flexibility
Excel allows easy customization.
Opportunities for Improvement
Although this dashboard is powerful, organizations can enhance it further by adding:
-
Forecasted cost and revenue projections
-
Earned Value Management (EVM) metrics
-
Automated data refresh from ERP systems
-
Risk scoring models
-
Contractor penalty and incentive tracking
These additions make the dashboard even more strategic.
Best Practices for Using This Dashboard
Click to Buy Port Project Management Dashboard in Excel
-
Update project data regularly
-
Review cost variance weekly
-
Monitor SLA compliance proactively
-
Use monthly trends for forecasting
-
Share dashboard insights during review meetings
-
Standardize data entry across ports
Following these practices ensures consistent and reliable insights.
Conclusion
A Port Project Management Dashboard in Excel provides a powerful, practical, and cost-effective way to manage complex port projects. It improves visibility into cost, schedule, risk, and profitability while enabling faster decisions. Because the dashboard is easy to use and fully customizable, it suits port authorities, logistics companies, and infrastructure operators alike.
By using this dashboard, organizations gain stronger control, improved transparency, and better project outcomes across all port operations.
Frequently Asked Questions (FAQs)
Click to Buy Port Project Management Dashboard in Excel
1. Who should use this dashboard?
Port authorities, project managers, finance teams, and operations leaders.
2. Can this dashboard handle multiple ports?
Yes, it supports multi-port analysis easily.
3. Does it require advanced Excel skills?
No, basic Excel knowledge is enough.
4. Can I add more KPIs?
Yes, the dashboard is fully customizable.
5. Is it suitable for executive reporting?
Absolutely. The visuals are executive-ready.
6. Can it support monthly reporting?
Yes, monthly trend analysis is built in.
Visit our YouTube channel to learn step-by-step video tutorials
Watch the step-by-step video tutorial:
Click to Buy Port Project Management Dashboard in Excel