In today’s unpredictable business environment, managing risk effectively is not a luxury—it’s a necessity. Whether you’re part of a large corporation or a growing startup, knowing which risks threaten your goals can help you take proactive steps before it’s too late.
That’s where a Risk Management Dashboard in Excel comes into play. It brings clarity, structure, and strategy to how your organization monitors, evaluates, and responds to risk. And the best part? You can build and use this tool directly in Microsoft Excel—no costly software required.
In this guide, you’ll learn how this dashboard works, why you need it, how to set it up, best practices to follow, and the opportunities it offers to improve your risk strategy.
What Is a Risk Management Dashboard in Excel?
A Risk Management Dashboard is a centralized Excel-based tool that helps organizations visualize and track key risk metrics. It allows you to:
-
Record risk events
-
Monitor impact and probability
-
Track mitigation efforts
-
Review trends over time
-
Assign owners and responsibility
Built across multiple interconnected worksheets, this dashboard helps you understand risk at a glance and make decisions backed by real-time data.
Key Components of the Risk Management Dashboard
Risk Management Dashboard in Excel
Let’s explore each worksheet in this Excel dashboard and what it brings to your risk management strategy:
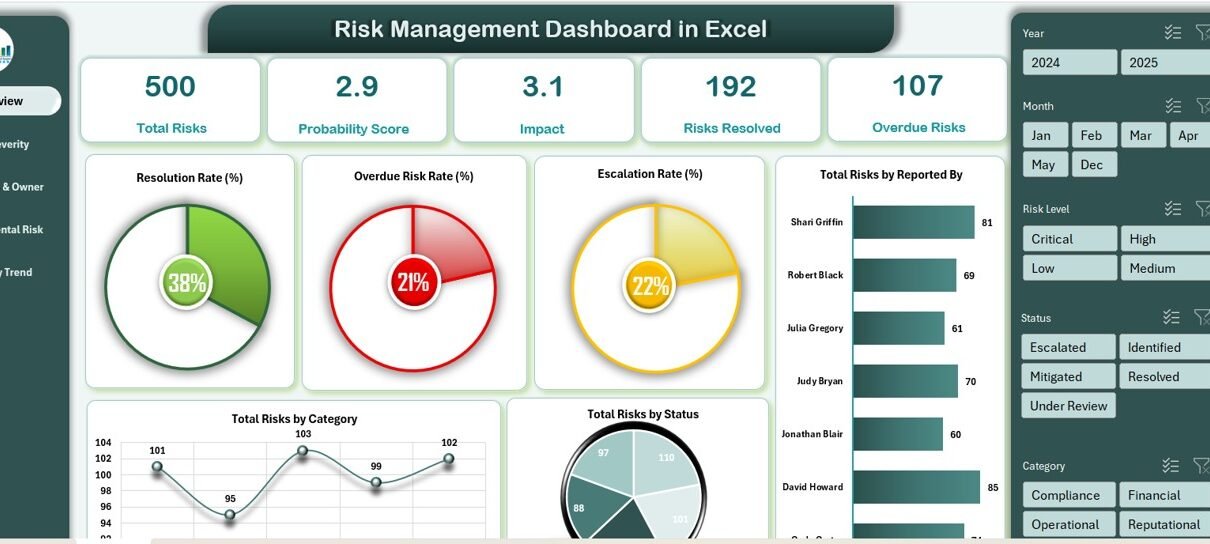
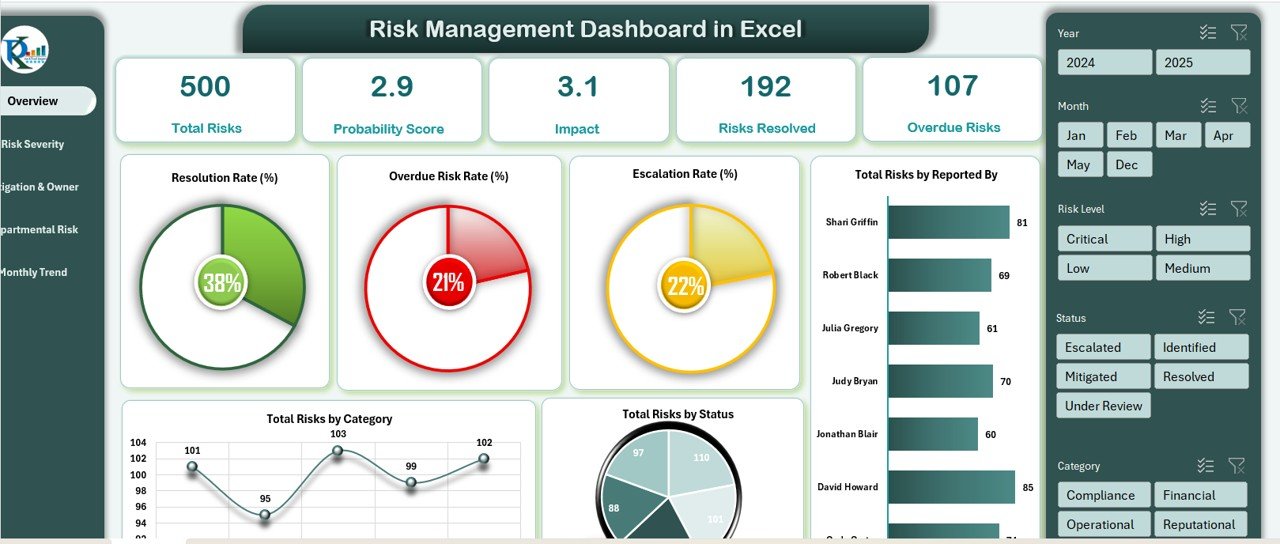
Overview Sheet Tab
The Overview page is the heart of your dashboard. It provides a snapshot of key performance indicators (KPIs) and trends.
KPI Cards Display:
-
Total Risks – Number of risks currently logged.
-
Probability Score – Average probability score of all risks.
-
Impact – Average impact rating across all risks.
-
Risks Resolved – Total risks that have been successfully closed.
-
Overdue Risks – Risks that missed their resolution deadline.
Visual Charts Include:
-
Resolution Rate (%) – % of resolved risks vs. total.
-
Overdue Risk Rate (%) – % of unresolved risks beyond the due date.
-
Escalation Rate (%) – Risks flagged as escalated.
-
Risks by Reporter – Who submitted each risk.
-
Risks by Category – Types of risks (e.g., Financial, Operational).
-
Risks by Status – Open, In Progress, Closed, Escalated.
These visual elements help decision-makers spot issues quickly and prioritize action.
Risk Management Dashboard in Excel
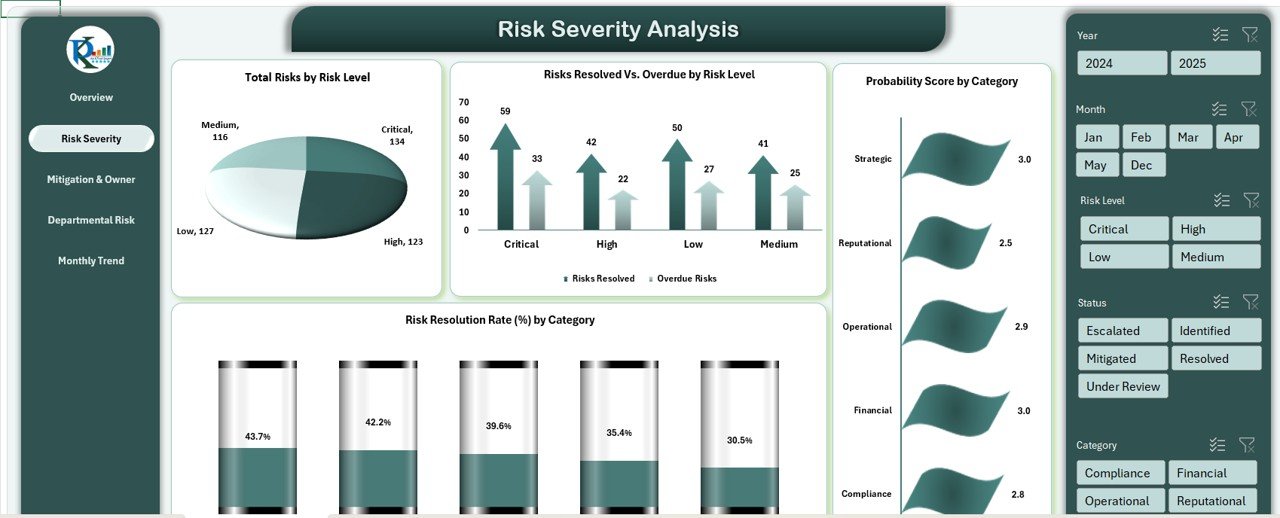
Risk Severity Analysis Sheet Tab
This sheet breaks risks down by severity, giving clarity on the most critical threats.
Charts Include:
-
Risks by Risk Level – Low, Medium, High, Critical.
-
Resolved vs. Overdue Risks by Level – See progress by severity.
-
Probability Score by Category – Understand which risk types are most likely to occur.
-
Resolution Rate by Category – How effective is your mitigation per category?
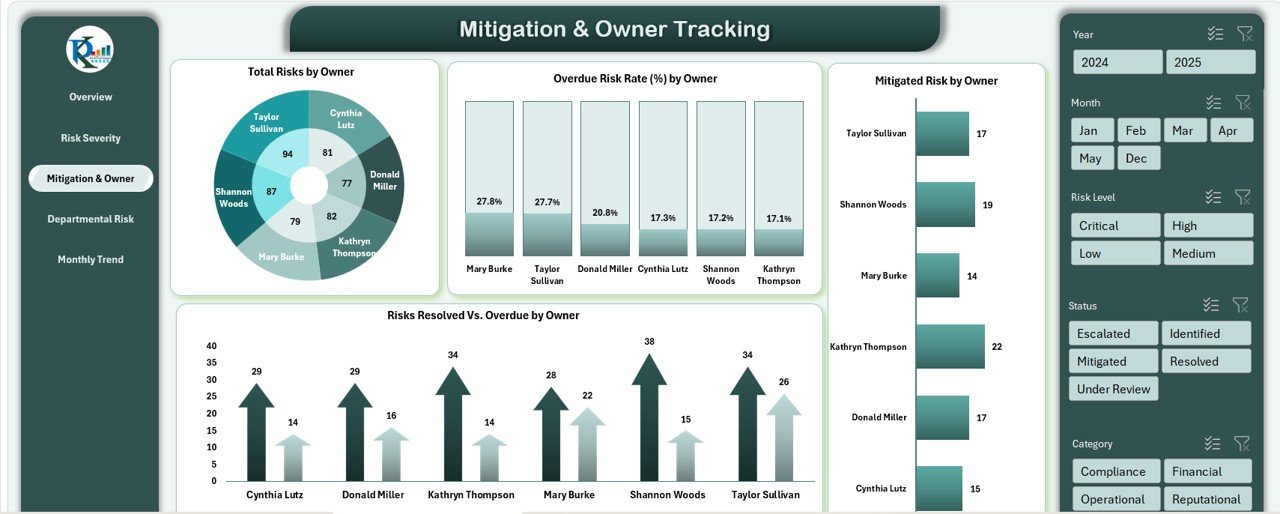
Mitigation & Owner Tracking Sheet Tab
Knowing who owns each risk is essential. This sheet provides accountability and ownership insights.
Key Charts:
-
Total Risks by Owner – Tracks how many risks each person is managing.
-
Overdue Rate by Owner – Highlights performance issues.
-
Mitigated Risks by Owner – Visualizes completed mitigations.
-
Resolved vs. Overdue by Owner – Compares progress by individual/team.
Risk Management Dashboard in Excel
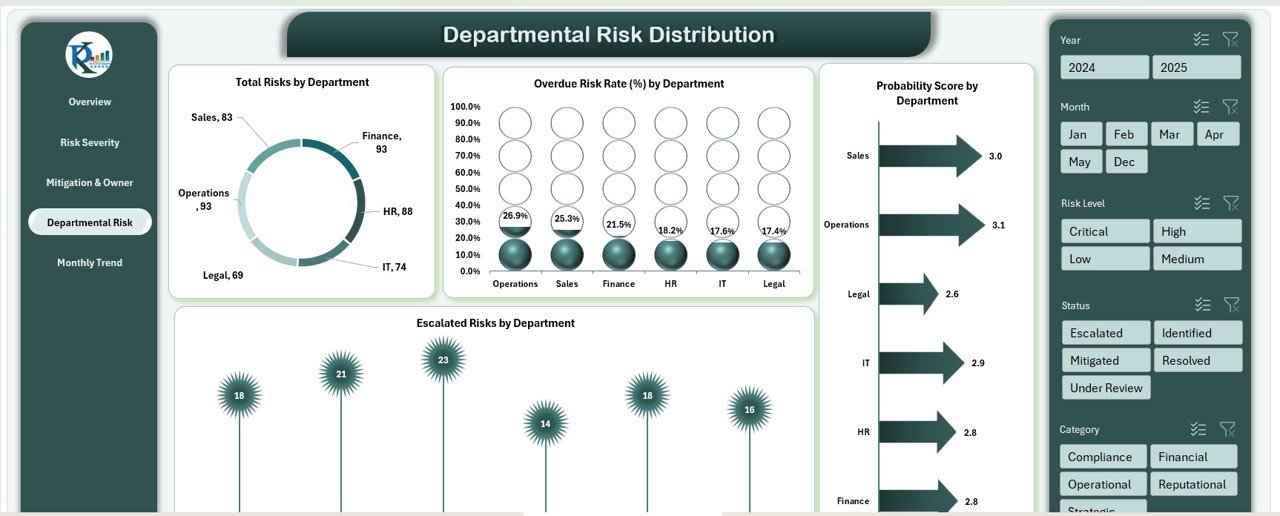
Departmental Risk Distribution Sheet Tab
Some departments may carry higher risks than others. This sheet helps identify those risk concentrations.
Charts Include:
-
Risks by Department
-
Overdue Rate by Department
-
Probability Score by Department
-
Escalated Risks by Department
This allows managers to allocate resources more effectively and address high-risk departments proactively.
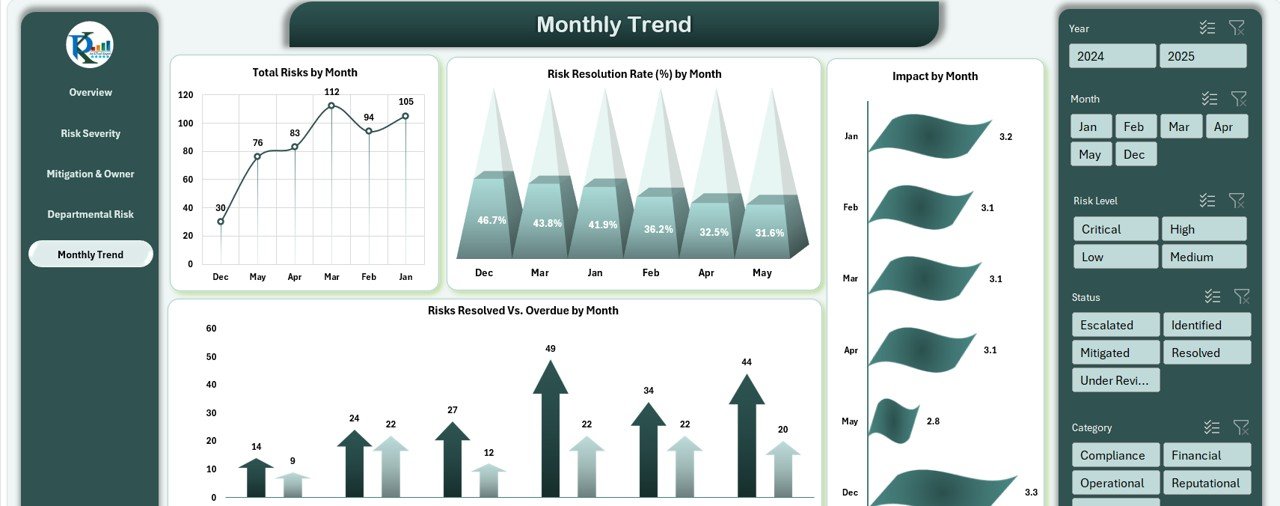
Monthly Trend Sheet Tab
Risk management isn’t static. Trends reveal how well your mitigation strategies perform over time.
Included Charts:
-
Total Risks by Month
-
Resolution Rate by Month
-
Impact by Month
-
Resolved vs. Overdue by Month
By analyzing these trends, you can refine your approach month by month.
Risk Management Dashboard in Excel
Data Sheet Tab
All your data entries live here. This is the backend where users input new risks and update ongoing ones.
Advantages of Risk Management Dashboard in Excel
So, why should you use this dashboard over more complex software or spreadsheets?
- Ease of Use: You don’t need to be a tech expert. With basic Excel skills, you can operate, maintain, and customize this dashboard.
- Cost-Effective: Forget about paying for high-end risk software. This Excel template is affordable and scalable for small to large businesses.
- Real-Time Insights; See updated charts and KPIs as soon as the data changes. This helps you act quickly when new threats arise.
- Data Centralization: Track everything in one place—from owners to deadlines and impact ratings—ensuring everyone’s on the same page.
- Customization: You can add new categories, modify status types, or even include automation using Excel VBA or Power Query.
Opportunities to Improve Risk Management with This Dashboard
Risk Management Dashboard in Excel
Even though this Excel dashboard is powerful, you can take it further:
- Automate Alerts for Overdue Risks: Set conditional formatting or use Excel VBA to trigger email notifications when a risk passes its deadline.
- Link to External Systems: Use Power Query to pull data from external tools like SharePoint, Microsoft Forms, or Google Sheets.
- Add Mobile Entry Support: Connect a Power App or Google Form for mobile-friendly risk submission.
- Include Risk Mitigation Effectiveness Ratings; Ask users to rate mitigation success post-resolution to refine your strategy.
- Add Budget/Cost Tracking: Track how much each risk costs the company or what the financial impact could be.
Best Practices for Using a Risk Management Dashboard
Here are practical strategies to maximize the dashboard’s impact:
- Keep It Updated Weekly: Old data equals poor decisions. Make it a routine to review and update risk entries weekly.
- Assign Clear Ownership: Every risk must have an owner. Without ownership, no one feels responsible.
- Set Realistic Deadlines: Allow enough time for resolution but don’t stretch it. Balance urgency with feasibility.
- Regularly Review Trends: Use the Monthly Trend and Severity tabs during your risk review meetings.
- Encourage Team Feedback; Ask users what improvements they need—this helps you make the dashboard more intuitive over time.
Conclusion
The Risk Management Dashboard in Excel empowers businesses to handle uncertainty with confidence. It’s not just a spreadsheet—it’s a smart, affordable, and visual tool that helps you identify, monitor, and mitigate risks effectively.
Visit our YouTube channel to learn step-by-step video tutorials
Watch the step-by-step video Demo:
Risk Management Dashboard in Excel