Introduction
The Robotics Training Institutes KPI Dashboard is a comprehensive and ready-to-use template designed to help managers and decision-makers track, analyze, and optimize key performance indicators (KPIs) crucial to the success of robotics training centers. This insightful dashboard offers a structured way to manage data across months and years, enabling data-driven strategies for enhancing training outcomes and operational efficiency.Robotics Training Institutes KPI Dashboard in ExcelRobotics Training Institutes KPI Dashboard in Excel
Key Features of Robotics Training Institutes KPI Dashboard
- Seven well-organized worksheets allowing easy navigation and data entry.
- Dynamic filtering options, such as month and KPI selection, for customized data views.
- Comparative analysis with previous year data and clear visualization of performance against targets using conditional formatting.
- Trend charts that provide insights into both monthly-to-date (MTD) and year-to-date (YTD) performance.
- Dedicated sheets to input actual, target, and previous year numbers with flexibility for changes based on months.
- Comprehensive KPI definitions to give users clarity on what each metric means and how it’s calculated.Robotics Training Institutes KPI Dashboard in Excel
Dashboard Pages Explanation
1. Home Sheet
The Home sheet functions as the dashboard’s main index with six handy buttons to jump straight to relevant sheets, improving navigation efficiency.
 Home Page
Click to Buy Robotics Training Institutes KPI Dashboard in Excel
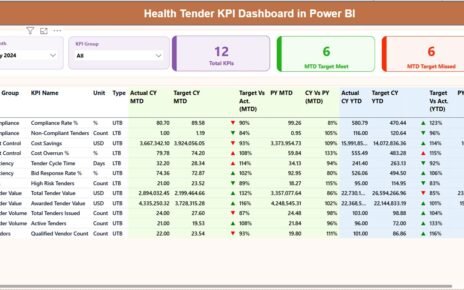
2. Dashboard Sheet
This is the heart of the dashboard showcasing all KPIs simultaneously. Users can select the month via a drop-down (cell D3), which updates all numbers dynamically. It displays MTD and YTD values for Actuals, Targets, and Previous Year data, along with performance indicators using up/down arrows and conditional formatting for easy interpretation.Robotics Training Institutes KPI Dashboard in Excel
 Robotics Training Institutes KPI Dashboard
3. KPI Trend Sheet
This sheet enables deep dives into specific KPIs. Users select a KPI from the drop-down in cell C3, revealing KPI Group, Unit, Type (Lower the Better or Upper the Better), formula, and definition. It also presents detailed MTD and YTD trend charts for Actual, Target, and Previous Year values, making it simple to analyze performance over time.
 KPI Trend Sheet
Click to Buy Robotics Training Institutes KPI Dashboard in Excel
4. Actual Numbers Input Sheet
This input sheet is where users enter actual data for MTD and YTD figures per month. The starting month of the year can be adjusted in cell E1, allowing flexibility depending on organizational fiscal calendars.
 Actual Numbers Input sheet
5. Target Number Input Sheet
This is where target numbers for each KPI and month are entered, covering both MTD and YTD targets. This sheet helps maintain objective benchmarks for performance measurement.
 Target Number Input sheet
Click to Buy Robotics Training Institutes KPI Dashboard in Excel
6. Previous Year Number Sheet
Users input the previous year’s data here in a similar format to the actual numbers input sheet. This facilitates year-over-year performance comparisons essential for long-term insights.
 Previous Year Number Input sheet
7. KPI Definition Sheet
This sheet contains detailed definitions of all KPIs used within the dashboard. Users enter the KPI Name, KPI Group, Unit, Formula, Definition, and KPI Type (LTB – Lower the Better or UTB – Upper the Better). This serves as a valuable reference ensuring consistency in KPI interpretation.
 KPI Definition sheet
Click to Buy Robotics Training Institutes KPI Dashboard in Excel
Advantages of Robotics Training Institutes KPI Dashboard
- Time-Saving: Ready-to-use with minimal configuration required.
- Comprehensive Visualization: Displays complex KPI data concisely and clearly.
- Customization: Flexible month and KPI selections allow tailored insights.
- Data Accuracy: Separate input sheets reduce errors and improve data integrity.
- Performance Tracking: Conditional formatting enables quick identification of trends and deviations.
- Enhanced Decision Making: Enables proactive measures based on real-time and historical data trends.
Opportunities for Improvement
Click to Buy Robotics Training Institutes KPI Dashboard in Excel
- Integrate automated data import options from LMS or training ERP systems to reduce manual input.
- Add interactive filters for KPI groups for drill-down analysis directly within the Dashboard sheet.
- Incorporate predictive analytics to forecast future KPI trends based on historical data.
- Enable mobile-friendly views or integration with cloud BI tools for remote access.
- Include notification alerts when KPIs fall below or exceed thresholds.
Best Practices
- Regularly update actual, target, and previous year numbers for accurate and timely insights.
- Review KPI definitions carefully to ensure clarity and uniform understanding across teams.
- Use the Home sheet navigation buttons to efficiently switch between dashboard views.
- Leverage trend charts for identifying patterns and making strategic decisions.
- Back up the dashboard regularly to avoid data loss.
FAQs
Click to Buy Robotics Training Institutes KPI Dashboard in Excel
Can I customize the KPIs displayed in this dashboard?
Yes, you can add or modify KPIs in the KPI Definition sheet, and these will reflect throughout the dashboard accordingly.
Is prior Excel knowledge required to use this dashboard?
Basic Excel skills are helpful, but the dashboard is designed with user-friendly layouts and navigation to minimize learning curves.
Can the dashboard be linked to live data sources?
Currently, data input is manual, but with Excel’s capabilities, you can link to external data sources if required.
How often should I update the data?
It is best to update monthly MTD and YTD data after close of each month for accurate performance tracking.
Conclusion
Click to Buy Robotics Training Institutes KPI Dashboard in Excel
The Robotics Training Institutes KPI Dashboard is an essential tool for training managers to visually track performance, improve accountability, and support data-driven decisions. With its intuitive design, comprehensive coverage, and flexible input capabilities, it empowers institutions to elevate their training quality efficiently. Implementing such a dashboard can lead to measurable improvements in training outcomes and operational success.
For more detailed insights and to see the dashboard in action, visit Microsoft’s Excel resource page to learn about advanced dashboard techniques.
Visit our YouTube channel to watch the demo.
Click to Buy Robotics Training Institutes KPI Dashboard in Excel