In today’s fast-paced work environment, organizations must ensure that safety and compliance are not just policies on paper—but daily practices backed by data. That’s why having a Safety and Compliance Dashboard in Excel can be a game-changer.
This ready-to-use dashboard helps you track safety incidents, monitor compliance performance, and improve workplace operations—all from one place.
In this article, we’ll explore everything you need to know about this Excel-based tool, its features, advantages, areas for improvement, and best practices.
What Is a Safety and Compliance Dashboard in Excel?
A Safety and Compliance Dashboard in Excel is a prebuilt reporting and visualization tool that allows organizations to monitor incidents, assess compliance trends, and analyze personnel performance.
Designed in Microsoft Excel, this dashboard makes it easy to:
-
Track safety metrics in real time
-
Identify compliance gaps
-
Evaluate incident resolution
-
Monitor progress by department or personnel
This dashboard is perfect for safety officers, compliance managers, HR teams, and anyone responsible for workplace health and risk control.
Key Features of the Safety and Compliance Dashboard
Click to buy Safety and Compliance Dashboard in Excel
This dashboard includes multiple worksheet tabs, each offering a different layer of insights. Let’s break down what each sheet does.
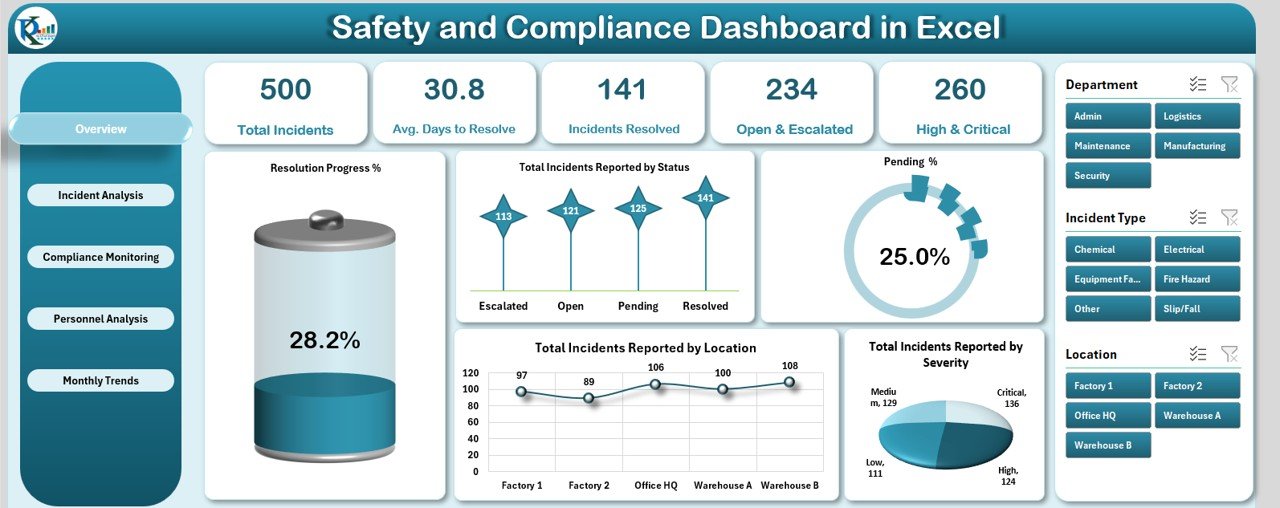
Overview Sheet
The Overview Sheet provides a high-level summary of all incident and compliance activity.
Cards Display:
-
Total Incidents Reported
-
Average Days to Resolve
-
Incidents Resolved
-
Open & Escalated Cases
-
High & Critical Cases
Charts Include:
-
Resolution Progress %
-
Incidents by Status
-
Pending %
-
Incidents by Location
-
Incidents by Severity
This section helps you quickly assess whether your organization is handling safety issues effectively.
Click to buy Safety and Compliance Dashboard in Excel
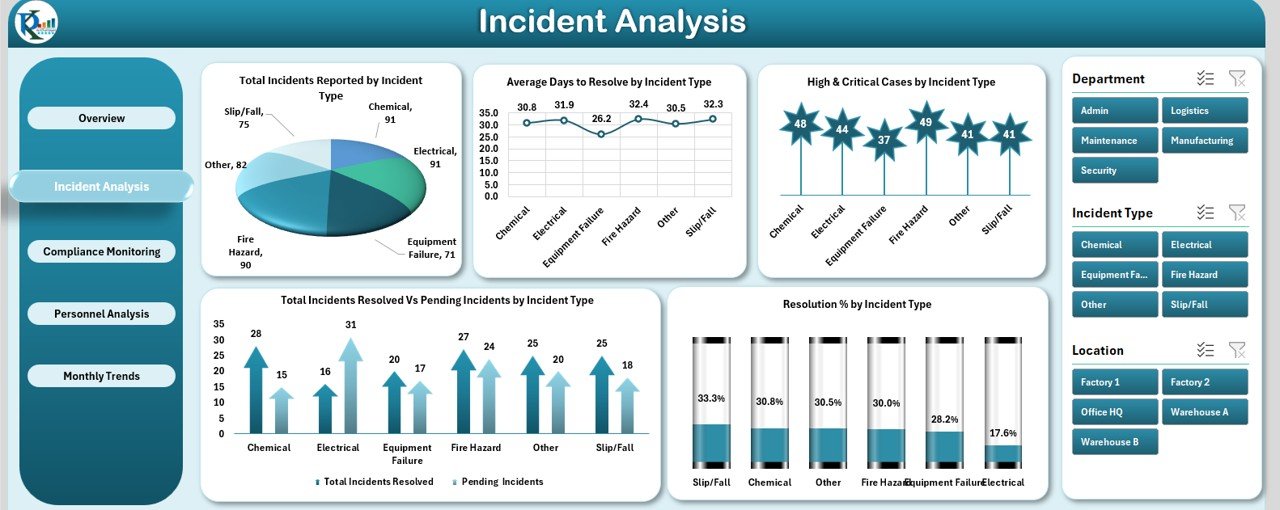
Incident Analysis Sheet
This sheet provides a detailed breakdown by incident type.
Charts:
-
Total Incidents by Type
-
Average Days to Resolve per Type
-
High & Critical Cases by Type
-
Resolved vs Pending by Type
-
Resolution % by Type
It helps identify which types of incidents are most frequent and which ones take the longest to resolve.
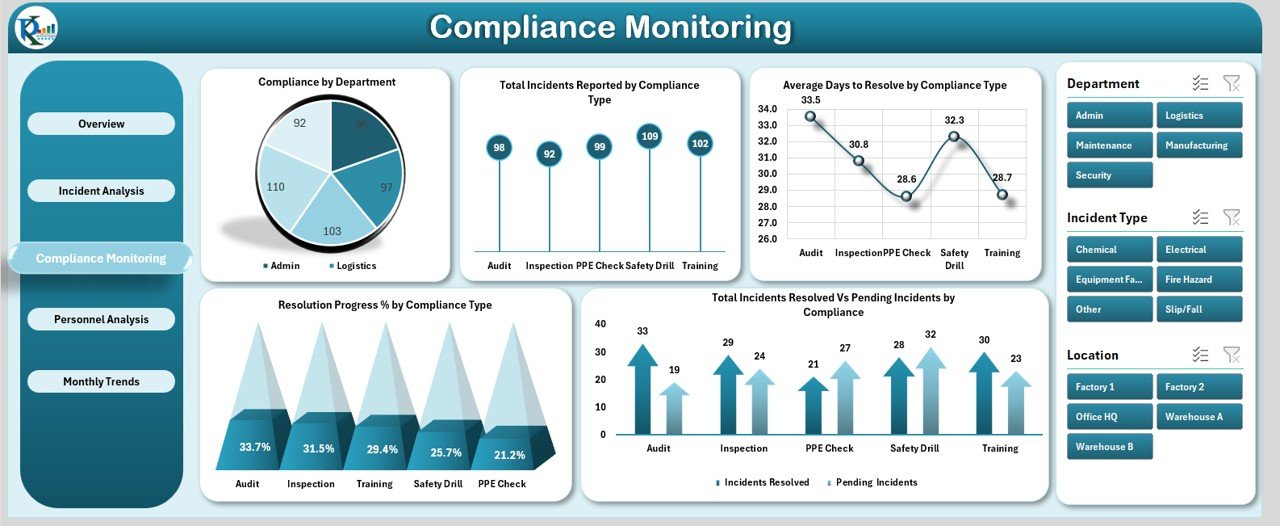
Compliance Monitoring Sheet
Track how well your departments are following safety protocols.
Charts:
-
Compliance by Department
-
Total Incidents by Compliance Type
-
Average Days to Resolve by Compliance Type
-
Resolution Progress % by Compliance Type
-
Resolved vs Pending Incidents by Compliance Category
With this page, you can spot compliance challenges before they turn into costly liabilities.
Click to buy Safety and Compliance Dashboard in Excel
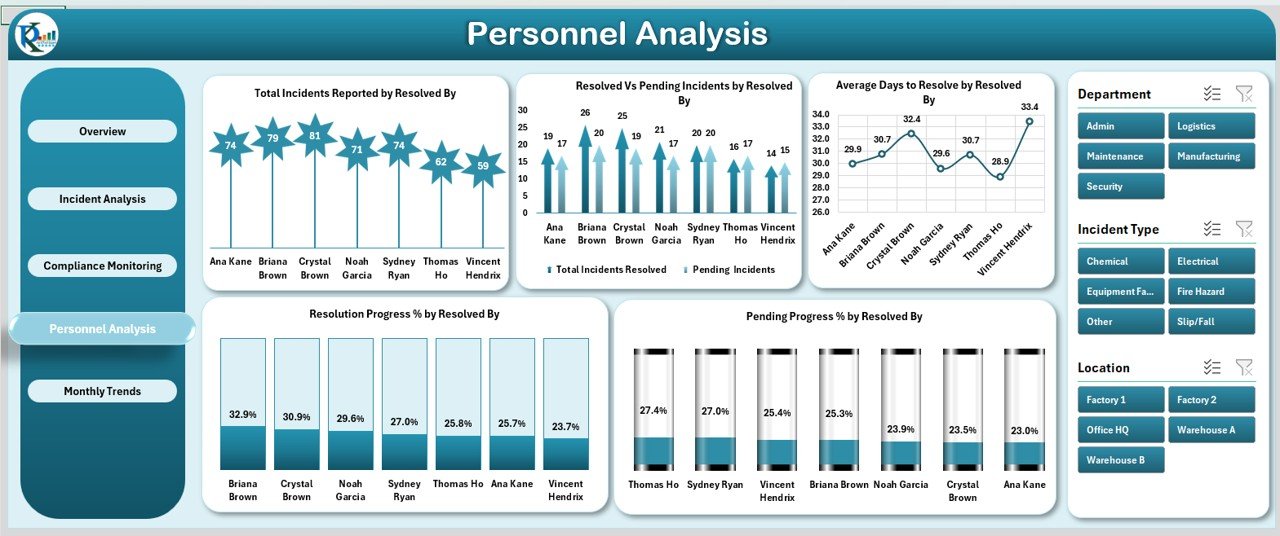
Personnel Analysis Sheet
This sheet focuses on the performance of individuals or teams responsible for resolving issues.
Charts:
-
Total Incidents by Resolved By
-
Resolved vs Pending by Person
-
Average Days to Resolve by Person
-
Resolution Progress % by Person
-
Pending Progress % by Person
Evaluate staff efficiency and pinpoint who needs training or additional support.
Click to buy Safety and Compliance Dashboard in Excel
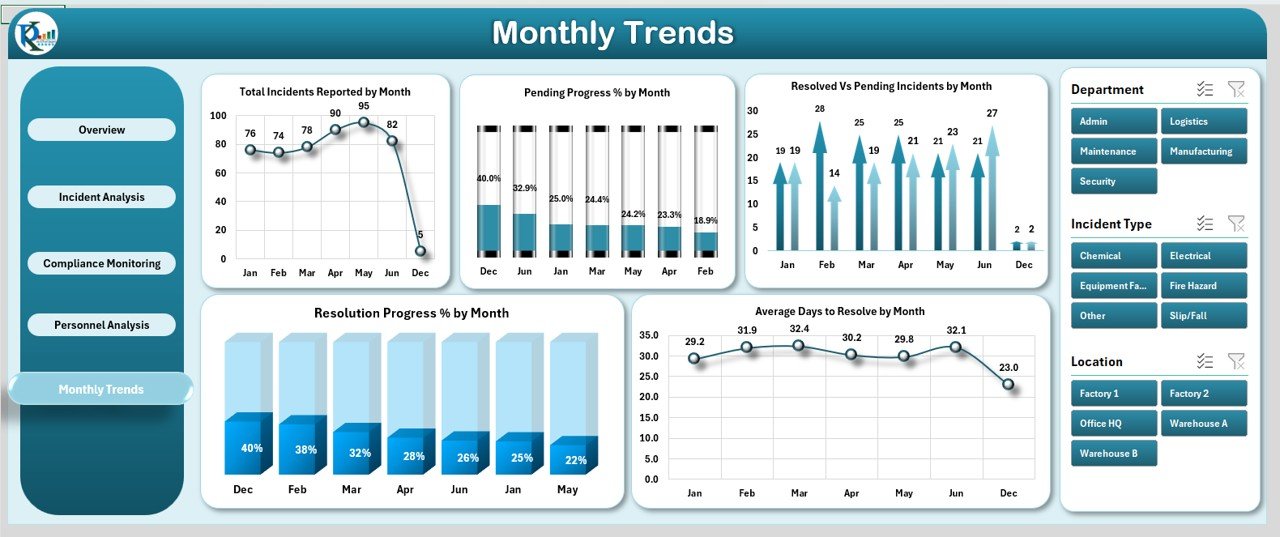
Monthly Trends Sheet
This is your time-based tracker. Analyze performance over the year.
Charts:
-
Incidents by Month
-
Pending Progress % by Month
-
Resolved vs Pending by Month
-
Resolution Progress % by Month
-
Average Days to Resolve by Month
Spot patterns, track improvement, and allocate resources for peak periods.
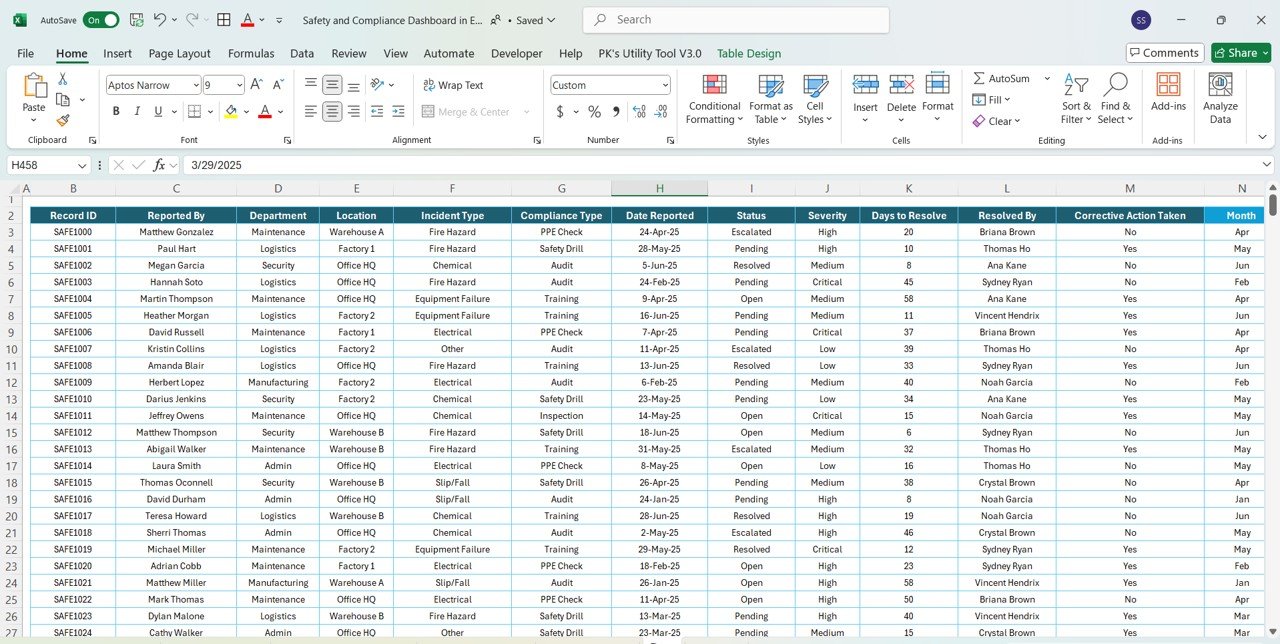
Data Sheet Tab
This is your input sheet, where you manually enter incident data. Fields include:
Everything is automatically updated in the dashboard visuals based on this data.
Click to buy Safety and Compliance Dashboard in Excel
Advantages of a Safety and Compliance Dashboard in Excel
Let’s explore the top benefits this dashboard brings to your organization:
- Real-Time Monitoring: Instantly see how many incidents are open, resolved, or escalated—without waiting for monthly reports.
- High Visibility; Color-coded charts and cards make it easy to visualize performance, spot risks, and prioritize actions.
- Personnel Accountability; Track who is resolving incidents quickly and who needs coaching or training.
- Historical Trends: Analyze monthly data to understand seasonal risks or recurring compliance issues.
- Zero Learning Curve: Built in Excel, this dashboard is easy to use—even for non-technical staff.
- Easy Sharing: Export reports, share the file via email, or upload to SharePoint for team access.
Opportunities for Improvement in the Dashboard
While this Excel dashboard is powerful, you can still enhance it in several ways:
-
Add Conditional Alerts: Highlight overdue cases automatically in red.
-
Include Severity Weighting: Calculate risk scores based on severity.
-
Enable Filtering: Add slicers for department, location, or incident type.
-
Automate Data Entry: Use Power Query or Excel Forms to pull data from other sheets or sources.
-
Integrate with Email Notifications: Use VBA to trigger emails when an incident is escalated.
Each improvement increases automation, efficiency, and response speed.
Best Practices for Using the Safety and Compliance Dashboard
Click to buy Safety and Compliance Dashboard in Excel
To maximize the value of your dashboard, follow these proven tips:
- Keep Data Consistent: Ensure all data entries (like “High” or “Resolved”) use consistent spellings and formats. This keeps your charts accurate.
- Update Weekly or Daily: The dashboard only works if it’s current. Assign a team member to keep the data sheet updated regularly.
- Review Monthly Trends: Hold monthly reviews with your safety team using the trends page to drive action.
- Customize for Your Workplace: Add your company’s specific incident types, departments, or severity levels.
- Share Insights, Not Just Files: When sharing the dashboard, add context. Highlight areas of concern and action items.
Conclusion
The Safety and Compliance Dashboard in Excel is more than just a reporting tool—it’s your command center for workplace risk management. With this dashboard, you can track incidents, monitor compliance, evaluate performance, and drive continuous improvement.
From top-level executives to on-the-ground safety officers, everyone benefits from clear, actionable insights delivered in an easy-to-use format.
Ready to take your safety monitoring to the next level? Start using the Safety and Compliance Dashboard in Excel today—and build a safer, more compliant organization tomorrow.
Frequently Asked Questions (FAQs)
Click to buy Safety and Compliance Dashboard in Excel
1. Can I use this dashboard for any industry?
Yes. Whether you’re in construction, healthcare, education, or manufacturing, the dashboard can be customized to suit your industry-specific needs.
2. Does this dashboard require Excel macros or VBA?
No. The base version uses only standard Excel formulas and pivot tables, making it easy to use and share.
3. Can I add more KPIs or charts?
Absolutely. You can expand the dashboard to include custom KPIs such as downtime, cost per incident, or audit results.
4. Is the data entry manual or automated?
By default, data is manually entered in the Data Sheet tab. However, you can automate it using Power Query or external data sources.
5. How often should I update the dashboard?
Weekly or bi-weekly updates are ideal. However, high-risk workplaces may benefit from daily updates.
6. Is this dashboard shareable with others?
Yes. You can share the file directly, use it in Teams or SharePoint, or even export key visuals to PowerPoint.
7. Can I use this dashboard for audits?
Yes. The historical data and trend analysis make it an excellent tool for preparing for internal or external audits.
Visit our YouTube channel to learn step-by-step video tutorials
Click to buy Safety and Compliance Dashboard in Excel