In today’s competitive business environment, tracking performance metrics has become essential for every organization that wants to grow. Sales departments, in particular, must measure and monitor key indicators to ensure their strategies are effective and aligned with business goals.
That’s where a Sales KPI Scorecard in Excel comes in.
This easy-to-use, data-driven scorecard provides a structured way to measure performance, identify opportunities, and take action — all in one centralized dashboard. Whether you’re managing a small business or a large enterprise, a well-designed sales KPI scorecard can transform the way you analyze performance, motivate your team, and make decisions backed by data.
In this article, you’ll learn everything you need to know about creating and using a Sales KPI Scorecard in Excel, including its structure, features, advantages, best practices, and answers to common questions.
Click to buy Sales KPI Scorecard in Excel
What Is a Sales KPI Scorecard in Excel?
A Sales KPI Scorecard is a powerful Excel-based tool designed to track, visualize, and analyze key performance indicators (KPIs) that define your sales success. It helps sales leaders monitor performance across different time periods (MTD, YTD, or quarterly), compare actual results with targets, and identify improvement areas.
Using Excel’s built-in capabilities like formulas, charts, and conditional formatting, this scorecard becomes an interactive dashboard that converts raw data into meaningful insights.
With this tool, you can easily answer critical questions such as:
- How are sales performing compared to the target?
- Which products or regions are over- or under-performing?
- What trends are emerging month over month?
- Which KPIs need immediate attention?
Structure of the Sales KPI Scorecard in Excel
The Sales KPI Scorecard template consists of four main worksheet tabs, each designed to serve a unique purpose in performance tracking and reporting.
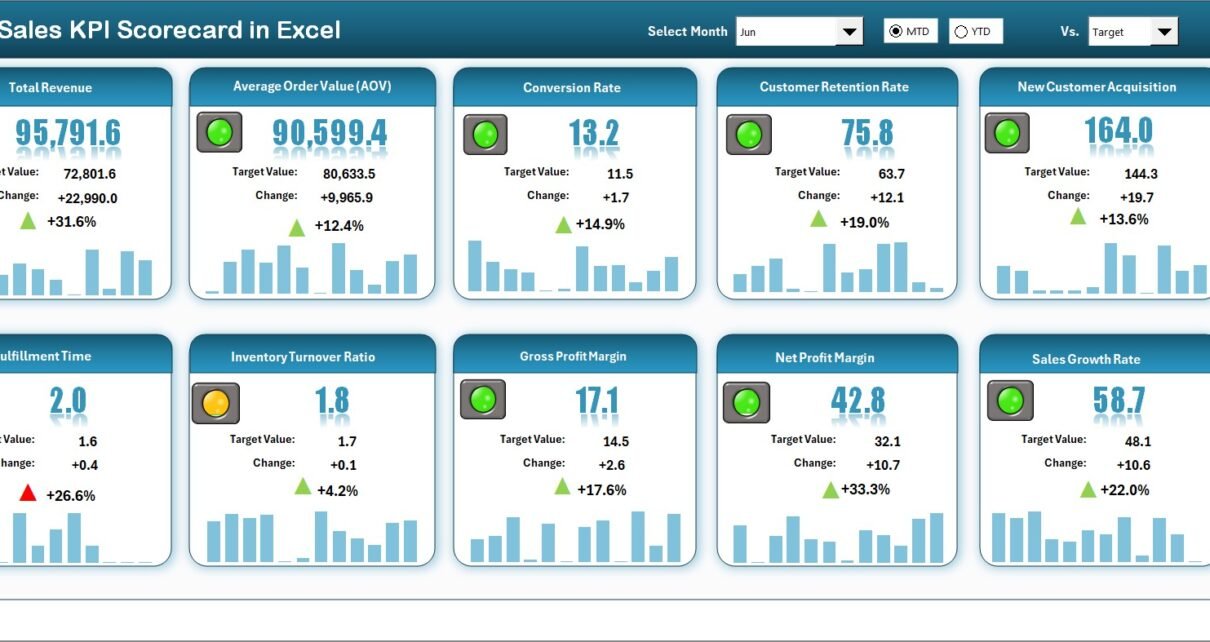
Scorecard Sheet — The Main Dashboard
This is the central hub of your Excel scorecard. It provides a bird’s-eye view of all key sales metrics and allows users to analyze monthly and yearly trends at a glance.
Key Features:
- Dropdown Menus: Choose between different time periods such as Month-to-Date (MTD) or Year-to-Date (YTD) to see performance in the desired context.
- Actual vs. Target Comparison: Evaluate how your actual sales figures compare to your targets.
- Visual Indicators: Color-coded visuals (e.g., green for achieved, red for below target) make it easy to interpret results instantly.
- Comprehensive KPI Overview: Displays all major sales KPIs in one place — including MTD, YTD, and trend comparisons.
- 10 KPIs in One View: A compact yet complete visual representation for management reviews and sales meetings.

Click to buy Sales KPI Scorecard in Excel
KPI Trend Sheet — Understanding Performance Over Time
This sheet provides deeper insight into how each KPI behaves over time. It helps you visualize trends, spot deviations, and measure progress toward long-term objectives.
Main Highlights:
- Dynamic Selection: Select any KPI from the dropdown (cell C3) to instantly display related data and trends.
- KPI Metadata: View essential information like KPI Group, Unit of Measurement, Formula, and Type (UTB – Upper the Better, or LTB – Lower the Better).
- Trend Charts: Graphs for Actual, Target, and Previous Year (PY) numbers illustrate month-by-month progress and variations.
- Easy Comparison: Quickly identify if performance is improving or declining against the previous period or year.
This sheet is particularly useful for reviewing quarterly performance and preparing management presentations.

Click to buy Sales KPI Scorecard in Excel
Input Data Sheet — The Backbone of Your Scorecard
The Input Data sheet is where you record all KPI-related data. It acts as the foundation of your entire scorecard and drives the calculations, comparisons, and visuals across all other sheets.
Features:
- Data Entry Flexibility: Input monthly Actual, Target, and PY (Previous Year) values for each KPI.
- Editable Structure: Update values as soon as new data becomes available — ensuring the dashboard stays current.
- Automation Ready: The formulas in the scorecard and trend sheets automatically update when you modify the data here.
This makes Excel an efficient and user-friendly platform for KPI management without needing advanced software.

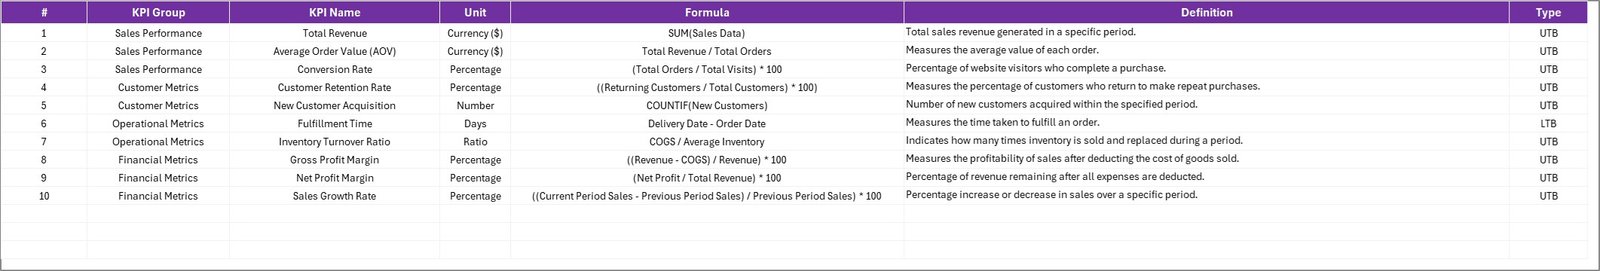
KPI Definition Sheet — Building Consistency and Clarity
The KPI Definition sheet ensures clarity and standardization across your organization’s reporting process.
Key Components:
- KPI Name: Clearly defined titles for each key performance indicator.
- KPI Group: Logical grouping (e.g., Revenue, Customer, Conversion).
- Unit of Measure: Defines how the KPI is measured (e.g., %, USD, Count).
- Formula: The calculation logic behind each KPI.
- Definition: A short description explaining the KPI’s purpose and business meaning.
This section ensures everyone understands what each KPI represents and how it’s measured — essential for accuracy and alignment.
Click to buy Sales KPI Scorecard in Excel
How to Use the Sales KPI Scorecard Effectively
Implementing a Sales KPI Scorecard is not just about filling in data; it’s about creating a system that drives accountability and performance improvement.
Follow these steps to use your scorecard efficiently:
- Define Clear KPIs: Choose metrics aligned with business goals (e.g., Sales Growth %, Revenue per Rep, Customer Retention Rate).
- Set Measurable Targets: Establish realistic monthly and yearly goals.
- Update Data Regularly: Keep your Input Data sheet current to maintain dashboard accuracy.
- Review KPI Trends Weekly: Identify deviations early and take corrective action.
- Use Visuals for Insights: Leverage charts and conditional formatting to make complex data easy to interpret.
- Share Reports: Present findings to your team for collaborative performance discussions.
Popular KPIs to Include in a Sales KPI Scorecard
These metrics provide a 360-degree view of sales performance and efficiency.
Advantages of Using a Sales KPI Scorecard in Excel
A well-structured Sales KPI Scorecard offers several benefits that make it an indispensable tool for managers and analysts alike.
- Real-Time Performance Tracking
You can monitor progress throughout the month and take immediate action when performance lags behind targets.
- Enhanced Decision-Making
By comparing actual versus target and previous year data, managers gain insights into what’s working and what needs improvement.
- Easy Customization
Unlike rigid reporting tools, Excel allows you to add, remove, or modify KPIs quickly based on evolving business needs.
- Data Visualization
Charts, graphs, and color indicators make complex data understandable at a glance, saving time during reviews.
- Team Accountability
When performance data is transparent, team members stay motivated and responsible for their goals.
- Cost-Effective Solution
There’s no need for expensive software. Excel provides a highly functional solution using tools you already have.
Best Practices for Building a Sales KPI Scorecard in Excel
To make your scorecard truly effective, follow these best practices:
- Keep KPIs Aligned with Business Strategy: Choose metrics that directly contribute to strategic goals.
- Limit to Key Metrics: Focus on 10-15 KPIs that truly matter; too many can cause confusion.
- Ensure Data Accuracy: Verify that source data is correct before importing it into Excel.
- Use Conditional Formatting: Highlight high and low performers visually for faster insights.
- Automate Calculations: Use formulas like SUMIF, AVERAGEIFS, and IFERROR to minimize manual work.
- Incorporate Charts and Trends: Add monthly line charts for quick visual performance checks.
- Review Periodically: Update KPIs quarterly to reflect market or business changes.
- Protect Key Cells: Lock formula cells to prevent accidental changes by users.
- Use Color Coding: Define a color legend (e.g., green = met, red = missed) for quick evaluation.
- Add a Summary Card Section: Include high-level metrics like total revenue or overall target achievement percentage for quick reference.
Opportunities for Improvement in Sales KPI Management
Even with a robust scorecard, there’s always room for improvement. Consider enhancing your reporting process through:
- Automation Tools: Use Power Query or VBA macros to automate data imports.
- Integration with CRM Systems: Connect Excel with Salesforce or HubSpot for real-time updates.
- Dashboard Expansion: Add additional pages for region, product, or salesperson analysis.
- Benchmarking: Compare your KPIs against industry averages to identify strengths and weaknesses.
- Training and Adoption: Ensure sales reps understand how their performance impacts overall KPIs.
Conclusion
A Sales KPI Scorecard in Excel is more than just a spreadsheet — it’s a performance management system that empowers your sales team to achieve more. It bridges the gap between strategy and execution by offering clarity, focus, and actionable insights.
By implementing a dynamic scorecard, you not only track performance but also inspire accountability, improve efficiency, and drive sustained growth.
Whether you’re analyzing monthly sales trends or setting next quarter’s targets, Excel provides all the tools needed to make your scorecard simple, powerful, and adaptable to your unique business requirements.
Frequently Asked Questions (FAQs)
- What are Sales KPIs?
Sales KPIs (Key Performance Indicators) are measurable metrics that reflect how effectively a sales team achieves its objectives. Examples include revenue growth, conversion rate, and average deal size.
- Why use Excel for a Sales KPI Scorecard?
Excel is flexible, affordable, and widely accessible. It allows users to create customized dashboards, automate calculations, and visualize performance without needing complex software.
- How often should I update my scorecard?
It’s best to update your scorecard monthly. However, high-performing teams may review data weekly to ensure timely action on performance gaps.
- Can I add new KPIs to the scorecard?
Yes. Excel makes it easy to insert new KPIs into the Input Data and Definition sheets, provided formulas and references are updated accordingly.
- What is the difference between a KPI Scorecard and a KPI Dashboard?
A Scorecard focuses on performance against targets (showing achieved vs expected), while a Dashboard focuses on visual analytics and trends. Many modern Excel templates combine both.
- How can I automate the scorecard?
You can use Excel formulas, Power Query, or VBA to automate data refreshes and reduce manual entry.
- Is this template suitable for small businesses?
Absolutely. The Sales KPI Scorecard in Excel is designed to suit organizations of any size and can easily scale as your business grows.
Watch the step-by-step video tutorial:
Visit our YouTube channel to learn step-by-step video tutorials
Click to buy Sales KPI Scorecard in Excel