Managing solar projects efficiently requires real-time visibility into project status, costs, and progress. Our Solar Project Construction Dashboard in Excel is a ready-to-use solution designed for project managers, contractors, and stakeholders to monitor every aspect of solar construction projects.
This dashboard uses Excel’s interactive features to provide insightful analysis with multiple sheet tabs, cards, and charts. It is fully customizable and designed for practical, data-driven decision-making.
Key Features of the Solar Project Construction Dashboard
The dashboard includes multiple sheet tabs for a comprehensive overview of projects, costs, stages, and contractor performance:
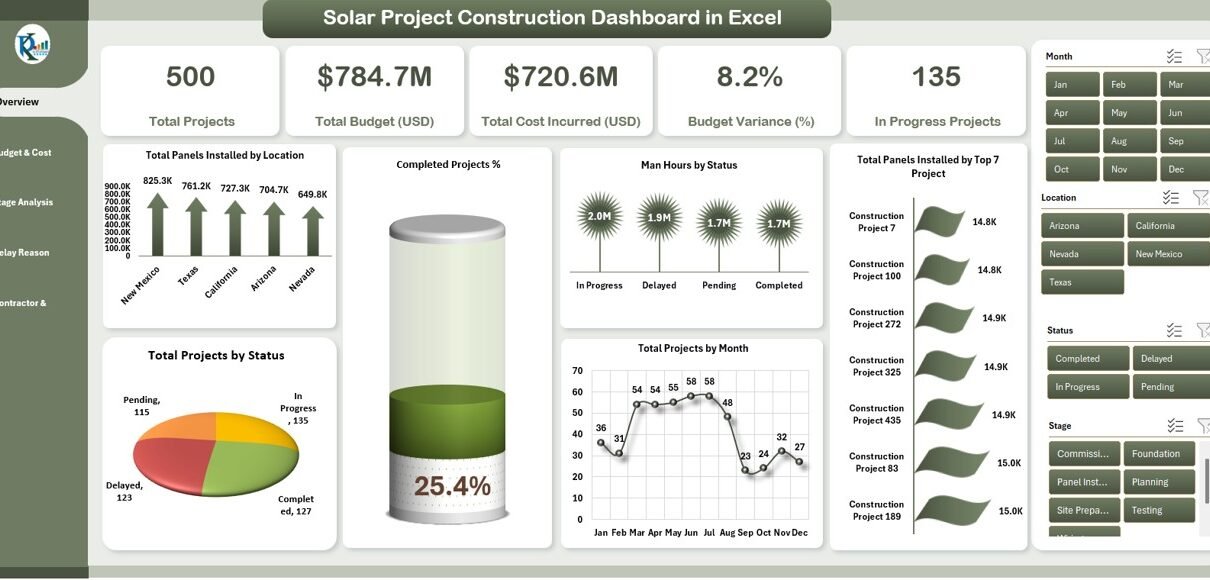
1. Overview Sheet Tab
The Overview sheet provides a high-level snapshot of all solar projects with cards and charts.
Cards:
-
Total Projects – Total number of solar projects under management.
-
Total Budget (USD) – Total allocated budget for all projects.
-
Total Cost Incurred (USD) – Sum of actual costs spent to date.
-
Budget Variance (%) – Difference between budget and actual cost expressed as a percentage.
-
In Progress Projects – Count of ongoing projects.
Charts:
-
Total Panels Installed by Location – Visualize the number of panels installed across different sites.
-
Completed Projects % – Percentage of projects completed.
-
Man Hours by Status – Track workforce effort for projects based on their status.
-
Total Panels Installed by Top 7 Projects – Focus on high-impact projects.
-
Total Projects by Month – Monthly project trends.
-
Total Projects by Status – Count of projects categorized as In Progress, Completed, or Delayed.

Click to Buy Solar Project Construction Dashboard in Excel
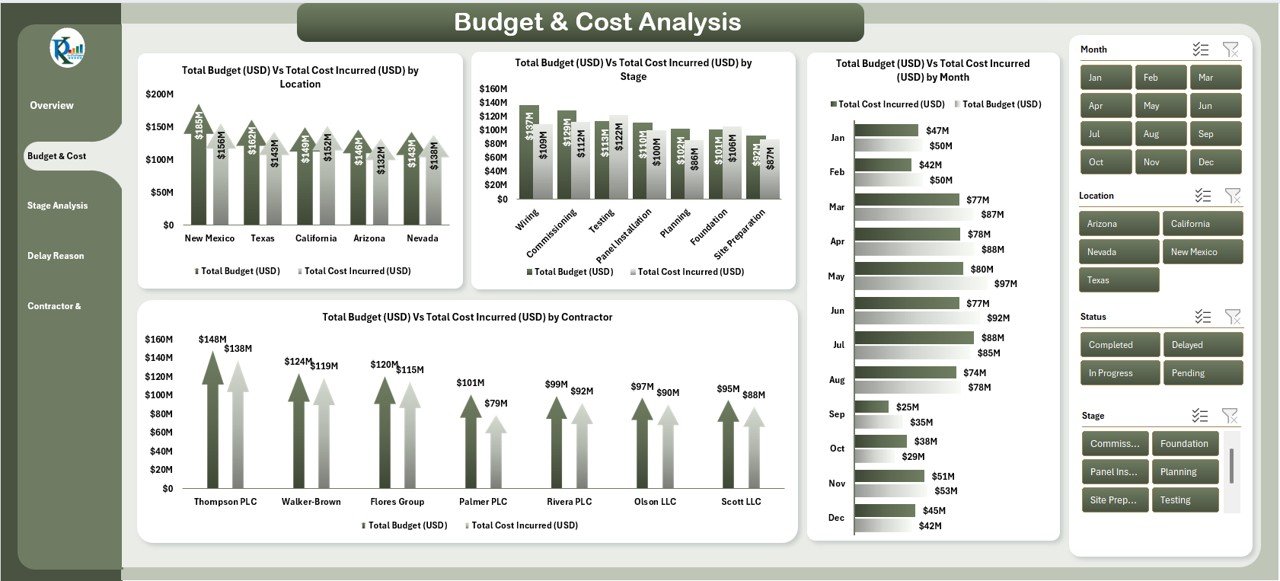
2. Budget & Cost Analysis
This section provides financial insights to monitor project spending against allocated budgets.
Charts:
-
Total Budget vs Total Cost Incurred by Location – Compare planned and actual costs across sites.
-
Total Budget vs Total Cost Incurred by Stage – Track costs at each project stage.
-
Total Budget vs Total Cost Incurred by Month – Monitor monthly budget performance.
-
Total Budget vs Total Cost Incurred by Contractor – Evaluate contractor cost efficiency.
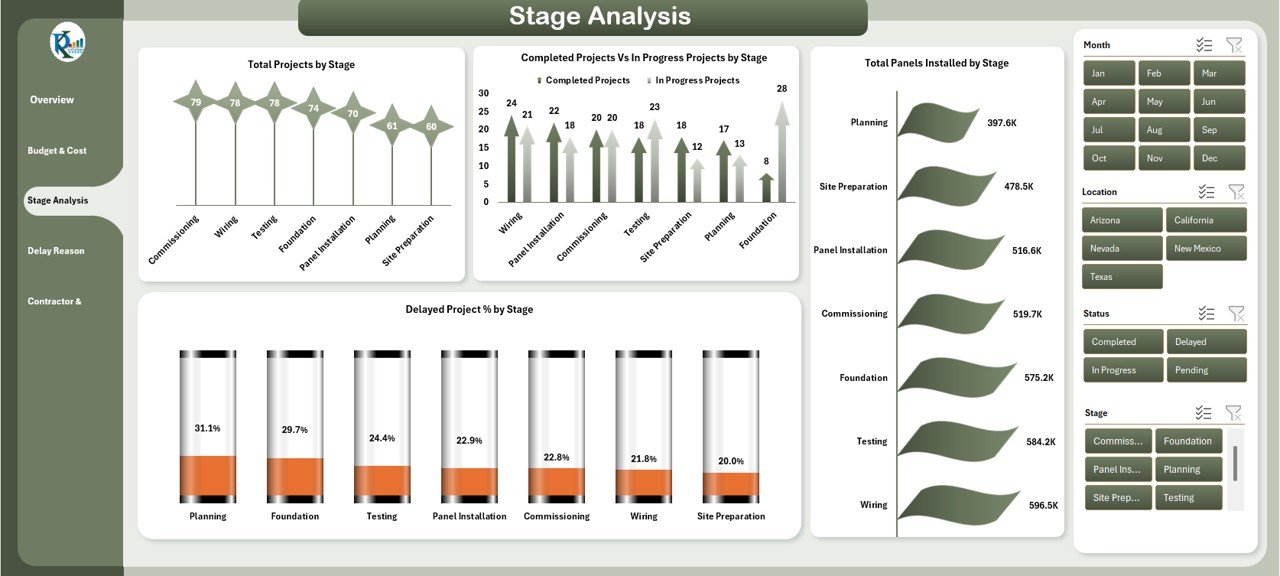
3. Stage Analysis
Stage analysis helps identify project bottlenecks and progress.
Charts:
-
Total Projects by Stage – See how many projects are in Planning, Execution, or Completion.
-
Completed Projects vs In Progress Projects by Stage – Visualize project progress across stages.
-
Delayed Project % by Stage – Identify which stages experience delays.
-
Total Panels Installed by Stage – Track panel installation per project stage.
Click to Buy Solar Project Construction Dashboard in Excel
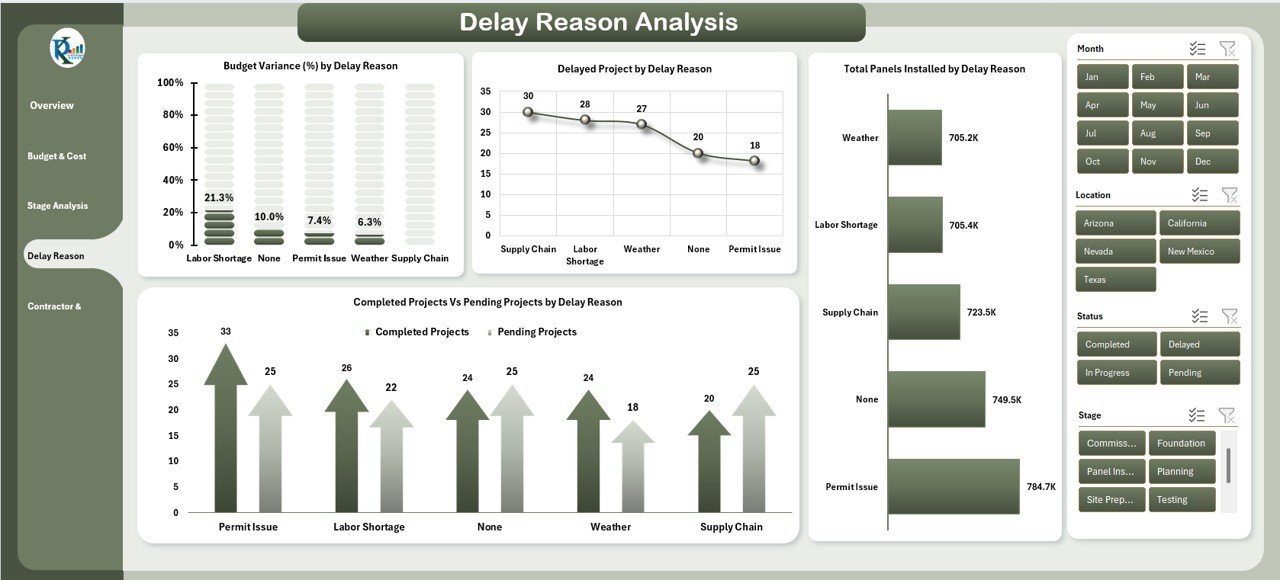
4. Delay Reason AnalysisUnderstand why projects are delayed and take corrective actions.
Charts:
-
Budget Variance (%) by Delay Reason – See which delay reasons impact cost overruns.
-
Delayed Project by Delay Reason – Number of delayed projects categorized by cause.
-
Completed vs Pending Projects by Delay Reason – Compare project progress based on delay causes.
-
Total Panels Installed by Delay Reason – Visualize how delays affect panel installation.
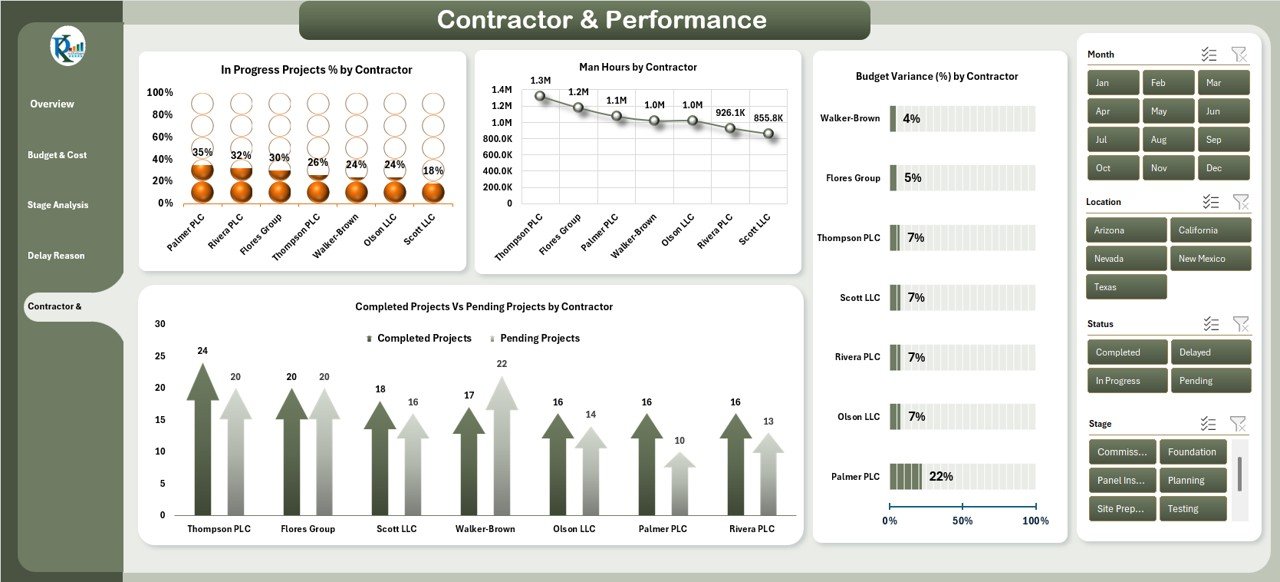
5. Contractor & Performance
Track contractor efficiency and project contributions.
Charts:
-
In Progress Projects % by Contractor – Percent of active projects managed by each contractor.
-
Man Hours by Contractor – Workforce effort per contractor.
-
Budget Variance (%) by Contractor – Financial performance of each contractor.
-
Completed vs Pending Projects by Contractor – Contractor project completion status.
Click to Buy Solar Project Construction Dashboard in Excel
6. Data Sheet Tab
The Data sheet is the backbone of the dashboard where all project-related data is entered. This includes:
-
Project ID
-
Project Name
-
Location
-
Contractor
-
Budget (USD)
-
Cost Incurred (USD)
-
Stage
-
Status
-
Panels Installed
-
Delay Reason
-
Man Hours
-
Start Date / End Date
All cards, charts, and pivot tables are dynamically linked to this data sheet, ensuring real-time updates and accurate reporting.
Advantages of Using This Dashboard
Click to Buy Solar Project Construction Dashboard in Excel
-
Real-Time Project Tracking – Track project status, stages, and completion percentage.
-
Budget Control – Monitor budget vs actual costs to prevent overruns.
-
Contractor Performance – Evaluate contractors’ efficiency and contribution.
-
Delay Analysis – Identify bottlenecks and implement corrective actions.
-
Customizable Views – Analyze by location, stage, contractor, or delay reason.
Opportunities for Improvement
-
Integrate with ERP systems to automate cost and progress updates.
-
Add Gantt charts for visual timeline management.
-
Include resource allocation metrics to monitor workforce distribution.
-
Track environmental compliance or solar output for advanced reporting.
-
Implement alerts for delayed projects exceeding budget thresholds.
Best Practices
Click to Buy Solar Project Construction Dashboard in Excel
-
Keep the Data sheet updated to ensure accurate insights.
-
Regularly review budget variance charts to prevent overspending.
-
Analyze contractor performance metrics to optimize team efficiency.
-
Focus on high-impact projects with top panels installed and cost variance.
-
Use filtering and slicers to quickly drill down into location or stage analysis.
Conclusion
The Solar Project Construction Dashboard in Excel is a complete solution for monitoring solar projects, controlling costs, and evaluating contractor performance. With cards, charts, and stage/delay analysis, project managers can make informed, data-driven decisions to ensure projects are completed on time, within budget, and efficiently.
Visit our YouTube channel to learn step-by-step video tutorials
Watch the step-by-step video Demo:
Click to Buy Solar Project Construction Dashboard in Excel