Supplier performance and risk management are critical for maintaining smooth operations and avoiding financial or operational disruptions. The Supplier Risk Dashboard in Power BI is a ready-to-use solution that helps procurement, supply chain, and risk management teams track supplier performance, compliance, and potential risks in real time.
In this article, we will explain the key features, benefits, and best practices of using this dashboard.
What Is a Supplier Risk Dashboard?
A Supplier Risk Dashboard is a visual reporting tool that consolidates supplier-related metrics into one interactive interface. It tracks delivery performance, compliance, financial exposure, and risk levels, enabling businesses to make data-driven decisions.
With Power BI, this dashboard provides:
-
Real-time insights into supplier performance
-
Visualization of delivery and compliance data
-
Risk scoring and financial exposure analysis
-
Trend analysis to identify patterns over time
Key Features of the Supplier Risk Dashboard
Click to Buy Supplier Risk Dashboard in Power BI
The dashboard contains multiple pages with cards, charts, and visual analytics:
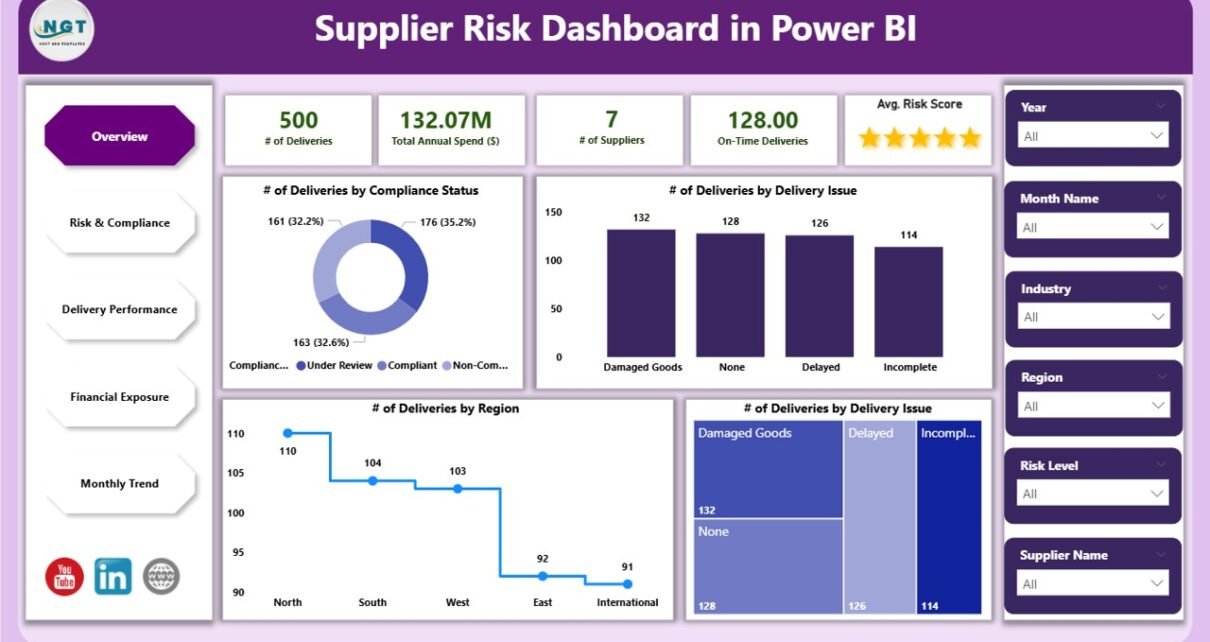
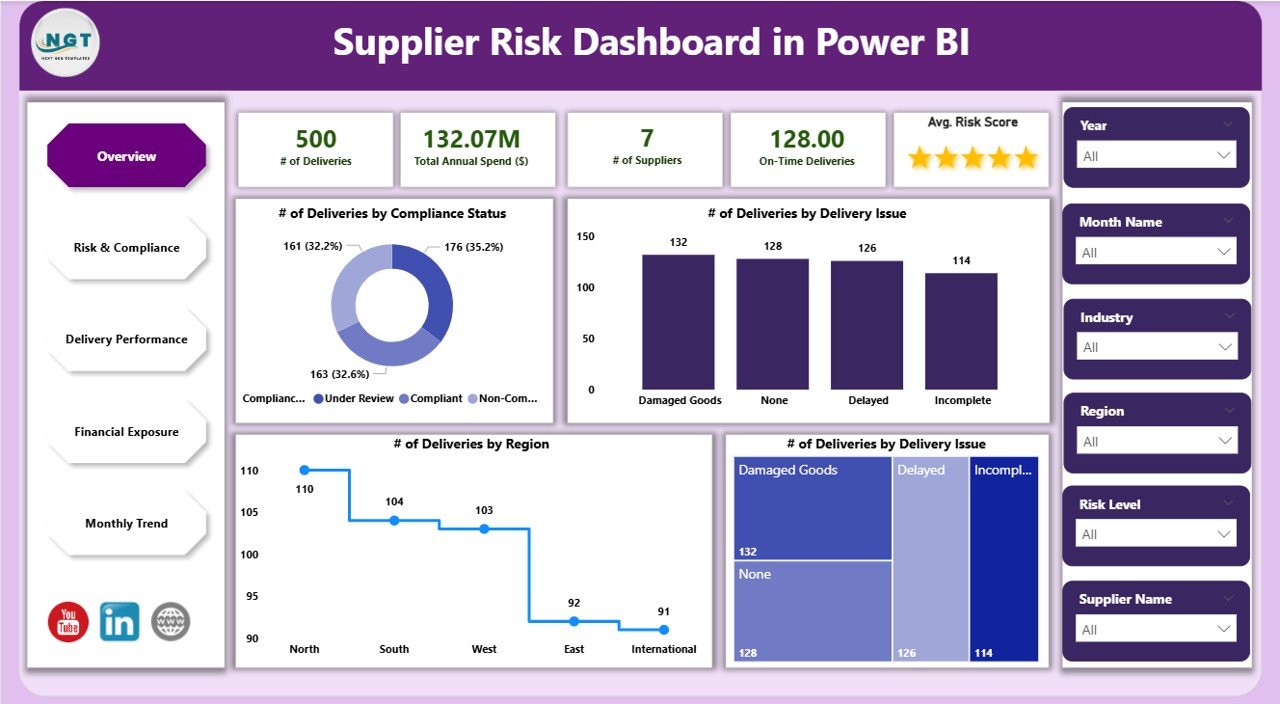
1. Overview Page
The Overview Page provides a snapshot of supplier performance and risk metrics.
Cards:
-
# of Deliveries – Total deliveries tracked
-
Total Annual Spend ($) – Aggregate spend across all suppliers
-
# of Suppliers – Total suppliers in the system
-
On-Time Deliveries – Total number of deliveries completed on time
-
Average Risk Score – Overall supplier risk rating
Charts:
-
# of Deliveries by Compliance Status – Categorizes deliveries as compliant or non-compliant
-
# of Deliveries by Delivery Issue – Highlights problem areas like delays or damaged goods
-
# of Deliveries by Region – Visualizes geographic distribution of deliveries
Click to Buy Supplier Risk Dashboard in Power BI
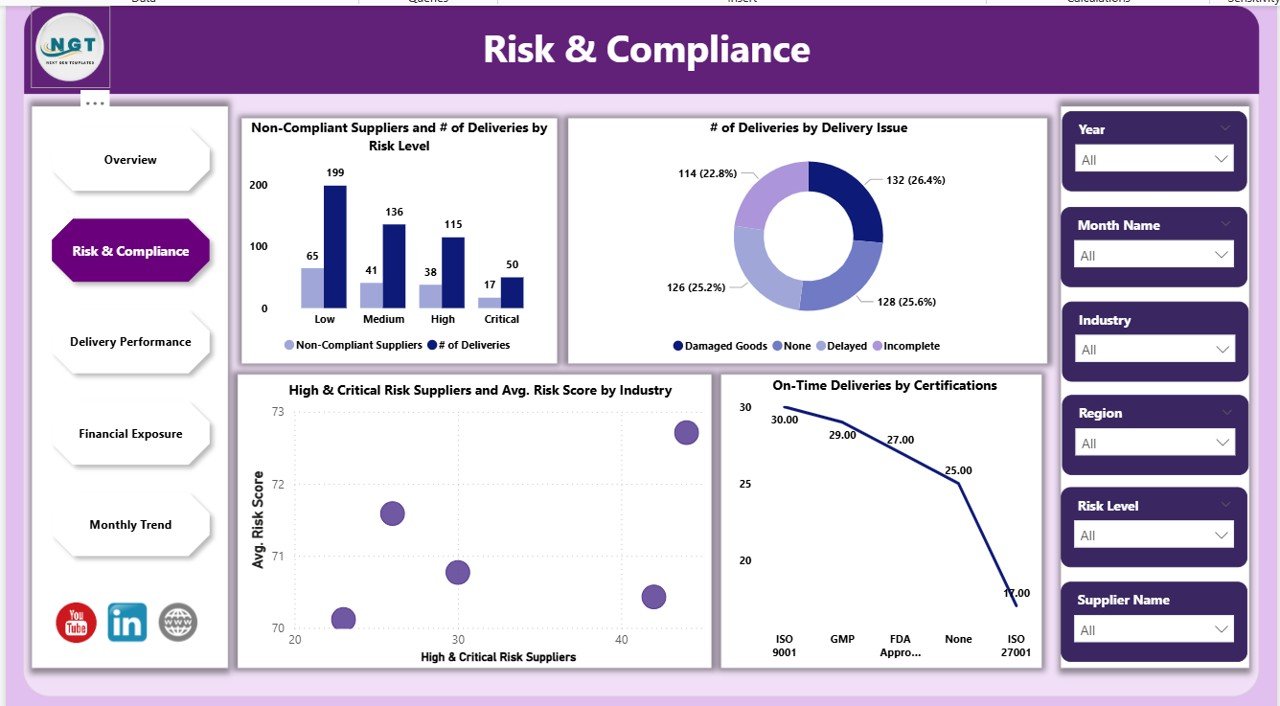
2. Risk & Compliance Page
This page focuses on supplier risk levels and compliance.
Charts:
-
Non-Compliant Suppliers and # of Deliveries by Risk Level – Identifies suppliers not meeting compliance standards
-
# of Deliveries by Delivery Issue – Tracks recurring problems
-
On-Time Deliveries by Certifications – Measures how certified suppliers perform
-
High & Critical Risk Suppliers and Avg. Risk Score by Industry – Highlights critical suppliers across industries
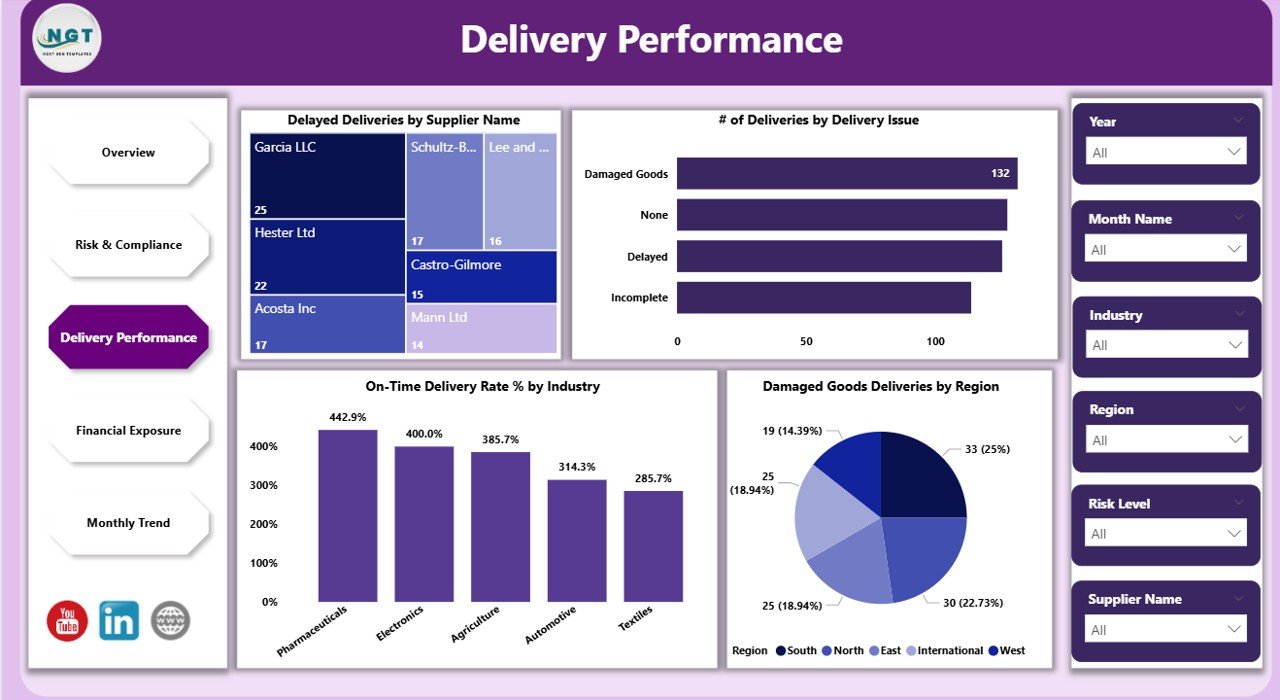
3. Delivery Performance Page
The Delivery Performance Page measures supplier efficiency and operational reliability.
Charts:
-
Delayed Deliveries by Supplier Name – Identifies suppliers with late deliveries
-
# of Deliveries by Delivery Issue – Tracks recurring delivery problems
-
Damaged Goods Deliveries by Region – Maps regions with higher incidents of damaged deliveries
-
On-Time Delivery Rate (%) by Industry – Measures delivery efficiency per sector
Click to Buy Supplier Risk Dashboard in Power BI
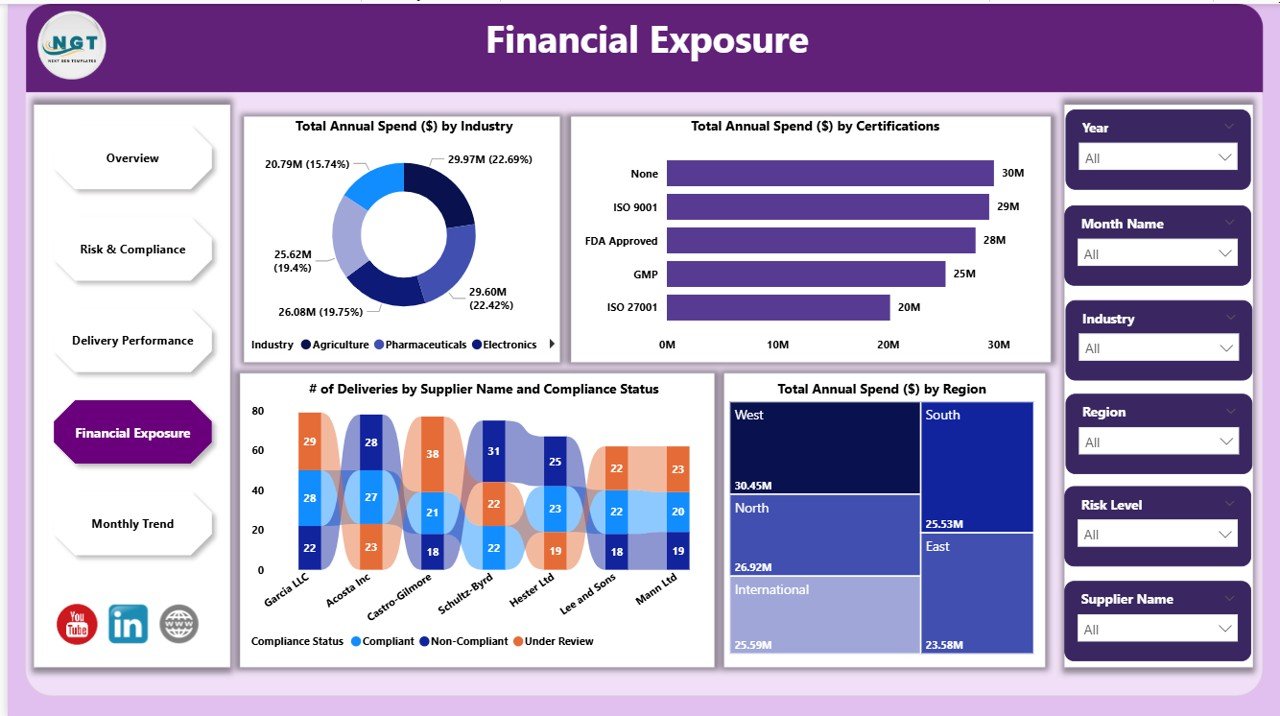
4. Financial Exposure Page
This page tracks spending and potential financial risks associated with suppliers.
Charts:
-
Total Annual Spend ($) by Industry – Visualizes spend per industry
-
Total Annual Spend ($) by Certifications – Analyzes spending on certified suppliers
-
Total Annual Spend ($) by Region – Maps regional expenditure
-
# of Deliveries by Supplier Name and Compliance Status – Combines delivery and compliance data for financial insights
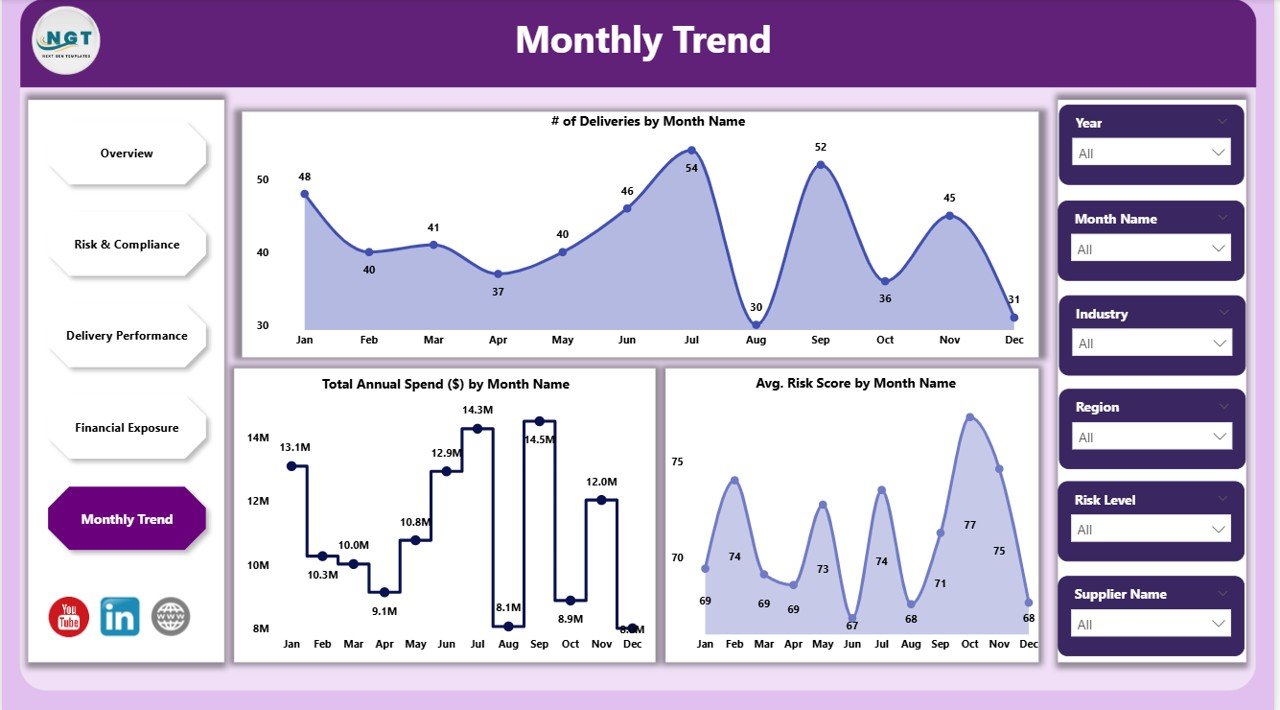
5. Monthly Trend Page
The Monthly Trend Page provides time-based insights to track supplier performance over months.
Charts:
-
# of Deliveries by Month Name – Tracks delivery volume trends over time
-
Average Risk Score by Month Name – Shows risk fluctuations month-to-month
-
Total Annual Spend ($) by Month Name – Analyzes monthly expenditure patterns
Click to Buy Supplier Risk Dashboard in Power BI
Advantages of Using the Supplier Risk Dashboard
-
Real-Time Monitoring: Track supplier performance and risk metrics as they happen
-
Identify High-Risk Suppliers: Quickly pinpoint suppliers that pose operational or financial risks
-
Compliance Tracking: Ensure suppliers meet regulatory and certification requirements
-
Financial Oversight: Analyze spend across suppliers, industries, and regions
-
Data-Driven Decisions: Use insights to improve supplier selection and management
-
Trend Analysis: Detect patterns in delivery performance and risk over time
Best Practices for Using the Dashboard
-
Update Supplier Data Regularly: Ensure the latest delivery, compliance, and spend data is included
-
Focus on High-Risk Suppliers: Prioritize mitigation strategies for suppliers with high risk scores
-
Segment by Region and Industry: Analyze supplier performance by location or sector
-
Monitor Certifications: Track how certified suppliers perform compared to non-certified ones
-
Review Monthly Trends: Use monthly trend analysis to plan procurement and risk management strategies
-
Integrate With Other Systems: Connect ERP or procurement systems to maintain accurate, real-time data
How This Dashboard Helps Organizations
Click to Buy Supplier Risk Dashboard in Power BI
-
Reduce Operational Risks: By monitoring supplier performance and delivery issues
-
Optimize Procurement Decisions: Focus spending on reliable and compliant suppliers
-
Improve Supplier Relationships: Provide insights and feedback for continuous improvement
-
Increase Supply Chain Transparency: Visibility into supplier risk and delivery performance
-
Support Strategic Planning: Use trends and metrics to inform procurement and sourcing strategies
Frequently Asked Questions (FAQs)
Q1: Can I customize the dashboard for different suppliers or regions?
Yes, Power BI allows full customization with filters for suppliers, regions, industries, or delivery types.
Q2: How often should supplier data be updated?
Ideally, update data weekly or monthly depending on delivery volume and reporting needs.
Q3: Can I track both delivery performance and financial exposure simultaneously?
Yes, the dashboard combines delivery, compliance, and financial metrics for holistic supplier insights.
Q4: Is this dashboard suitable for global supply chains?
Absolutely. You can analyze suppliers across multiple regions and industries.
Q5: Can I integrate the dashboard with existing ERP or procurement systems?
Yes, Power BI supports integration with Excel, ERP systems, and other data sources for real-time updates.
Conclusion
Click to Buy Supplier Risk Dashboard in Power BI
The Supplier Risk Dashboard in Power BI provides a complete, interactive solution for monitoring supplier performance, compliance, risk, and financial exposure. By leveraging these insights, organizations can mitigate risks, optimize procurement, and ensure a reliable supply chain.
Visit our YouTube channel to learn step-by-step video tutorials
Watch the step-by-step video Demo:
Click to Buy Supplier Risk Dashboard in Power BI