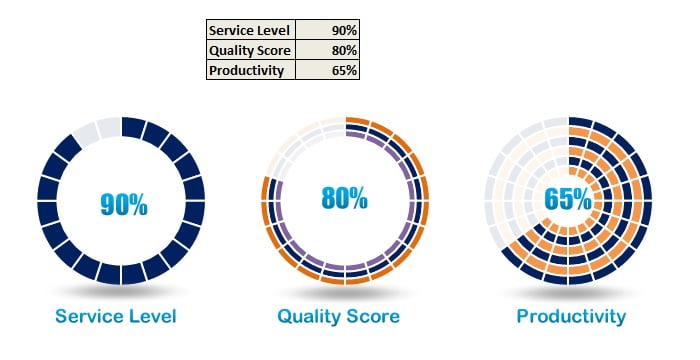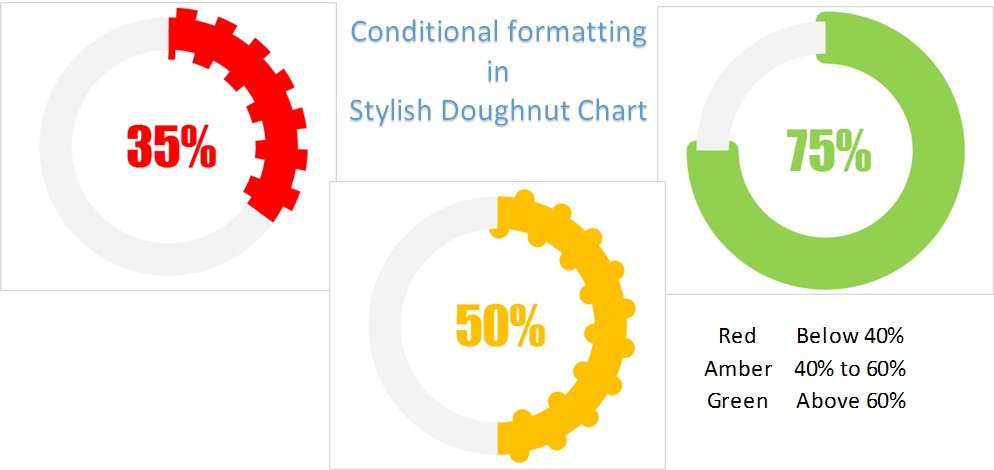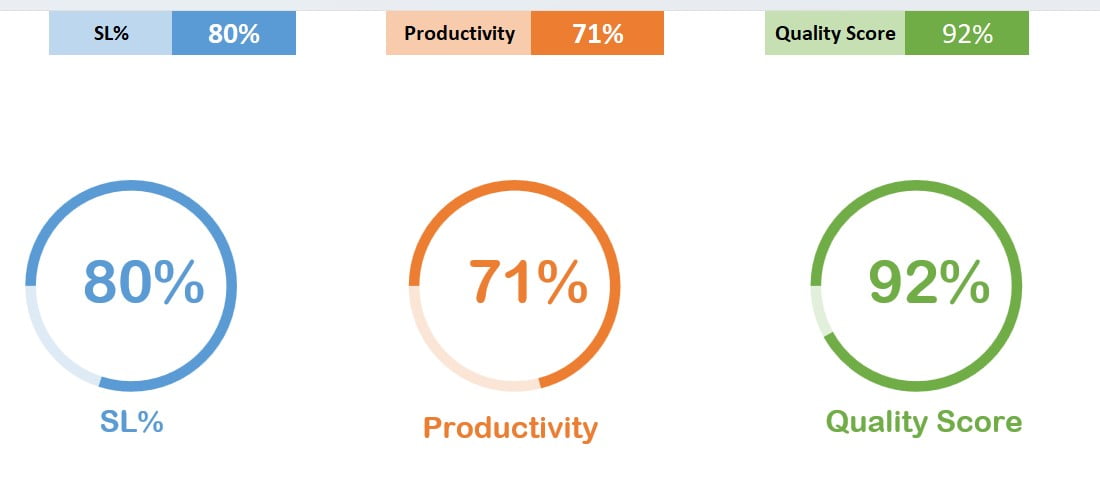
Animated Progress Circle Chart
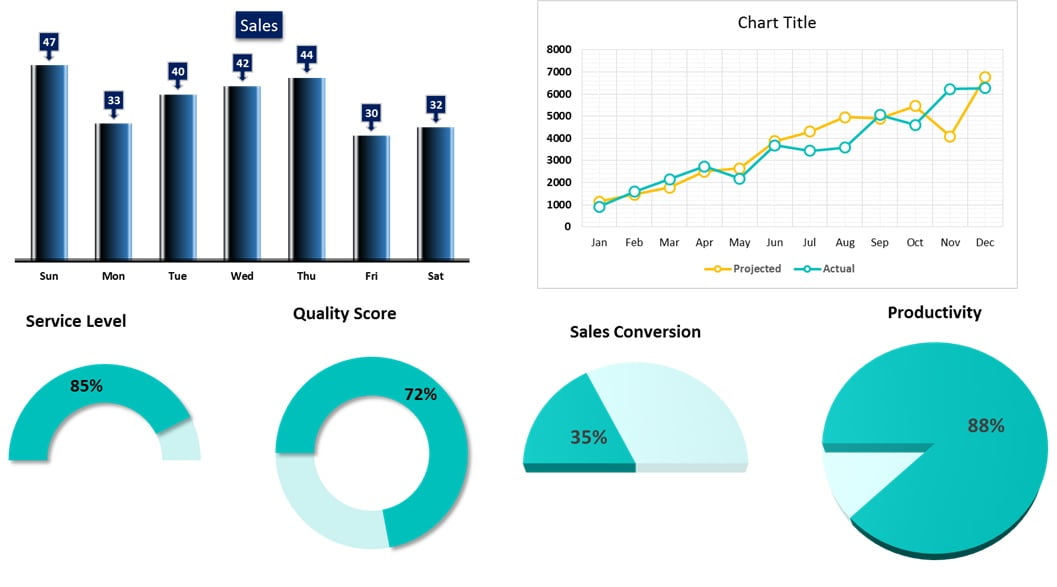
Keeping track of project status or Key Performance Indicators (KPIs) such as service level, productivity, or quality score is a necessity in today's fast-paced corporate world. One efficient, visually appealing,