New: NextGenTemplates Academy - video courses on Excel formulas with AI and Pivot Tables & dashboards. Early-bird: 20% off with code EARLYBIRD20 - first 20 orders only. See the courses →
  • Learn Excel (Free Course)
    • 1. Shortcut Keys
    • 2. Fill & Flash Fill
    • 3. Find & Replace
    • 4. Sort & Filter
    • 5. Formulas & Functions
    • 6. Data Validation
    • 7. Conditional Formatting
    • 8. Basic Charts
    • 9. Advanced Charts
    • 10. Pivot Tables
    • 11. Excel Dashboards
    • 12. VBA Course
    • 13. Excel Formulas with AI
  • Templates
  • Tutorials
    • Charts and Visualization
    • VBA
    • Excel Tips and Tricks
    • Excel Dashboards
    • Power Pivot & DAX
  • Power BI
  • Template Store
    • Ready to Use Templates
  • Courses
  • Academy
    • Excel + AI Mastery: 100 Formulas
    • Excel Pivot Tables & Dashboards
  • About Us
  • Contact Us

PK: An Excel Expert

Transforming Data into Decisions

Tag: Excel

Half Circle KPI
Charts and Visualization

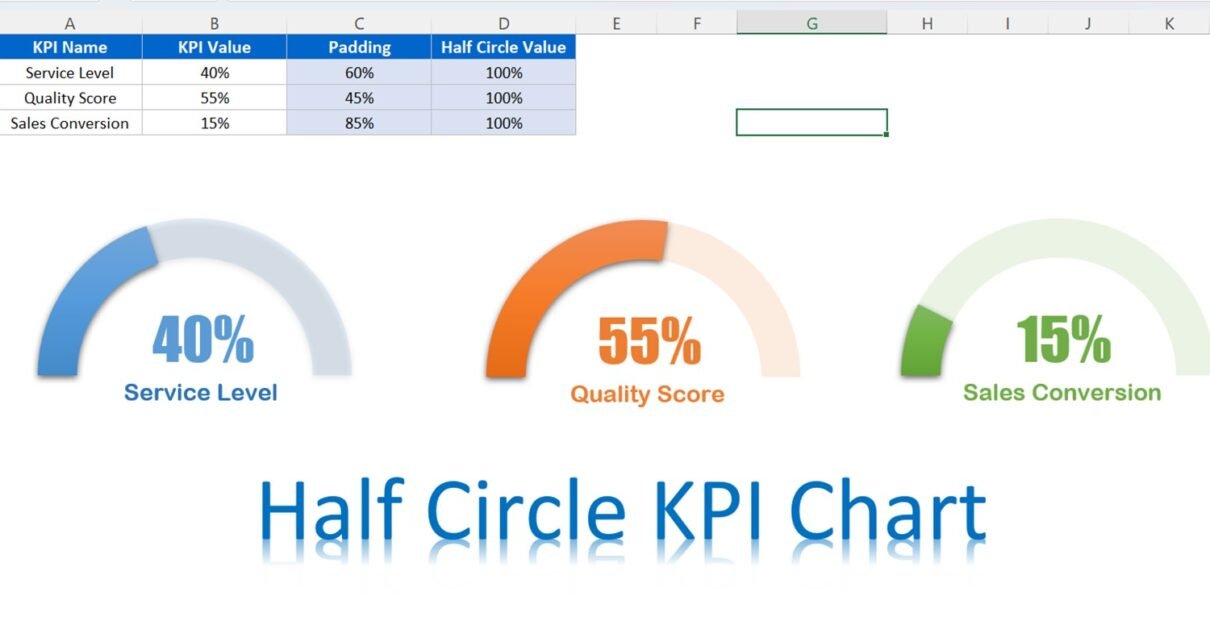
Half Circle KPI Charts in Excel using Doughnut Charts

March 9, 2023March 1, 2025 PKComments Off on Half Circle KPI Charts in Excel using Doughnut Charts
Key Performance Indicators (KPIs) are metrics used to measure the success of a company or a particular project. KPIs can help businesses make informed decisions based on data, improve efficiency,
Read More
Dynamic Attendance Sheet Using Power Pivot
Templates

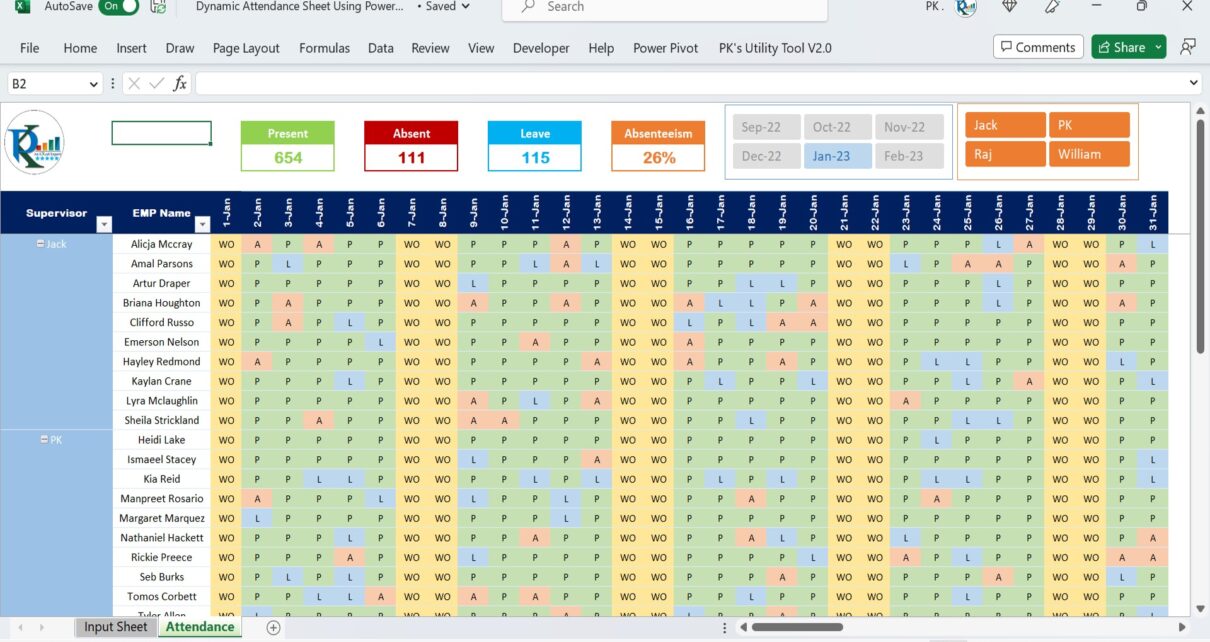
Dynamic Attendance Sheet Using Power Pivot

February 20, 2023February 20, 2025 PKComments Off on Dynamic Attendance Sheet Using Power Pivot
Introduction In today's digital age, managing attendance in schools, colleges, or offices is a time-consuming task. This dynamic attendance sheet can help streamline this process by providing real-time attendance data
Read More
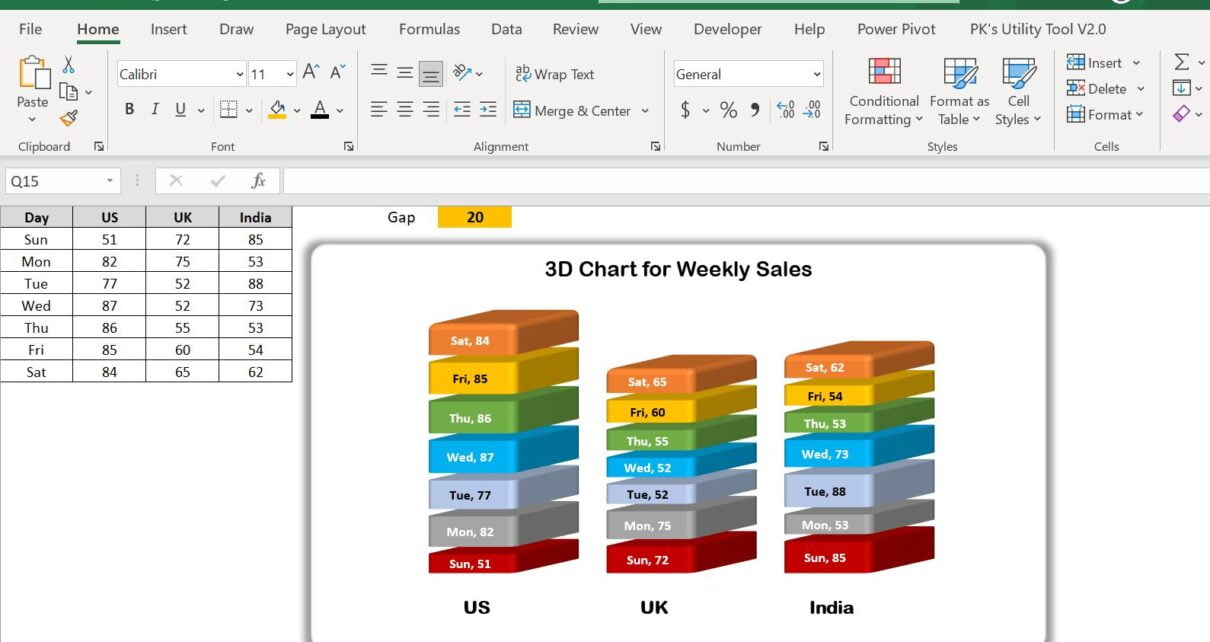
3D Charts for Weekly Sale
Charts and Visualization

3D Chart for Weekly Sale in Excel

September 26, 2021March 2, 2025 PKComments Off on 3D Chart for Weekly Sale in Excel
Data visualization is a robust strategy for presenting and analyzing vast amounts of data, uncovering trends, patterns, and relationships that may have been previously concealed. 3D charts are a distinctive
Read More
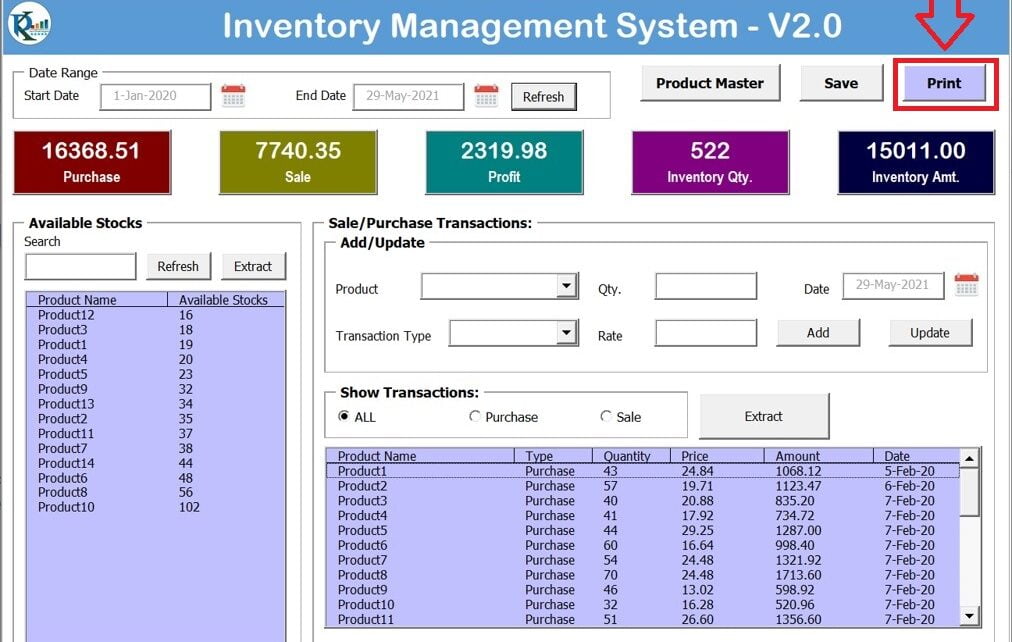
Inventory Management System V2.0
VBA Templates

Inventory Management System – 2.0

June 6, 2021October 10, 2026 PKComments Off on Inventory Management System – 2.0
The Inventory Management System (IMS) is an essential tool for businesses of all sizes, helping them streamline and efficiently manage their stock levels. Version 2.0 offers significant improvements, providing users
Read More
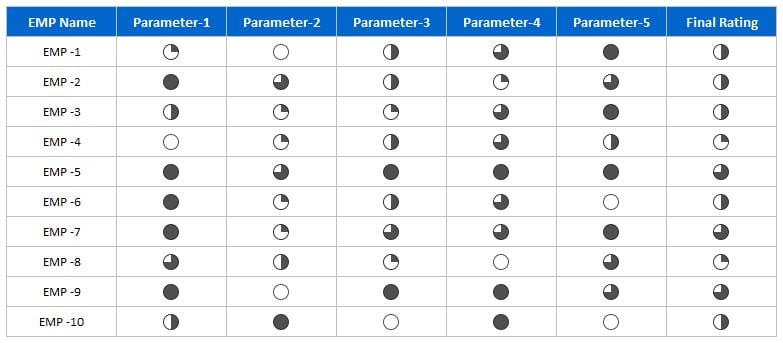
Emp Rating Table
Charts and Visualization

Employee Rating Table in Excel

March 25, 2019March 10, 2025 PKComments Off on Employee Rating Table in Excel
An Employee Rating Table in Excel can be a powerful template to visualize and track employee performance across various parameters. So, instead of displaying simple numerical ratings, you can use
Read More
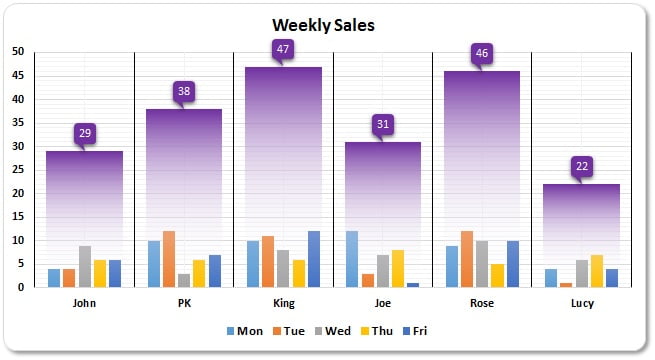
Weekly Sales Chart
Charts and Visualization

Weekly Sales Chart in Excel

May 2, 2018March 9, 2025 PK0
In today's business world, charts and graphs have become an essential part of data analysis. They help to present complex data in a clear and concise manner, allowing us to
Read More

Posts pagination

Previous 1 … 8 9
  • Learn Excel (Free Course)
    • 1. Shortcut Keys
    • 2. Fill & Flash Fill
    • 3. Find & Replace
    • 4. Sort & Filter
    • 5. Formulas & Functions
    • 6. Data Validation
    • 7. Conditional Formatting
    • 8. Basic Charts
    • 9. Advanced Charts
    • 10. Pivot Tables
    • 11. Excel Dashboards
    • 12. VBA Course
    • 13. Excel Formulas with AI
  • Templates
  • Tutorials
    • Charts and Visualization
    • VBA
    • Excel Tips and Tricks
    • Excel Dashboards
    • Power Pivot & DAX
  • Power BI
  • Template Store
    • Ready to Use Templates
  • Courses
  • Academy
    • Excel + AI Mastery: 100 Formulas
    • Excel Pivot Tables & Dashboards
  • About Us
  • Contact Us
Copyright © 2023 PK-AnExcelExpert.com - Privacy Policy