New: NextGenTemplates Academy - video courses on Excel formulas with AI and Pivot Tables & dashboards. Early-bird: 20% off with code EARLYBIRD20 - first 20 orders only. See the courses →
  • Learn Excel (Free Course)
    • 1. Shortcut Keys
    • 2. Fill & Flash Fill
    • 3. Find & Replace
    • 4. Sort & Filter
    • 5. Formulas & Functions
    • 6. Data Validation
    • 7. Conditional Formatting
    • 8. Basic Charts
    • 9. Advanced Charts
    • 10. Pivot Tables
    • 11. Excel Dashboards
    • 12. VBA Course
    • 13. Excel Formulas with AI
  • Templates
  • Tutorials
    • Charts and Visualization
    • VBA
    • Excel Tips and Tricks
    • Excel Dashboards
    • Power Pivot & DAX
  • Power BI
  • Template Store
    • Ready to Use Templates
  • Courses
  • Academy
    • Excel + AI Mastery: 100 Formulas
    • Excel Pivot Tables & Dashboards
  • About Us
  • Contact Us

PK: An Excel Expert

Transforming Data into Decisions

Tag: Sales Chart

Infographics with Line Chart in Excel: Use Icons as Markers
Charts and Visualization

Infographics with Line Chart in Excel: Use Icons as Markers

August 6, 2018October 9, 2026 PK0
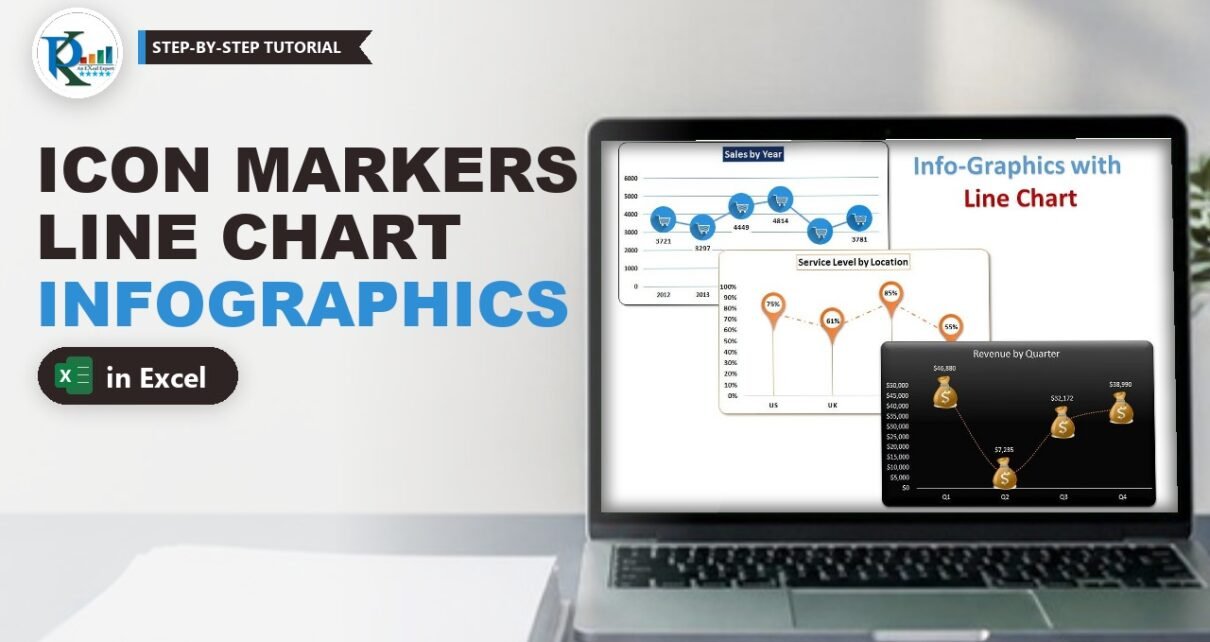
Infographics with a line chart in Excel means swapping the plain round markers for meaningful icons: a shopping cart for sales, a money bag for revenue and a location pin
Read More
Picture Effect in Excel Chart: 3D Charts with the Camera Tool
Charts and Visualization

Picture Effect in Excel Chart: 3D Charts with the Camera Tool

July 30, 2018October 9, 2026 PK0
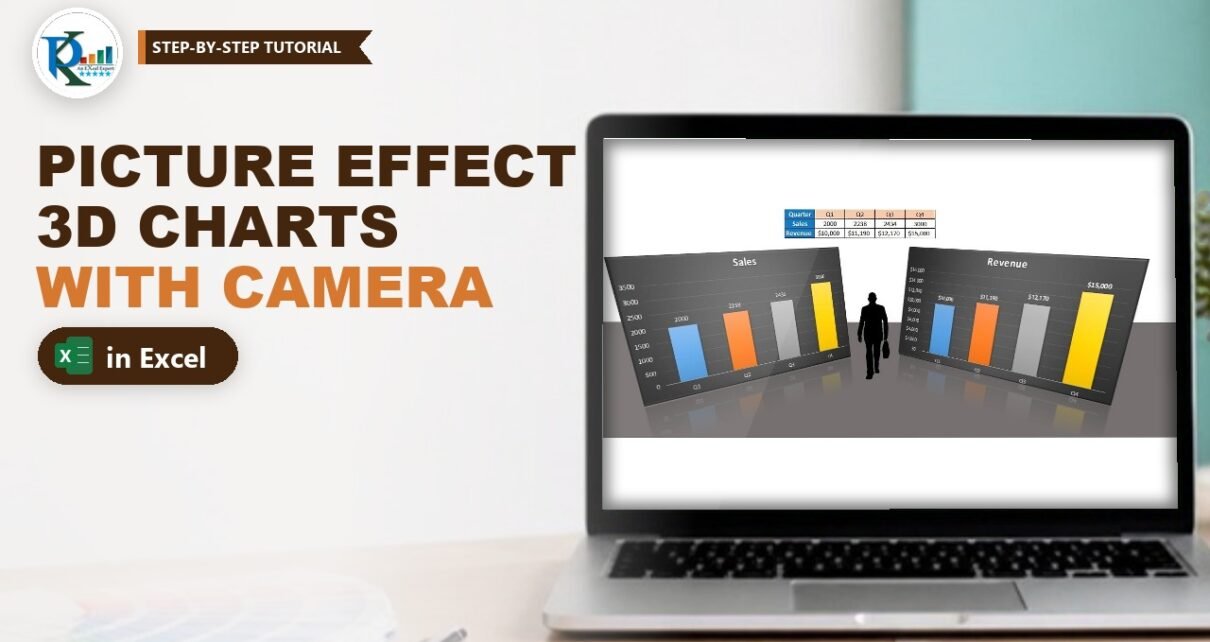
A picture effect in an Excel chart turns a flat column chart into something that looks like a 3D display board standing on a floor, with a reflection underneath. Excel
Read More
Ring Chart in Excel: 3D Doughnut Chart with a Live Total
Charts and Visualization

Ring Chart in Excel: 3D Doughnut Chart with a Live Total

July 22, 2018October 9, 2026 PK0
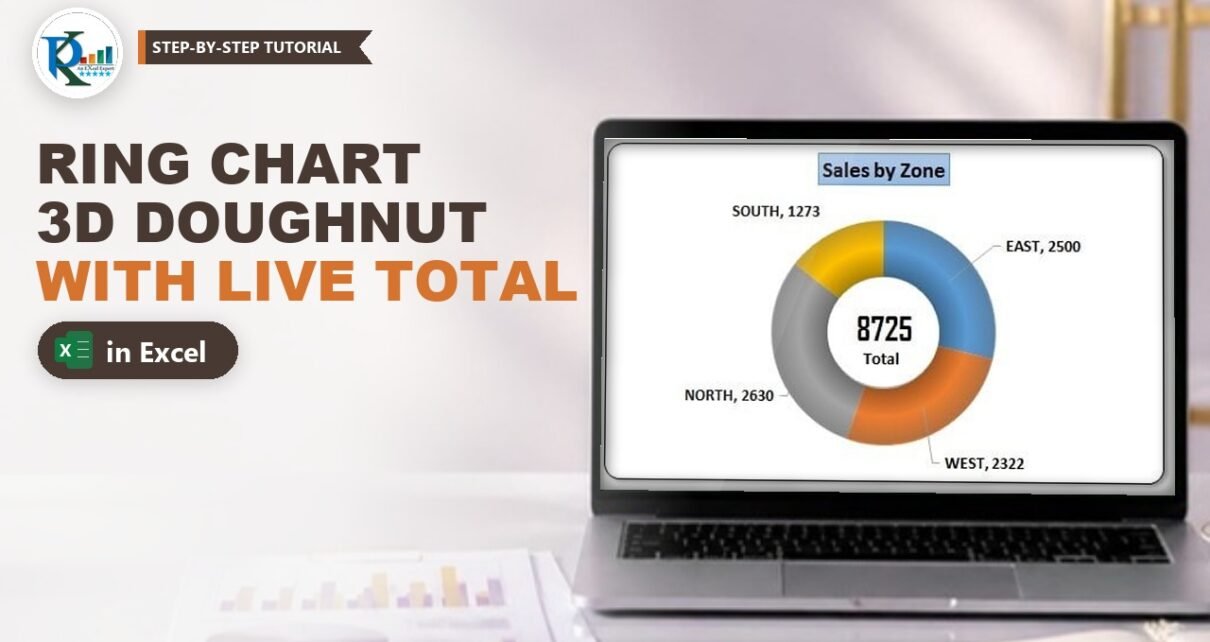
A ring chart in Excel is a doughnut chart dressed up to look like a shiny 3D ring, with the total shown right in the middle. It is a great
Read More
Employee wise deficit and surplus sales chart
Charts and Visualization

Employee Wise Deficit and Surplus Sales Chart

June 27, 2018March 9, 2025 PK0
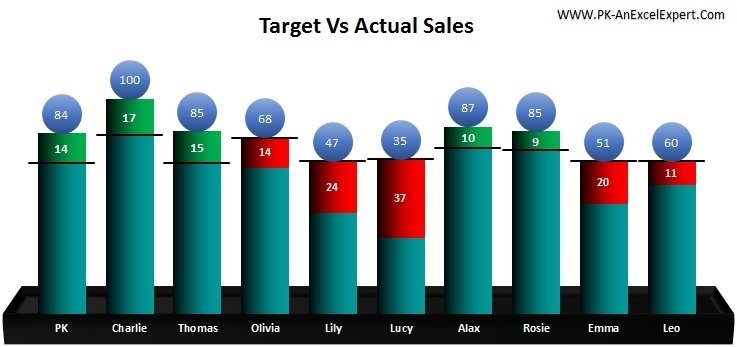
In this article you will learn how to create an Employee Wise Deficit and Surplus Sales Chart. This chart will give 2 types of analysis. This will give an employee
Read More
Multilayered Doughnut Chart in Excel Part 2: Team Performance
Charts and Visualization

Multilayered Doughnut Chart in Excel Part 2: Team Performance

June 14, 2018October 9, 2026 PK0
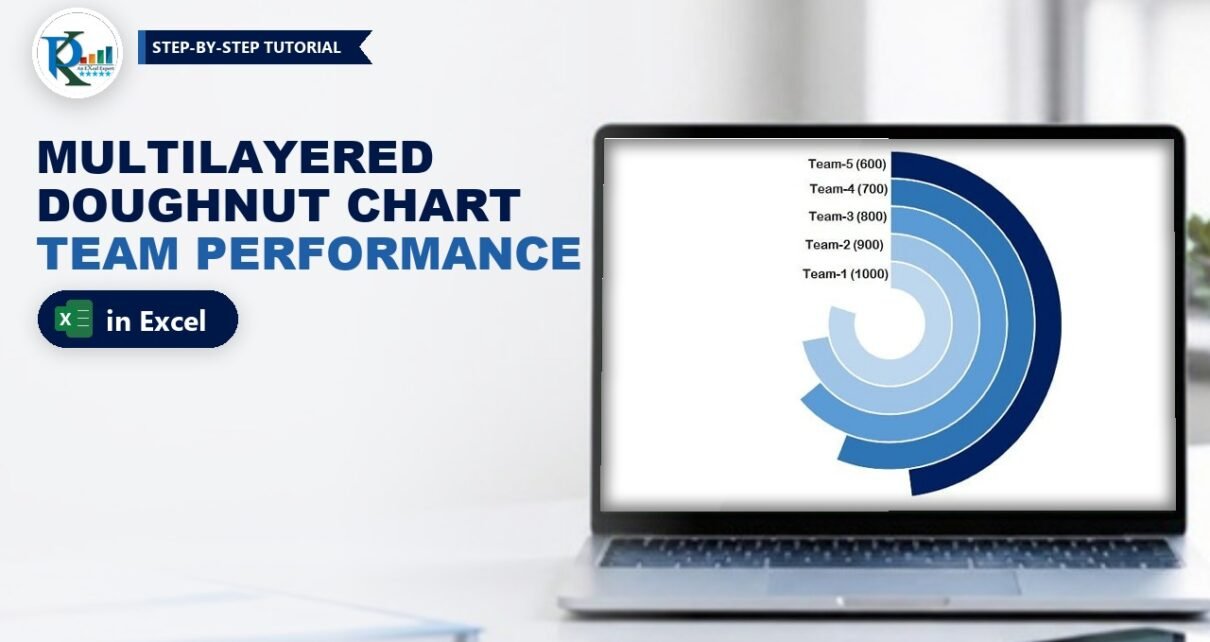
A multilayered doughnut chart in Excel stacks one ring per team, so you can compare five or six teams at a glance in a dashboard or presentation. This is Part
Read More
Weekly Sales Chart
Charts and Visualization

Weekly Sales Chart in Excel

May 2, 2018March 9, 2025 PK0
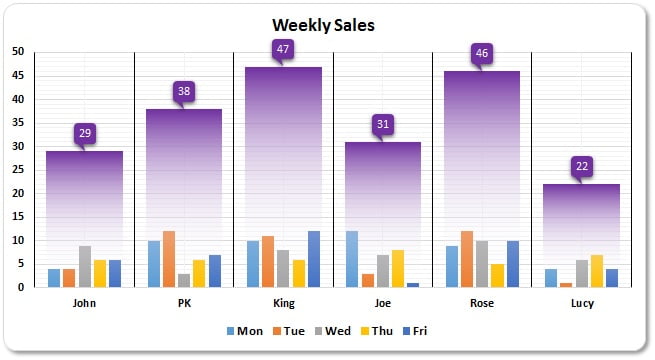
In today's business world, charts and graphs have become an essential part of data analysis. They help to present complex data in a clear and concise manner, allowing us to
Read More

Posts pagination

Previous 1 2
  • Learn Excel (Free Course)
    • 1. Shortcut Keys
    • 2. Fill & Flash Fill
    • 3. Find & Replace
    • 4. Sort & Filter
    • 5. Formulas & Functions
    • 6. Data Validation
    • 7. Conditional Formatting
    • 8. Basic Charts
    • 9. Advanced Charts
    • 10. Pivot Tables
    • 11. Excel Dashboards
    • 12. VBA Course
    • 13. Excel Formulas with AI
  • Templates
  • Tutorials
    • Charts and Visualization
    • VBA
    • Excel Tips and Tricks
    • Excel Dashboards
    • Power Pivot & DAX
  • Power BI
  • Template Store
    • Ready to Use Templates
  • Courses
  • Academy
    • Excel + AI Mastery: 100 Formulas
    • Excel Pivot Tables & Dashboards
  • About Us
  • Contact Us
Copyright © 2023 PK-AnExcelExpert.com - Privacy Policy