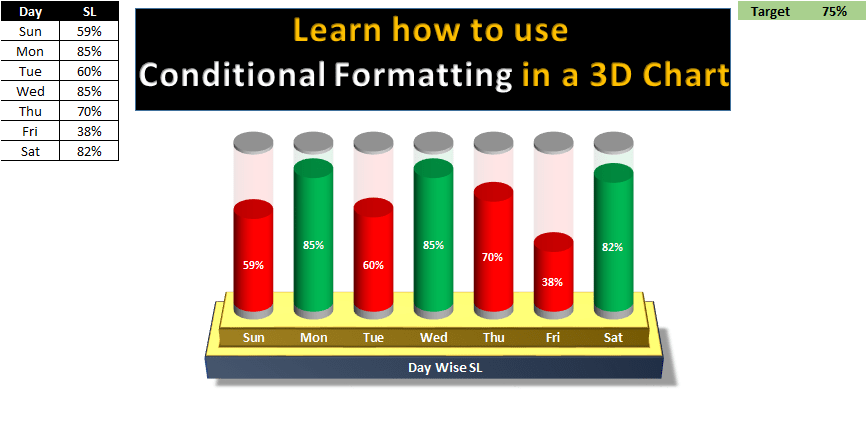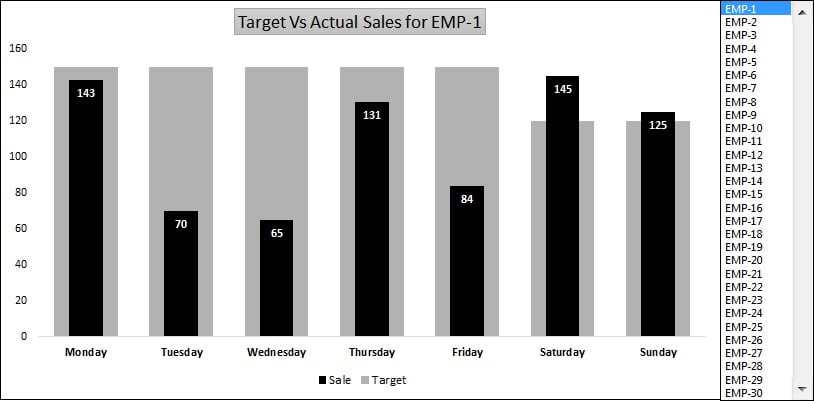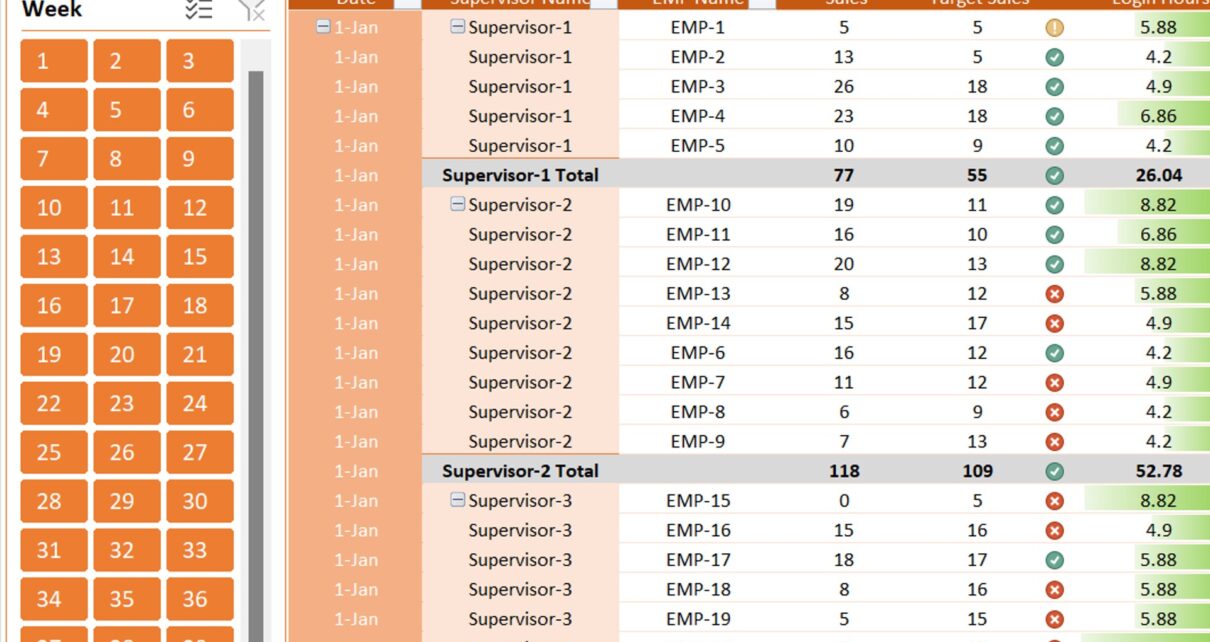
Conditional Formatting in a Pivot Table with 3 Example
Conditional formatting in a Pivot Table is a very useful feature in Microsoft Excel. If you are working on an Excel Report or Excel Dashboard then often require conditional formatting
Transforming Data into Decisions