In today’s fast-moving business world, tax departments deal with strict deadlines, complex regulations, and the growing need for accuracy. Because of this, tax professionals must monitor their Key Performance Indicators (KPIs) with clarity and speed. A Tax Advisory KPI Dashboard in Excel becomes the perfect tool for this. It helps accountants, consultants, auditors, and tax advisory teams track their performance without stress.
This article explains everything you need to know about the Tax Advisory KPI Dashboard in Excel. You will learn how it works, why it matters, its features, advantages, best practices, and much more. You will also find a detailed FAQ section at the end.
Click to buy Tax Advisory KPI Dashboard in Excel
What Is a Tax Advisory KPI Dashboard in Excel?
A Tax Advisory KPI Dashboard in Excel is a ready-to-use analytical tool that brings all tax-related KPIs into one place. It helps tax departments track monthly and yearly performance with structured visuals and automated calculations. This dashboard allows teams to measure actuals, targets, and previous-year numbers with ease. As a result, they stay ahead of compliance tasks, reduce errors, and improve turnaround time.
The Excel dashboard gives you a simple way to manage:
- Filing deadlines
- Audit timelines
- Client tax requirements
- Case resolutions
- Target vs. actual performance
- Team productivity and efficiency
- Yearly comparisons
- Trend analysis across months
Since everything stays stored inside Excel, you get flexibility to customize, modify, and connect your own data without needing complex software.
Why Do Tax Professionals Need a KPI Dashboard?
Tax teams manage large volumes of data throughout the year. They handle returns, audits, notices, appeals, reconciliations, tax provisioning, and assessments. Because of this heavy workload, tracking performance manually often leads to delays, errors, and outdated reporting.
Therefore, a KPI dashboard becomes essential. It ensures that every metric stays visible, updated, and easy to analyze. It becomes even more useful during compliance seasons when workloads increase.
With this dashboard, you can:
- Track KPIs in real time
- Compare results with the previous year
- Monitor team efficiency
- Measure client tax compliance
- Identify performance gaps early
- Make strategic improvements
The dashboard also turns raw numbers into visual insights. As a result, tax leaders make better and faster decisions.
Key Features of the Tax Advisory KPI Dashboard in Excel
This dashboard is designed to be simple, interactive, and functional. It includes 7 important worksheets, each serving a unique purpose.
Summary Page – The Index of the Dashboard
The Summary Page works as the index of the entire dashboard. It includes six navigation buttons, and each button takes you directly to the respective sheet. As a result, users move through the file easily without scrolling or searching.
This page improves user experience and allows tax teams to focus on insights rather than navigation.
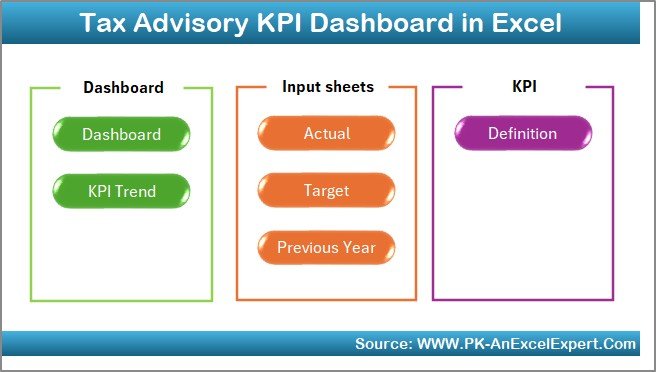
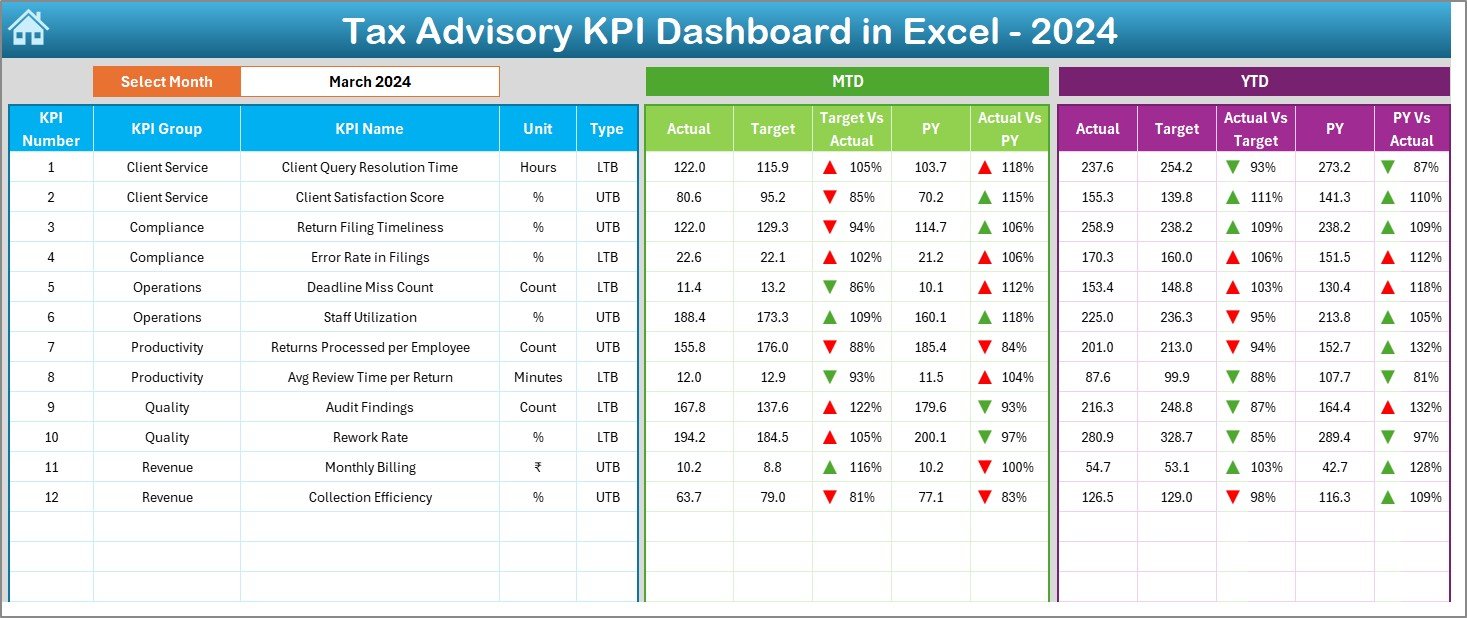
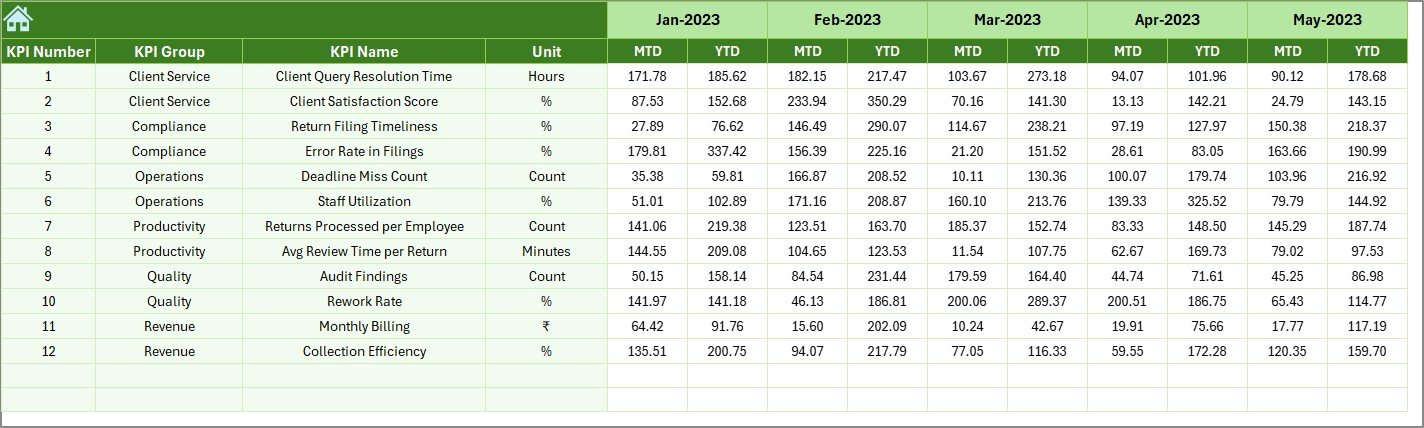
Dashboard Sheet – The Main Performance View
This is the most important sheet in the entire workbook. It displays all KPIs with their monthly and yearly performance.
Interactive Month Selection
You can choose the required month using a drop-down placed in cell D3. As soon as you select a month, the entire dashboard refreshes automatically.
MTD and YTD Analysis
The dashboard shows:
- MTD Actual
- MTD Target
- MTD Previous Year
- Target vs Actual comparison
- Previous Year vs Actual comparison
It also includes conditional formatting arrows to show whether the performance is improving or declining.
The same structure is repeated for YTD data, which helps users track long-term performance at a glance.
Click to buy Tax Advisory KPI Dashboard in Excel
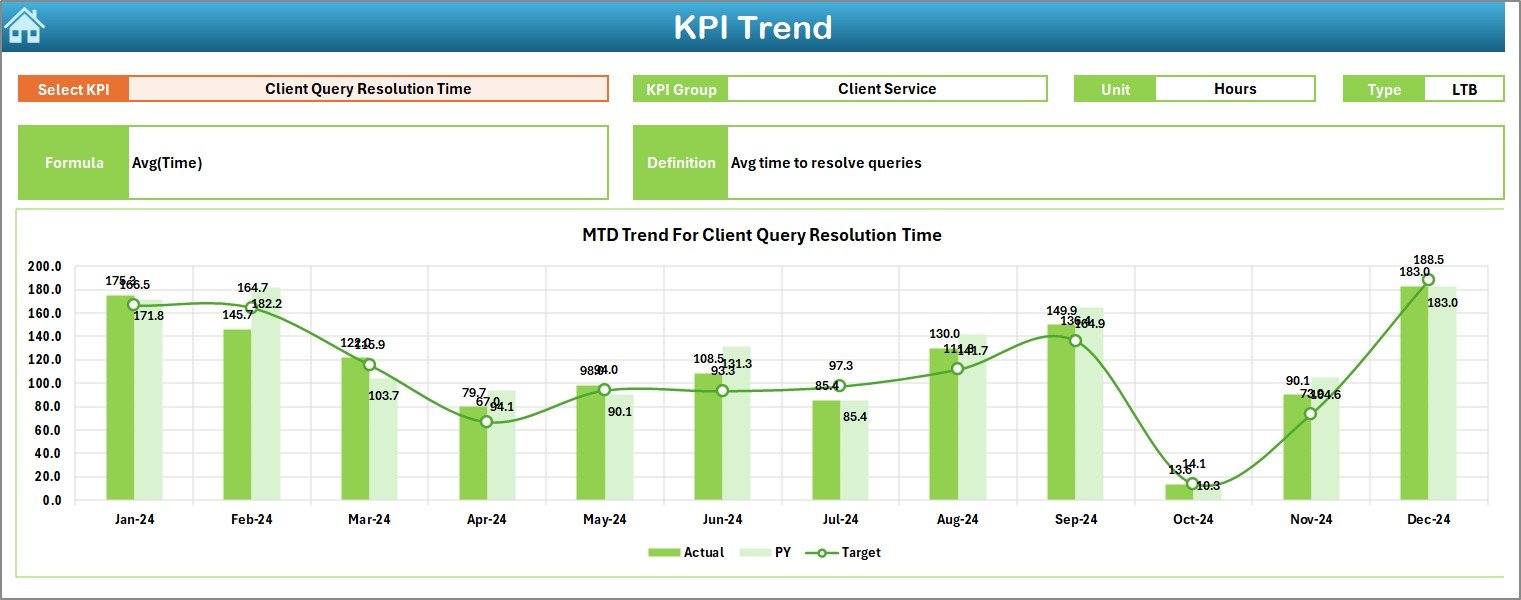
Trend Sheet – Visual KPI Movement
The Trend Sheet shows how each KPI performs across months. You can choose any KPI using the drop-down in cell C3.
Once you select a KPI, the sheet displays:
- KPI Group
- KPI Unit
- KPI Type (UTB or LTB)
- KPI Formula
- KPI Definition
This page includes two line charts:
- MTD Trend Chart
- YTD Trend Chart
Both charts display Actual vs Target vs Previous Year values, which helps tax leaders understand performance movement over time.
Click to buy Tax Advisory KPI Dashboard in Excel
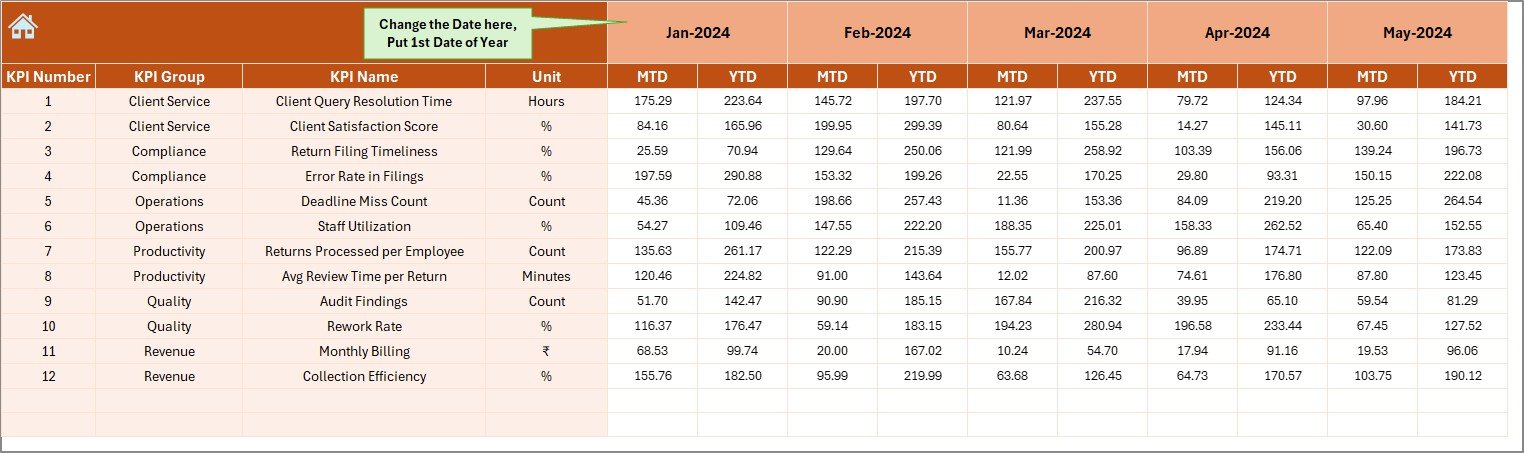
Actual Numbers Input Sheet – Capture Monthly Data
This sheet is the base of the dashboard. You will enter the actual MTD and YTD numbers for each month here.
A month selector is available in cell E1, which allows you to choose the starting month of the financial year. This feature is helpful for companies that follow:
- Calendar Year (Jan–Dec)
- Financial Year (Apr–Mar)
- Custom Fiscal Year
Once you update the data here, the entire dashboard updates instantly.
Click to buy Tax Advisory KPI Dashboard in Excel
Target Sheet – Set Monthly Goals
The Target Sheet allows you to enter monthly MTD and YTD targets for each KPI. These targets help measure how the tax team performs compared to planned goals.
Because every tax department works with different priorities, this sheet allows full flexibility to:
- Set department-level goals
- Modify targets every month
- Align team performance with business goals
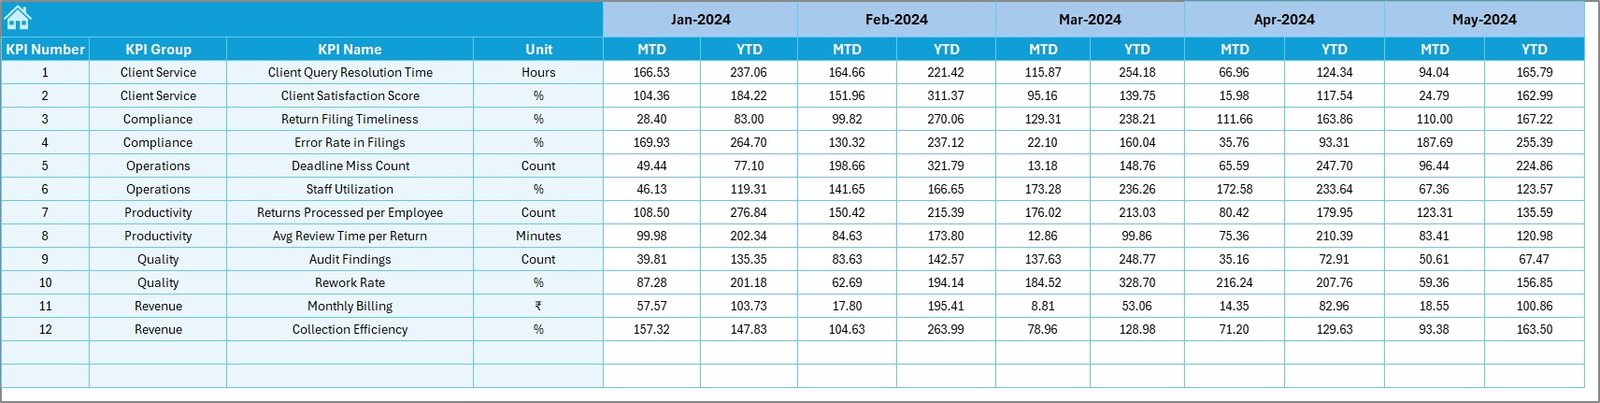
Previous Year Numbers Sheet – Compare Last Year’s Results
This sheet holds previous year MTD and YTD numbers. When you update this sheet, the dashboard calculates growth, decline, and overall progress.
This comparison helps tax departments understand:
- Performance improvements
- Areas requiring attention
- Compliance consistency
Click to buy Tax Advisory KPI Dashboard in Excel
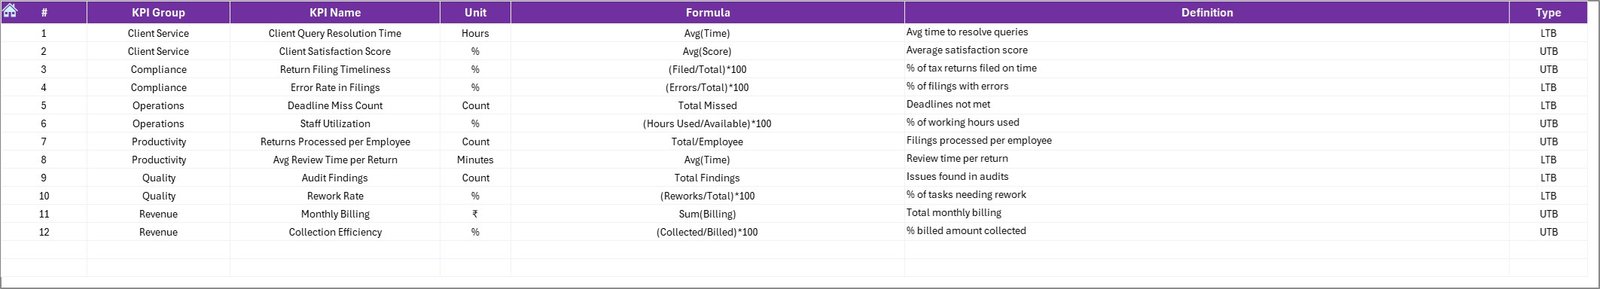
KPI Definition Sheet – KPI Master Database
The KPI Definition Sheet stores:
- KPI Name
- KPI Group
- Unit
- Formula
- Short KPI Definition
These details appear on the Trend Sheet whenever a KPI is selected. Keeping definitions inside the dashboard creates clarity and reduces confusion for new users.
Click to buy Tax Advisory KPI Dashboard in Excel
What KPIs Can You Track in a Tax Advisory Dashboard?
Although the actual KPIs may vary from one tax firm to another, below are some common examples:
- Number of Tax Returns Filed
- Tax Notices Closed
- Tax Audit Completion Rate
- Average Resolution Time
- Compliance Accuracy Rate
- Client Satisfaction Score
- Refund Processing Speed
- Assessment Closure Rate
- Penalty Reduction Percentage
- Case Pending Count
- Monthly Filing Turnaround Time
- Revenue from Tax Services
These KPIs help tax teams measure both productivity and compliance.
Advantages of the Tax Advisory KPI Dashboard in Excel
Using this dashboard gives you multiple benefits. Let’s understand them in detail.
- Centralized Performance Tracking
The dashboard displays all major tax KPIs in a single workbook. Therefore, teams avoid juggling multiple files, spreadsheets, or reports.
- Instant Month Selection
You can switch between months using a simple drop-down. This feature makes monthly reporting fast and effortless.
- Clear Visual Insights
Charts, comparison arrows, and conditional formatting help users understand results instantly. This makes analysis easier for both beginners and experts.
- Real-Time Updates
The dashboard refreshes automatically when you update actuals, targets, or previous-year numbers. This saves time and reduces manual work.
- Trend Analysis Across the Year
Trend charts show how performance moves across months. This helps teams spot patterns early and make improvements.
- No Technical Skills Required
Since the entire dashboard runs on Excel formulas, anyone can use it without learning advanced tools.
- Easy Customization
You can add new KPIs, change formulas, or modify the layout whenever required. This flexibility makes the template suitable for both small and large tax teams.
How to Use the Dashboard Effectively?
Follow these steps to use the dashboard smoothly:
- Enter MTD and YTD actuals in the Actual Numbers Input Sheet
- Enter monthly targets in the Target Sheet
- Update previous year numbers
- Check the Dashboard Sheet for monthly and yearly performance
- Use the Trend Sheet to view KPI movement
- Review KPI definitions whenever needed
With these steps, you will get accurate insights every time.
Best Practices for the Tax Advisory KPI Dashboard in Excel
To get the best results, follow these practices:
Update Data Regularly
Enter actual numbers weekly or monthly. When you update frequently, your dashboard always stays accurate.
Keep KPI Definitions Short and Clear
Simple definitions help team members understand every KPI without confusion.
Use Consistent Data Formats
Use the same units, decimal points, and formats across all sheets. This improves accuracy.
Avoid Too Many KPIs
Pick only the most important KPIs. A focused dashboard makes analysis easier and faster.
Review Trends Every Month
Trend charts show early warning signs. Reviewing these trends helps you plan ahead.
Refresh Targets Annually
Update targets based on:
- Business goals
- New regulations
- Team performance
Automate Calculations
Use Excel formulas for comparisons, differences, and growth percentages. Automation reduces errors.
Conclusion
A Tax Advisory KPI Dashboard in Excel creates a simple and powerful way to track tax performance. It helps teams monitor MTD and YTD numbers, compare results with previous years, and take quick action based on trend insights. Since the dashboard includes interactive sheets, visual charts, and automated calculations, it becomes a valuable tool for tax professionals at all levels.
With the right KPIs and clear goals, your tax advisory operations become more efficient, accurate, and predictable.
Frequently Asked Questions (FAQs)
- What is a Tax Advisory KPI Dashboard?
It is an Excel-based reporting tool that tracks key performance indicators for tax advisory services. It measures actuals, targets, and previous-year numbers.
- Who can use this dashboard?
Tax consultants, accountants, tax managers, audit teams, and financial analysts can use the dashboard.
- Does the dashboard allow customization?
Yes, you can modify KPIs, formulas, layouts, or themes based on your needs.
- Can I track MTD and YTD data?
Yes, the dashboard shows both MTD and YTD actuals, targets, and previous-year values.
- Do I need advanced Excel skills?
No, basic Excel skills are enough. The dashboard is fully automated.
- Are trend charts included?
Yes, the Trend Sheet displays both MTD and YTD trend charts for every KPI.
- How often should I update the data?
You should update actual numbers monthly or weekly for accurate results.
Visit our YouTube channel to learn step-by-step video tutorials
Watch the step-by-step video tutorial:
Click to buy Tax Advisory KPI Dashboard in Excel