Managing performance in the toy and games industry is not as simple as tracking sales numbers alone. You deal with seasonal demand, fast-changing trends, inventory pressure, production efficiency, and customer expectations. Therefore, relying on manual Excel reports or scattered data files often leads to delayed decisions and missed opportunities.
That is exactly where a Toy & Games Industry KPI Dashboard in Power BI becomes a powerful decision-making tool.
In this detailed and SEO-friendly guide, you will clearly understand what a Toy & Games Industry KPI Dashboard in Power BI is, why it matters, how it works, and how each dashboard page supports smarter operational and strategic decisions. Moreover, you will also learn about its advantages, best practices, Excel data structure, and frequently asked questions—all explained in a simple and easy-to-understand manner.
Click to buy Toy & Games Industry KPI Dashboard in Power BI
What Is a Toy & Games Industry KPI Dashboard in Power BI?
A Toy & Games Industry KPI Dashboard in Power BI is an interactive reporting and analytics solution designed to monitor, track, and analyze key performance indicators related to toy manufacturing, distribution, and sales operations.
Instead of working with static spreadsheets, this dashboard converts raw Excel data into meaningful visuals, tables, indicators, and trend charts. As a result, decision-makers can evaluate performance quickly, identify risks early, and take timely corrective actions.
Most importantly, Power BI allows toy and games companies to view both Month-to-Date (MTD) and Year-to-Date (YTD) performance on a single screen. Consequently, leadership teams gain complete visibility without digging into multiple reports.
Why Do Toy & Games Companies Need a KPI Dashboard?
The toy and games industry operates in a highly competitive and seasonal environment. Because market demand shifts quickly, companies must respond faster than ever.
Here’s why a KPI dashboard plays a critical role:
- Seasonal sales peaks require close performance tracking.
- Inventory mismanagement leads to high carrying costs.
- Production delays affect festive and promotional seasons.
- Quality issues impact brand trust and customer satisfaction.
- Manual reporting slows down decision-making.
Therefore, a centralized KPI dashboard ensures that teams stay aligned, proactive, and informed at all times.
How Does a Toy & Games Industry KPI Dashboard in Power BI Work?
This dashboard works by connecting Power BI with an Excel-based data source. Once you update the Excel file, the dashboard refreshes automatically and displays the latest performance metrics.
The solution follows a simple yet powerful structure:
- Excel as a Data Source
- Power BI Desktop Dashboard with Interactive Pages
- KPIs Displayed with MTD and YTD Comparisons
Because of this setup, even non-technical users can maintain and operate the dashboard easily.
Key Features of the Toy & Games Industry KPI Dashboard in Power BI
This ready-to-use dashboard includes three well-structured pages, each designed for a specific analytical purpose.
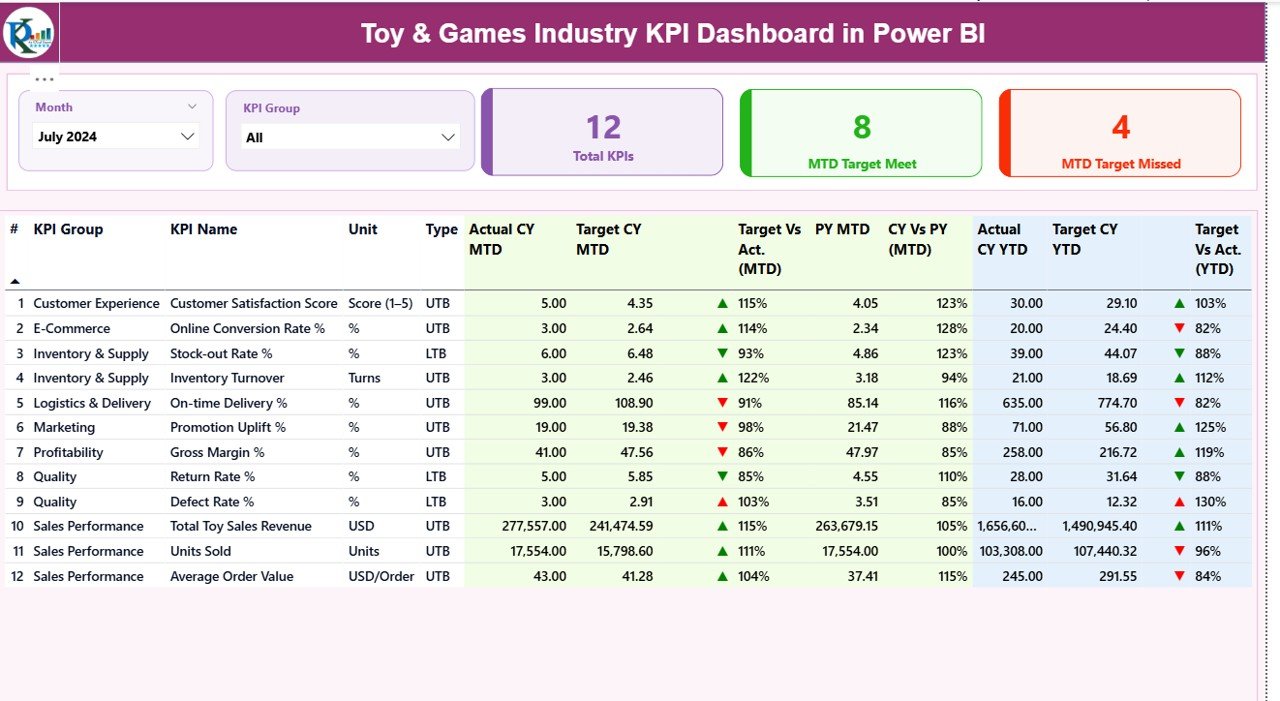
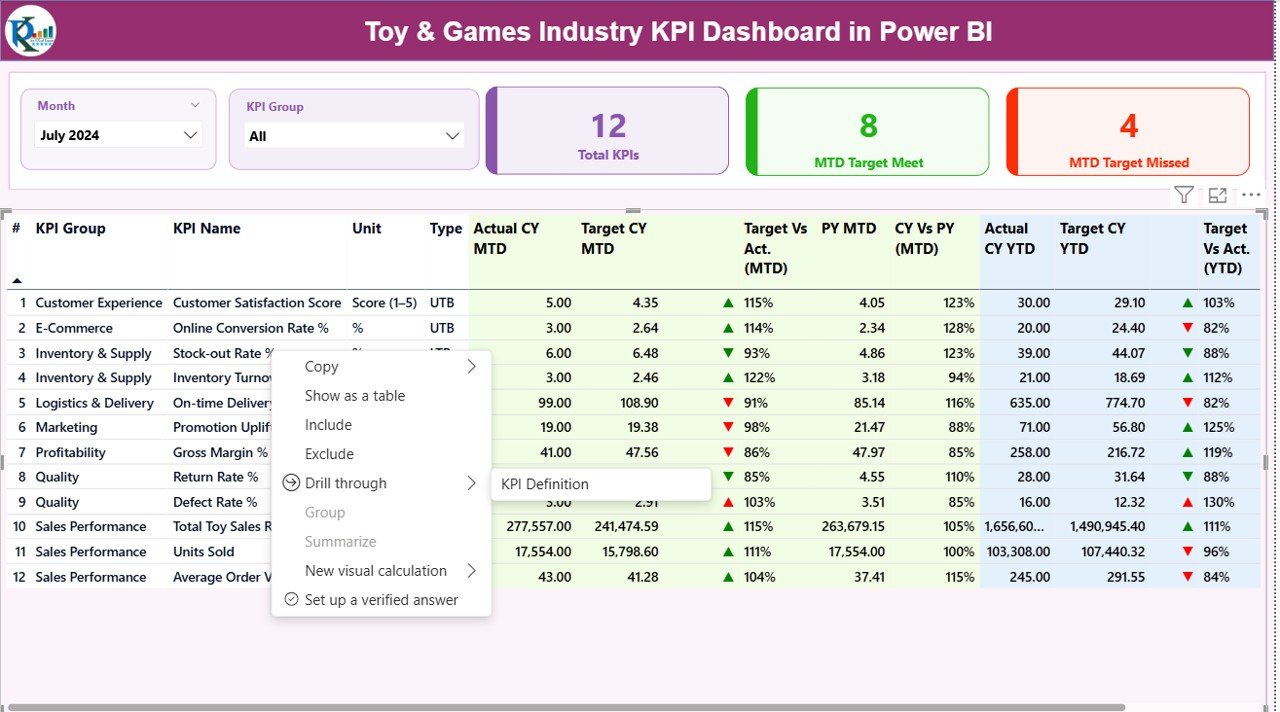
Summary Page
The Summary Page acts as the main control center of the dashboard. As soon as you open the file, you land on this page.
Top-Level Interactive Filters
At the top, you will find:
- Month Slicer – Select any month to view MTD and YTD values.
- KPI Group Slicer – Filter KPIs by category or department.
Because of these slicers, users can customize views instantly without changing the underlying data.
Click to buy Toy & Games Industry KPI Dashboard in Power BI
KPI Cards for Quick Insights
Below the slicers, three KPI cards provide an instant performance overview:
- Total KPIs Count
- MTD Target Met Count
- MTD Target Missed Count
These cards help management quickly judge overall business health.
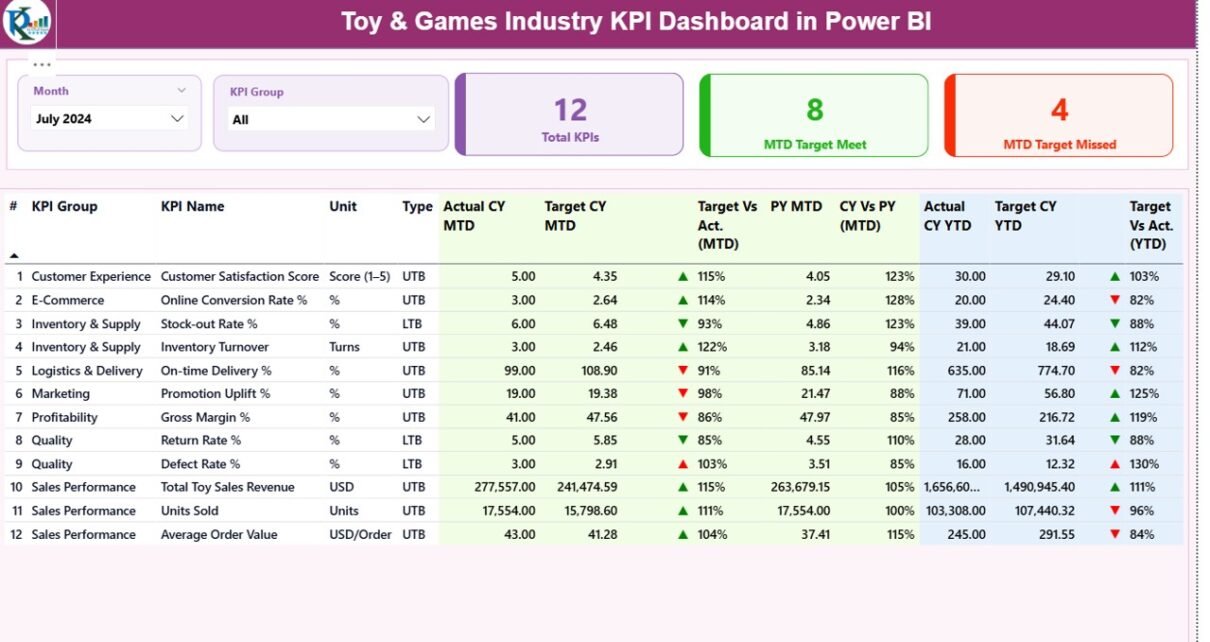
Detailed KPI Performance Table
The core of the Summary Page is a detailed and well-structured table that displays:
- KPI Number – Sequential identifier for each KPI
- KPI Group – Category or functional group
- KPI Name – Name of the performance metric
- Unit – Unit of measurement (%, units, value, etc.)
- Type – LTB (Lower the Better) or UTB (Upper the Better)
Month-to-Date (MTD) Performance Metrics
For MTD analysis, the table includes:
- Actual CY MTD – Current year actual value
- Target CY MTD – Current year target value
- MTD Icon –
- ▲ Green arrow = Target met
- ▼ Red arrow = Target missed
- Target vs Actual (MTD) – Percentage calculated as:
Actual MTD / Target MTD - Previous Year MTD (PY MTD)
- CY vs PY (MTD) – Current vs previous year comparison
These metrics help teams track short-term performance and quickly adjust operations.
Year-to-Date (YTD) Performance Metrics
For long-term tracking, the dashboard also shows:
- Actual CY YTD
- Target CY YTD
- YTD Icon (Green ▲ / Red ▼)
- Target vs Actual (YTD) –
Actual YTD / Target YTD - PY YTD
- CY vs PY (YTD) – Year-over-year comparison
Because of this structure, leadership teams gain both tactical and strategic insights.
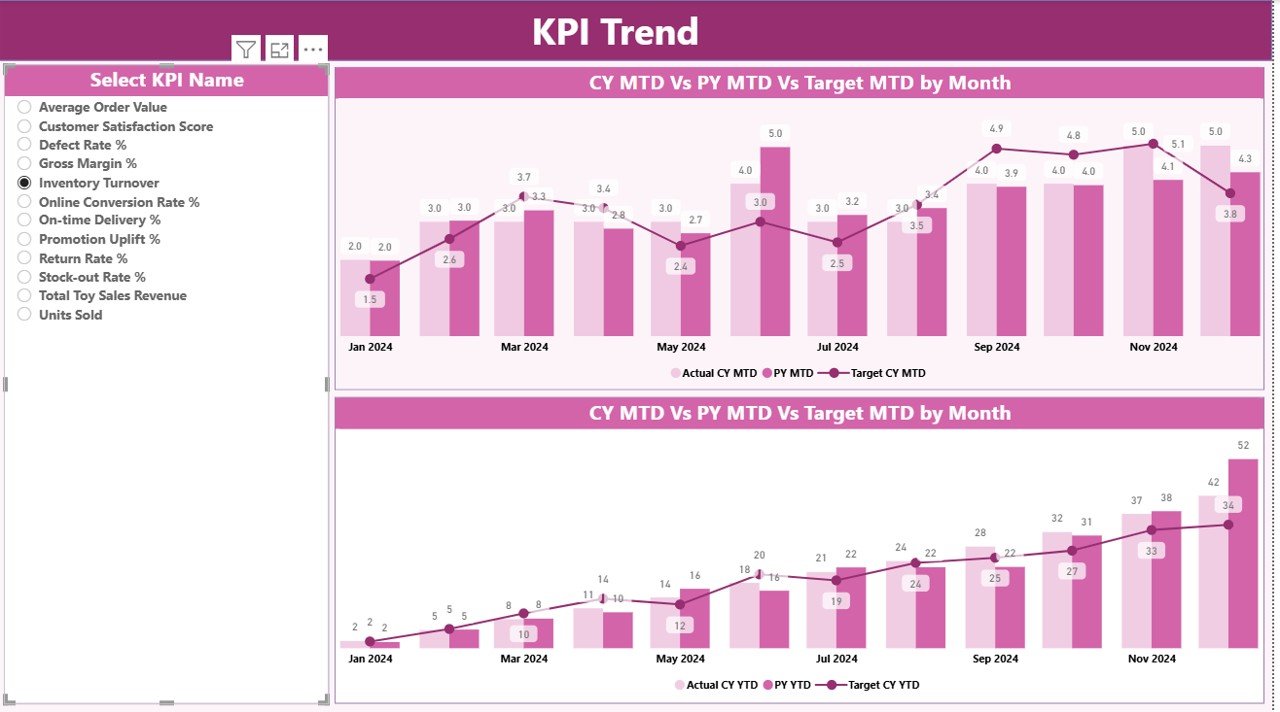
KPI Trend Page
The KPI Trend Page focuses on visual trend analysis.
Interactive KPI Selection
On the left side, a KPI Name slicer allows users to select a specific KPI. Once selected, the charts update automatically.
Combo Charts for Deeper Insights
This page includes two combo charts that display:
- Actual values for the Current Year
- Actual values for the Previous Year
- Target values
These charts show both MTD and YTD trends, making performance patterns easy to understand.
As a result, users can quickly identify:
- Upward or downward trends
- Seasonal spikes
- Performance gaps against targets
Click to buy Toy & Games Industry KPI Dashboard in Power BI
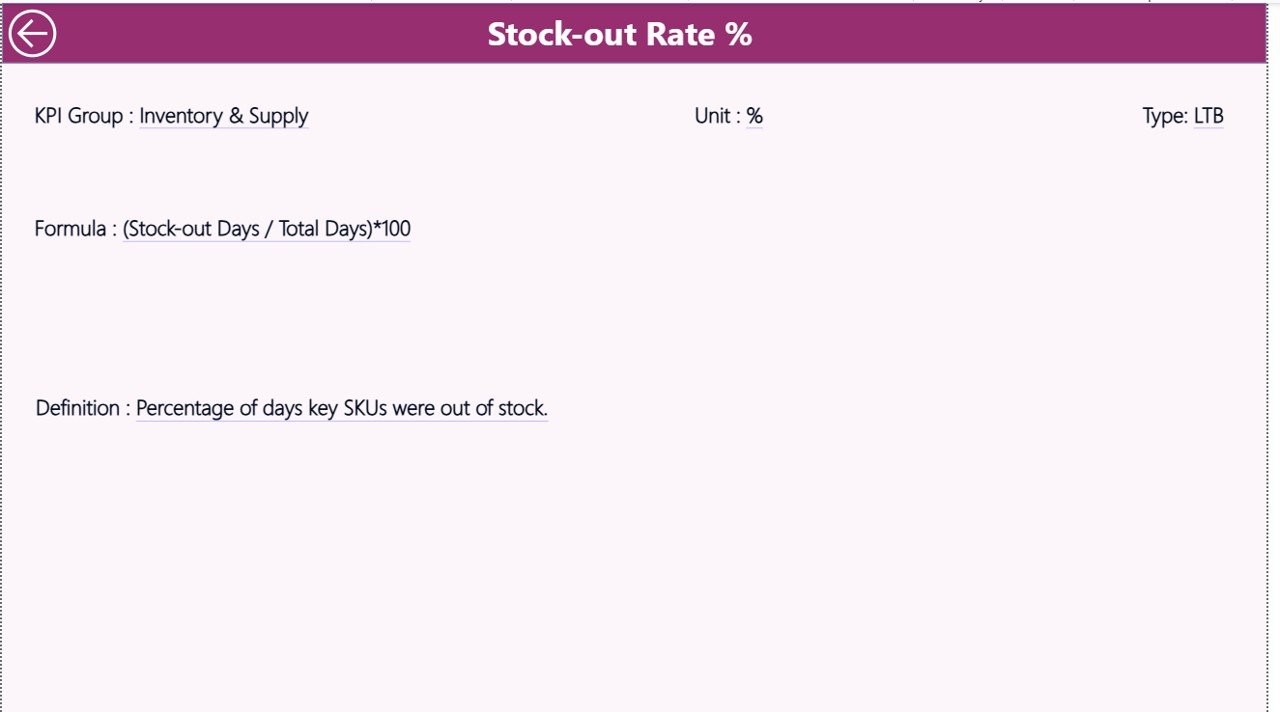
KPI Definition Page
The KPI Definition Page serves as a reference and governance tool.
Drill-Through Functionality
This page remains hidden by default. However, users can drill through from the Summary Page to access detailed KPI information.
What Does the KPI Definition Page Show?
Each KPI includes:
- KPI Number
- KPI Group
- KPI Name
- Unit
- Formula
- Definition
- Type (LTB or UTB)
Because of this clarity, everyone in the organization understands how each KPI works and what it measures.
To return to the Summary Page, users simply click the Back button located at the top-left corner.
Click to buy Toy & Games Industry KPI Dashboard in Power BI
Excel Data Structure Used in This Dashboard
The dashboard uses an Excel file as its data source. This approach keeps the solution flexible and user-friendly.
Input_Actual Sheet
In this worksheet, you enter actual performance data:
- KPI Name
- Month (use the first date of the month)
- MTD Actual Value
- YTD Actual Value
This sheet captures real performance numbers.
Input_Target Sheet
Here, you enter target values for each KPI:
- KPI Name
- Month (first date of the month)
- MTD Target
- YTD Target
Because of this separation, analysis remains clean and structured.
Click to buy Toy & Games Industry KPI Dashboard in Power BI
KPI Definition Sheet
This sheet acts as the foundation of the dashboard. You must define:
- KPI Number
- KPI Group
- KPI Name
- Unit
- Formula
- Definition
- KPI Type (LTB or UTB)
As a result, all calculations and visuals stay aligned with business logic.
Advantages of a Toy & Games Industry KPI Dashboard in Power BI
- Centralized KPI monitoring across functions
- Faster and data-driven decision-making
- Clear MTD and YTD performance visibility
- Improved accountability and transparency
- Easy Excel-based data maintenance
- Strong visual storytelling through charts and icons
- Scalable for growing toy and games businesses
Best Practices for the Toy & Games Industry KPI Dashboard in Power BI
- Define KPIs clearly before building the dashboard
- Keep Excel data clean and standardized
- Review KPI definitions regularly
- Use consistent units and formats
- Update data monthly without delay
- Focus on actionable KPIs rather than vanity metrics
- Train users on slicers and drill-through features
Who Should Use This Dashboard?
This dashboard suits:
- Toy manufacturers
- Games producers
- Sales and operations managers
- Supply chain teams
- Business owners
- Strategy and planning teams
Because of its flexibility, both small and large organizations can use it effectively.
Conclusion
A Toy & Games Industry KPI Dashboard in Power BI transforms raw operational data into meaningful business insights. Instead of relying on delayed reports and manual analysis, this dashboard enables faster decisions, better performance tracking, and clear accountability.
By combining Excel-based data input with Power BI’s powerful visualization capabilities, companies gain full visibility into MTD and YTD performance—all in one place. Therefore, if you want better control, transparency, and growth in the toy and games industry, this dashboard becomes an essential tool.
Frequently Asked Questions (FAQs)
What KPIs can I track in a Toy & Games Industry KPI Dashboard?
You can track sales, production efficiency, inventory turnover, defect rates, order fulfillment, revenue growth, and many more operational KPIs.
Do I need technical knowledge to use this dashboard?
No. You only need basic Excel knowledge. Power BI automatically updates visuals once you refresh the data.
Can I customize KPIs and KPI groups?
Yes. You can easily add, remove, or edit KPIs by updating the KPI Definition Excel sheet.
How often should I update the data?
You should update the data monthly. However, you can also refresh it more frequently if required.
Is this dashboard suitable for small toy businesses?
Yes. The dashboard works well for both small and large companies because of its flexible Excel-based structure.
Can I reuse this dashboard for another industry?
Yes. You can reuse the template by changing KPI definitions and data according to the new industry.
Visit our YouTube channel to learn step-by-step video tutorials
Watch the step-by-step video tutorial:
Click to buy Toy & Games Industry KPI Dashboard in Power BI