Running a language school becomes challenging when student counts increase, classes expand, and new programs start. Because of this growth, academic teams and administrators often struggle to monitor performance, track progress, and manage monthly KPIs effectively. A Language Schools KPI Dashboard in Excel solves this problem. It helps language institutes capture data clearly, understand performance quickly, and take action at the right time.Special Education KPI Dashboard in Excel
In this detailed guide, you will learn everything about the Language Schools KPI Dashboard in Excel, including its purpose, structure, key worksheets, benefits, and best practices. You will also discover how this dashboard boosts operational efficiency and makes performance evaluation simple.Special Education KPI Dashboard in Excel.
Click to buy Special Education KPI Dashboard in Excel
What Is a Language Schools KPI Dashboard in Excel?
A Language Schools KPI Dashboard in Excel is a complete analytical tool designed to help institutions track academic, operational, financial, and student-centric KPIs in one place. It brings together data such as enrollment numbers, attendance records, class performance, revenue, and student satisfaction. The dashboard displays trends, monthly results, and yearly summaries through interactive controls and visually appealing charts.
Because everything stays in a structured format, the management team can easily compare actual performance with targets and previous year values. As a result, decision-making becomes faster, and the academic experience improves consistently.
Why Do Language Schools Need a KPI Dashboard?
Language schools handle multiple activities every day. These include course scheduling, batch management, fee collection, student evaluation, and teacher performance. Without proper tracking, these tasks become disconnected. Therefore, the management cannot see the complete picture.
A KPI dashboard helps schools:
- Track progress monthly
- Identify issues early
- Compare actual vs. target performance
- Improve academic quality
- Boost operational efficiency
- Maintain consistency across programs
- Monitor student satisfaction
- Strengthen long-term planning
Because the dashboard uses Excel, schools do not need additional tools or expensive software.
How the Language Schools KPI Dashboard in Excel Works
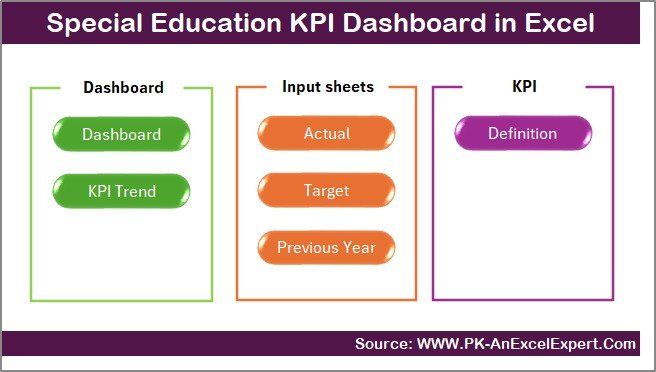
This KPI dashboard contains 7 structured worksheets, each designed to perform a specific function. Below is the detailed explanation of every sheet inside the dashboard.
Summary Page – The Central Navigation Hub
The Summary Page works as the main index page of the entire dashboard. It contains six navigation buttons that help users move quickly to different worksheets. Instead of scrolling or searching manually, you can simply click on a button and jump to the required sheet.
This improves usability and saves time, especially for academic coordinators and administrators who view the dashboard frequently.
Click to buy Special Education KPI Dashboard in Excel
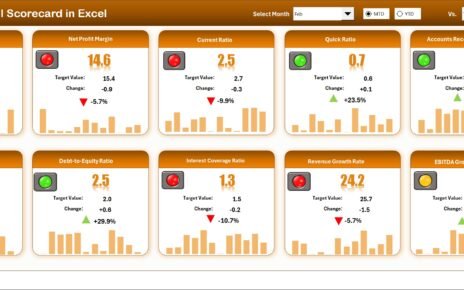
Dashboard Sheet – The Heart of the KPI System
The Dashboard sheet tab is the most important part of the workbook because it displays all KPIs in a visual and easy-to-understand format. Here, you can select the Month from the drop-down located in cell D3. As soon as you change the month, the dashboard updates automatically.
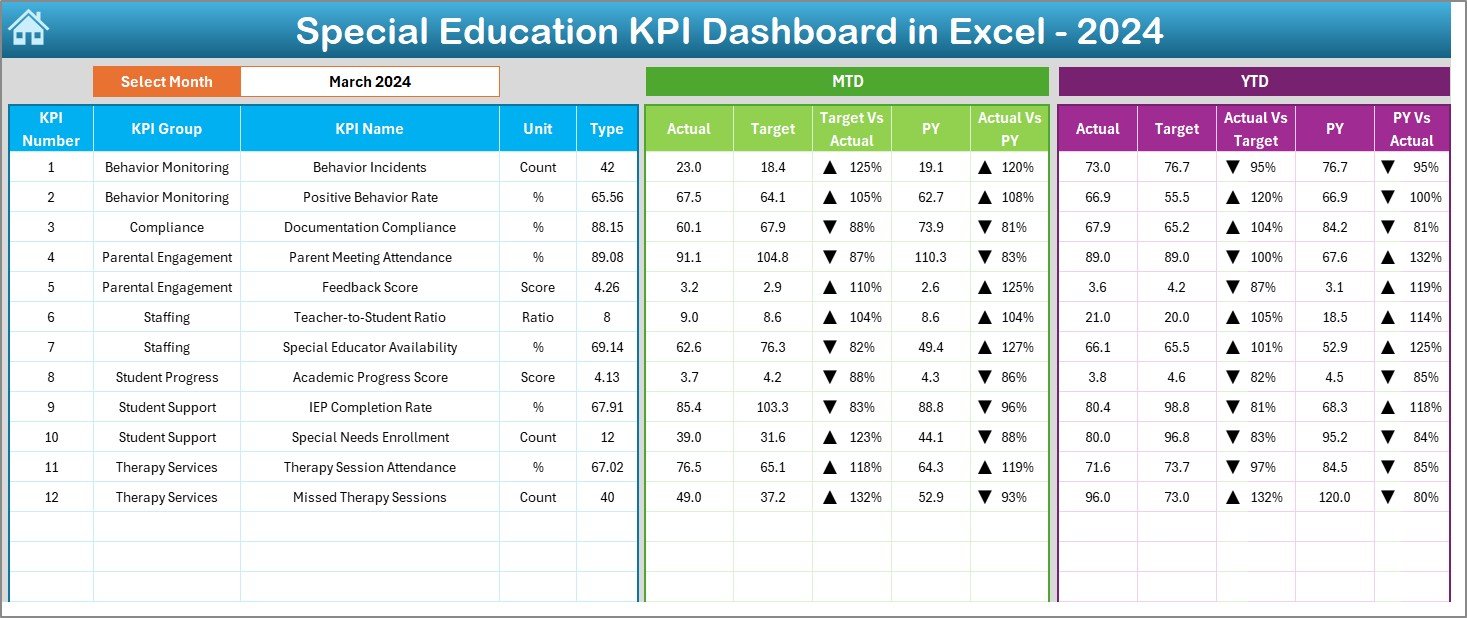
The dashboard highlights:
MTD (Month-To-Date) Performance
- Actual
- Target
- Previous Year (PY)
- Target vs Actual comparison
- PY vs Actual comparison
Conditional formatting shows up and down arrows, making performance identification straightforward.
YTD (Year-To-Date) Performance
- Actual
- Target
- Previous Year
- Target vs Actual analysis
- PY vs Actual analysis
Because both MTD and YTD are visible side-by-side, the management can easily decide whether the school is meeting expectations.
Click to buy Special Education KPI Dashboard in Excel
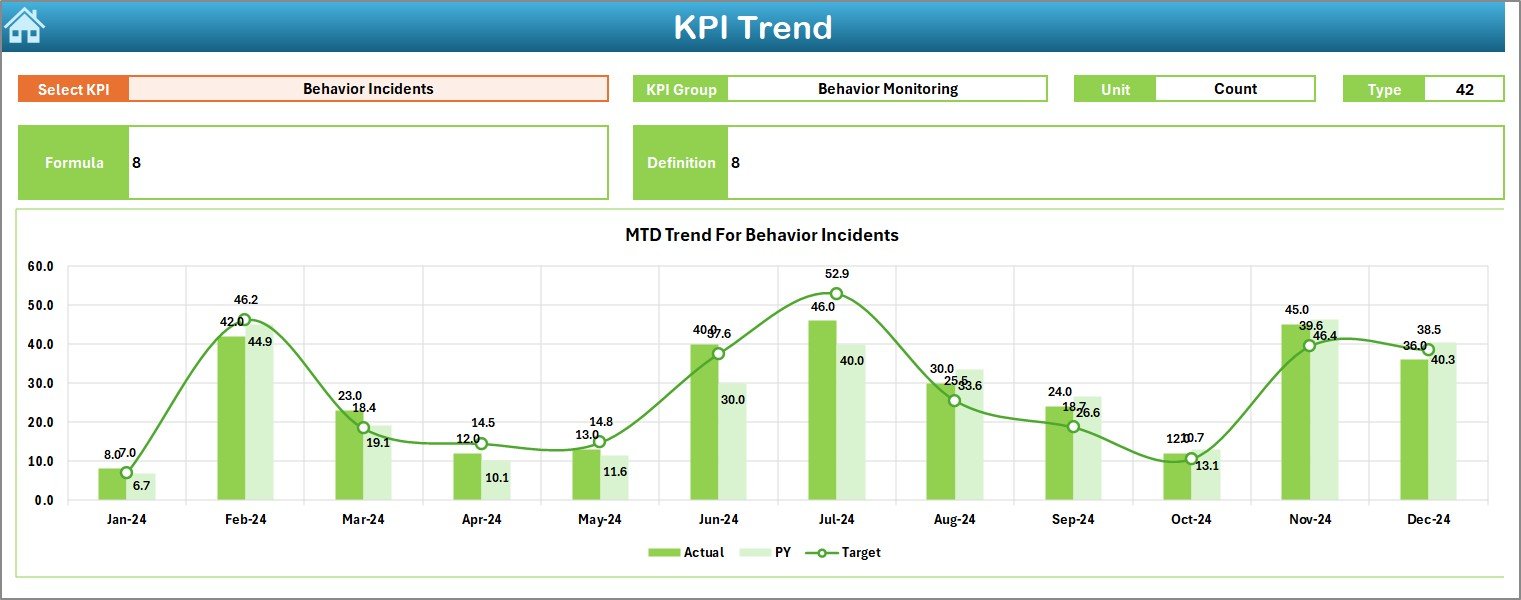
Trend Sheet – Visualizing KPI Movement Over Time
The Trend Sheet provides deeper insight into each KPI. You can select the KPI Name from a drop-down available in cell C3. Once you select it, the sheet displays:
- KPI Group
- KPI Unit
- KPI Type (LTB or UTB)
- KPI Formula
- KPI Definition
The sheet shows MTD and YTD trend charts for Actual, Target, and Previous Year. These line charts help users clearly view the pattern of improvement or decline across months.
Because trends reveal early warnings, the administration team can take preventive action quickly.
Click to buy Special Education KPI Dashboard in Excel
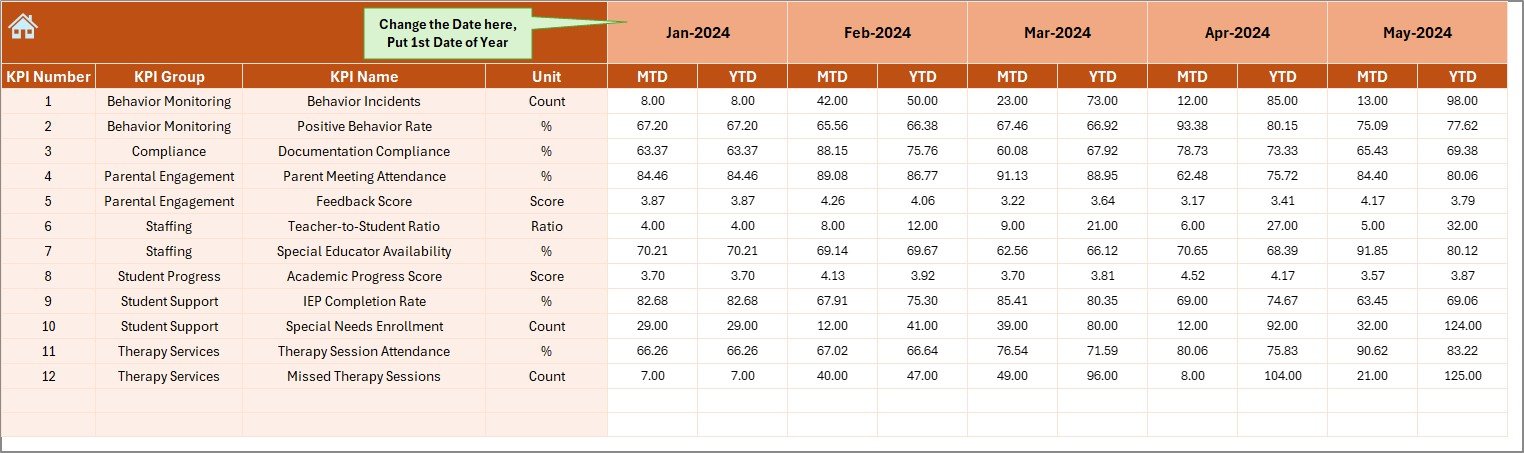
Actual Numbers Input Sheet – Enter Real Performance
This sheet is designed for entering Actual numbers for both MTD and YTD. You can change the month from cell E1, and the system automatically adjusts. The sheet requires teams to enter performance data each month so the dashboard can calculate results in real time.
This becomes useful for tracking:
- Enrollment
- Student attendance
- Exam results
- Revenue
- Complaints
- Teacher availability
Because the sheet uses raw numbers, it ensures data accuracy.
Click to buy Special Education KPI Dashboard in Excel
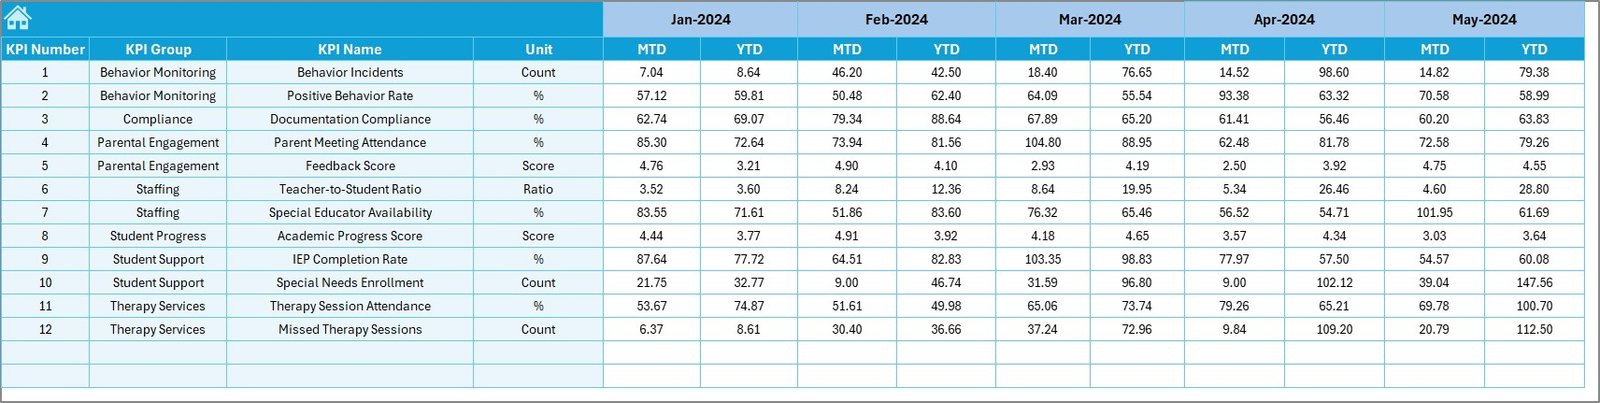
Target Sheet – Setting Monthly and Yearly Goals
In the Target Sheet, the management enters MTD and YTD targets for every KPI. Targets drive accountability and help academic teams stay focused.
The sheet assists schools in planning:
- Monthly enrollment goals
- Attendance targets
- Teacher performance standards
- Customer satisfaction score benchmarks
- Revenue targets
Because these targets appear in the dashboard automatically, progress becomes easy to measure.
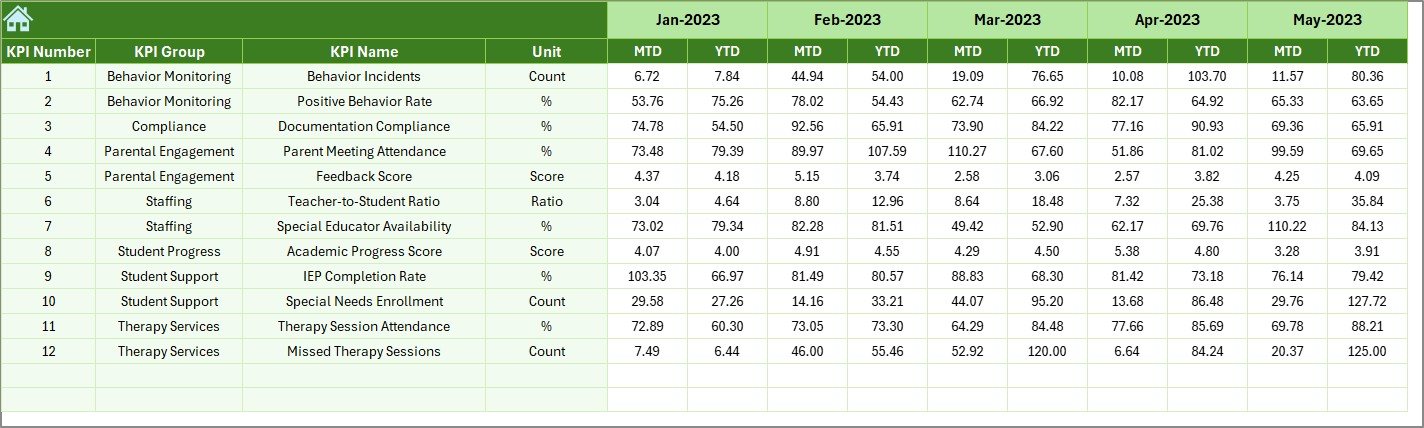
Previous Year Number Sheet – Historical Comparison
This sheet captures the Previous Year (PY) data for each KPI. You enter the values the same way you enter current year actuals. The dashboard compares both years to reveal:
- Improvement
- Decline
- Stability
These comparisons help identify long-term growth patterns and changes in performance.
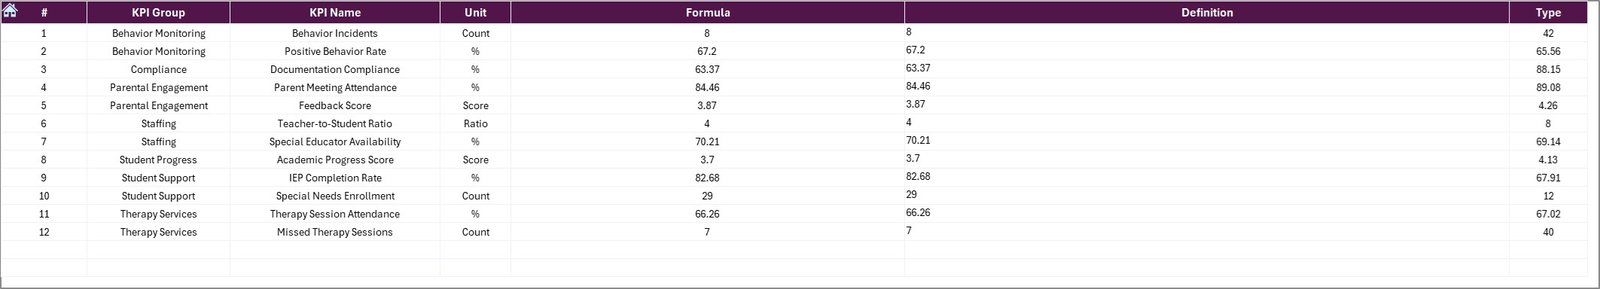
KPI Definition Sheet – Understanding Every KPI Clearly
This sheet includes:
- KPI Name
- KPI Group
- Unit
- Formula
- KPI Definition
- KPI Type (LTB or UTB)
Because definitions stay clear, every user interprets the KPIs accurately. The sheet also helps new staff members understand the dashboard quickly.
Click to buy Special Education KPI Dashboard in Excel
What KPIs Can the Language Schools Dashboard Track?
Although every school is different, here are common KPIs used in language institutes:
Academic KPIs
- Student Attendance %
- Course Completion Rate
- Exam Success Rate
- Average Test Score
- Assignment Submission Rate
Operational KPIs
- Class Utilization Rate
- Teacher Productivity
- Batch On-Time Start %
- Complaint Resolution Rate
Financial KPIs
- Monthly Revenue
- Profit Margin %
- Fee Collection Rate
- Refund Rate
Student Experience KPIs
- Student Satisfaction Score
- Feedback Response Rate
- Repeat Enrollment %
Because these KPIs provide a 360-degree view, school leaders can improve student learning outcomes and operational excellence.
How Schools Benefit from a KPI Dashboard (Advantages Explained)
A KPI Dashboard transforms raw data into actionable insights. Below are the major advantages:
- Clear Visibility of Performance
The dashboard presents all performance metrics in one place. Therefore, managers never guess where the school stands.
- Faster Decision-Making
Since the dashboard updates automatically when you select a month, it saves time and provides instant clarity.
- Better Planning and Forecasting
Schools can use MTD and YTD numbers to plan enrollment drives, schedule classes, and manage teacher assignments.
- Improved Academic Quality
Tracking student outcomes helps the school intervene early whenever academic standards decline.
- Higher Operational Efficiency
Because the dashboard highlights bottlenecks, the administration can streamline processes and reduce delays.
- Stronger Student Experience
With KPIs such as Student Satisfaction Score and Feedback Rate, schools can understand student needs and act quickly.
- Enhanced Accountability
Every team—from admissions to academics—knows their targets and performance levels.
Best Practices for Using the Language Schools KPI Dashboard in Excel
To get the best results, follow these recommended practices:
- Update Data Regularly
Enter numbers every month without fail. Accurate data ensures accurate insights.
- Set Realistic Targets
Targets must align with school capacity and resources. Unrealistic targets lead to frustration.
- Review Trends Frequently
Use the Trend Sheet to catch early signals of performance shifts.
- Train Staff to Use the Dashboard
When everyone understands KPIs clearly, results improve naturally.
- Keep KPI Definitions Consistent
Never modify KPI meanings frequently. Consistency ensures reliable tracking.
- Automate Where Possible
Use formulas, drop-downs, and conditional formatting to reduce manual work.
- Compare With Previous Year
PY analysis helps identify real growth instead of short-term spikes.
How This Dashboard Supports Decision-Making
A Language Schools KPI Dashboard plays a strategic role across various departments:
For Academic Teams
- Track learning outcomes
- Identify weak areas
- Improve teaching methods
For Management
- Understand overall performance
- Allocate resources wisely
- Plan new programs
For Finance Teams
- Track fees and revenue
- Monitor budgets
- Improve financial forecasting
For Student Support Teams
- Improve service quality
- Respond faster to complaints
- Increase student satisfaction
Because every department receives useful insights, the school delivers a stronger educational experience.
Conclusion
A Language Schools KPI Dashboard in Excel brings structure, clarity, and performance improvement to any language institute. It simplifies the tracking process, enhances planning, and strengthens decision-making. With automated comparisons, trend charts, KPI definitions, and monthly performance analysis, schools can run operations efficiently and maintain consistent academic quality.
When used correctly, this dashboard becomes a powerful management tool that helps language schools grow, evolve, and deliver outstanding learning experiences.
Frequently Asked Questions (FAQs)
- What is a KPI Dashboard for Language Schools?
It is an Excel-based performance tracking system that helps schools measure academic, operational, and financial KPIs in one place.
- Who should use this dashboard?
Administrators, academic coordinators, financial teams, and management use this dashboard to track and improve school performance.
- Can I customize the KPIs?
Yes. You can modify KPIs, targets, and definitions in the KPI Definition sheet.
- Does the dashboard work without Excel expertise?
Yes. The dashboard is user-friendly, and most actions involve simple drop-downs and data entry.
- How often should I update the dashboard?
Update it monthly to maintain accurate performance records.
- Can I add more KPIs?
Yes. You can expand the KPI list based on school requirements.
- Why is Previous Year data important?
It helps analyze long-term growth and understand performance improvements or declines.
Visit our YouTube channel to learn step-by-step video tutorials
Watch the step-by-step video tutorial:
Click to buy Special Education KPI Dashboard in Excel