Seed and fertilizer manufacturing industries face constant pressure to improve productivity, reduce defects, optimize costs, and maintain high product quality. When operational data stays scattered across spreadsheets, emails, and manual logs, managers struggle to make timely decisions. A Seed & Fertilizer Manufacturing KPI Dashboard in Excel brings clarity, speed, and transparency to the entire workflow. It transforms raw data into meaningful insights that help teams track performance, identify gaps, and improve results.
This article explains everything about the dashboard—from how it works, why it is important, the key features, advantages, best practices, and FAQs. Whether you manage production, procurement, packaging, or quality control, this dashboard gives you a powerful way to stay in control.
Click to buy Seed & Fertilizer Manufacturing KPI Dashboard in Excel
What Is a Seed & Fertilizer Manufacturing KPI Dashboard in Excel?
A Seed & Fertilizer Manufacturing KPI Dashboard in Excel is a ready-to-use analytical tool that helps manufacturers monitor all key performance indicators related to seed processing and fertilizer production. It provides instant visibility of monthly and yearly performance, operational efficiency, inventory health, quality control, and cost trends.
The dashboard includes automated charts, trend analysis, conditional formatting, drop-down selectors, and structured sheets where users can input actuals, targets, and previous-year numbers. Because the dashboard uses Excel, teams can update data easily without any technical knowledge.
Why Do Seed & Fertilizer Manufacturers Need a KPI Dashboard?
Seed and fertilizer factories work in a fast-moving environment. Every batch impacts inventory, sales, logistics, and customer satisfaction. Without proper tracking, managers face:
- Unclear insights about production efficiency
- Delays in shipment or packaging
- Difficulty measuring quality performance
- Inaccurate forecasting because of missing historical data
- Manual mistakes due to handling multiple spreadsheets
A KPI dashboard solves all these issues. It connects all performance metrics in one place and updates the results instantly when users change data.
Key Features of the Seed & Fertilizer Manufacturing KPI Dashboard in Excel
This dashboard includes 7 powerful worksheets that help track KPIs from every angle. Below is a detailed explanation of each:
Summary Page — Quick Navigation for All Users
The Summary Page acts as the index sheet.
It includes six pre-built buttons that allow users to jump to any major worksheet instantly. This makes navigation simple and keeps the dashboard user-friendly for all departments, including operations, quality, sourcing, and production teams.

Click to buy Seed & Fertilizer Manufacturing KPI Dashboard in Excel
Dashboard Sheet — Complete KPI Overview
This is the main insights page of the entire tool.
Key highlights:
- Month selector on cell D3
- Automatic update of all charts and numbers when you change the month
- MTD (Month-to-Date) Actual vs Target vs Previous Year
- YTD (Year-to-Date) Actual vs Target vs Previous Year
- Conditional formatting with up and down arrows
- Clean visuals for faster decision-making
What this page helps you track
- Production efficiency
- Batch yield rates
- Fertilizer blending accuracy
- Raw material consumption
- Rework or wastage level
- Packaging output
- Sales and dispatch performance
Managers can identify performance gaps and react quickly because numbers refresh the moment the month changes.

Click to buy Seed & Fertilizer Manufacturing KPI Dashboard in Excel
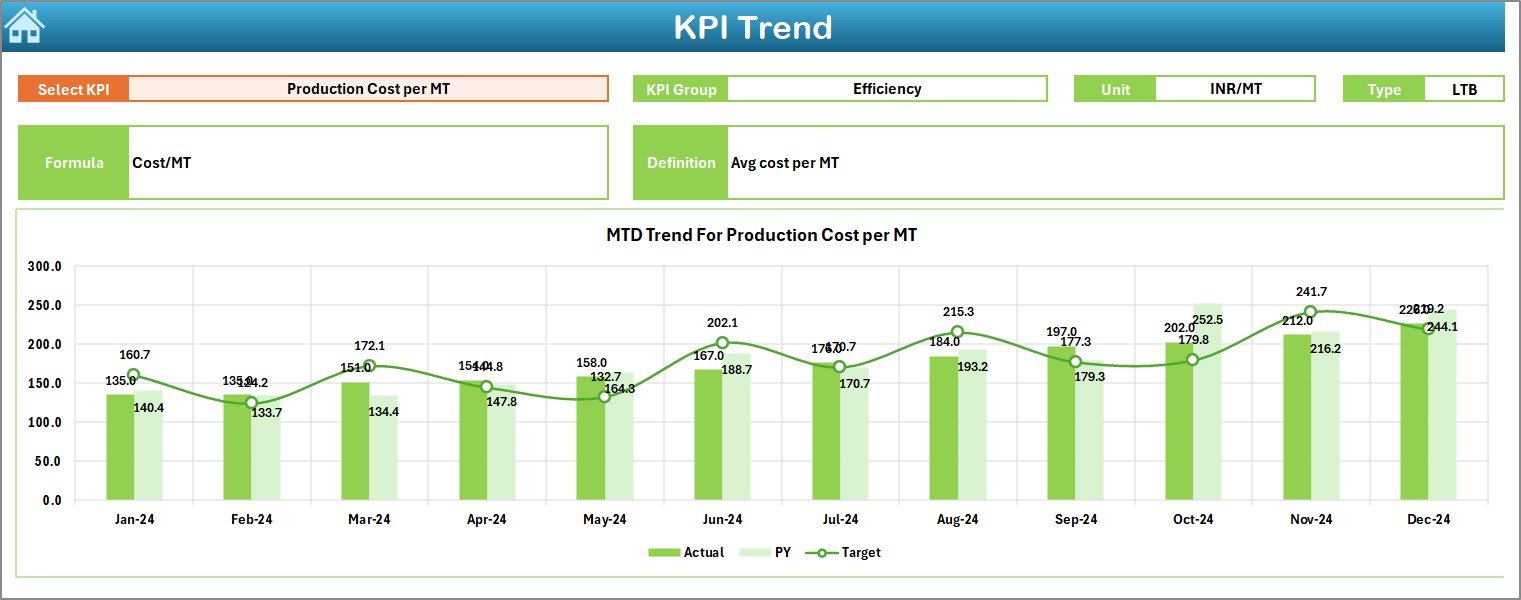
Trend Sheet — Visual Trends for Every KPI
The Trend Sheet shows the long-term movement of each KPI.
Main features include:
- KPI selector on cell C3
- Display of KPI Group, Unit, KPI Type (UTB/UTB), Formula, and Definition
- Charts showing MTD and YTD trends
- Line graphs for Actual, Target, and PY (Previous Year) numbers
Because trends help managers understand seasonal patterns, this sheet supports better forecasting and planning.
Click to buy Seed & Fertilizer Manufacturing KPI Dashboard in Excel
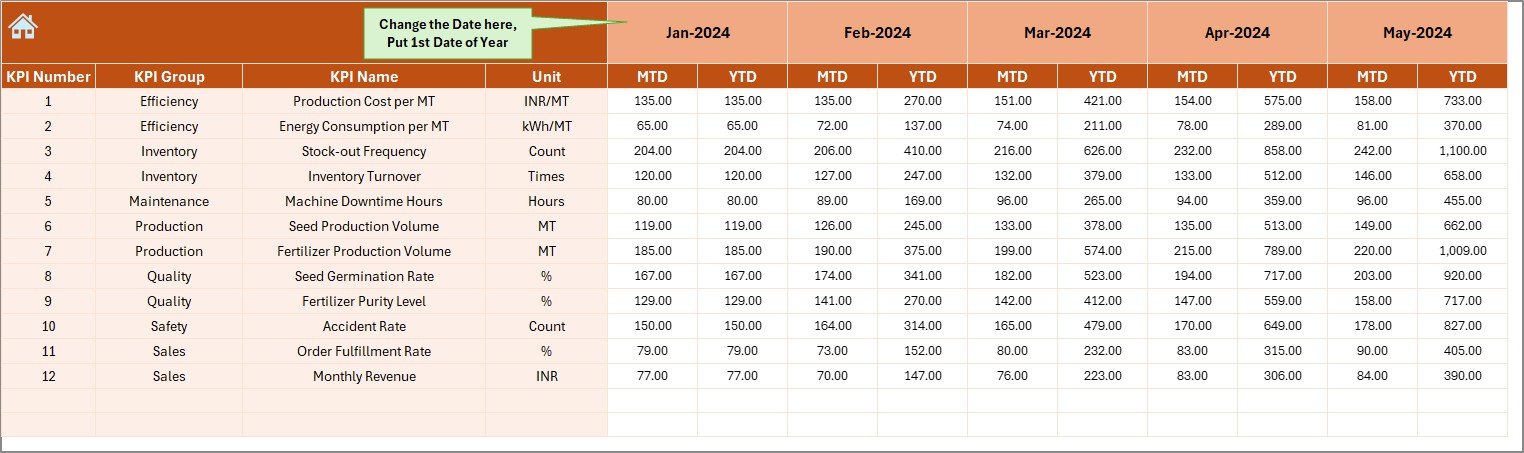
Actual Numbers Input Sheet — Enter Monthly Data Easily
This sheet allows users to input actual data for every KPI.
Features:
- Month selector on cell E1
- Input of both MTD and YTD numbers
- Organized structure for smooth monthly data entry
Users only need to change the first month of the financial year once, and the whole dashboard adjusts accordingly.
Click to buy Seed & Fertilizer Manufacturing KPI Dashboard in Excel
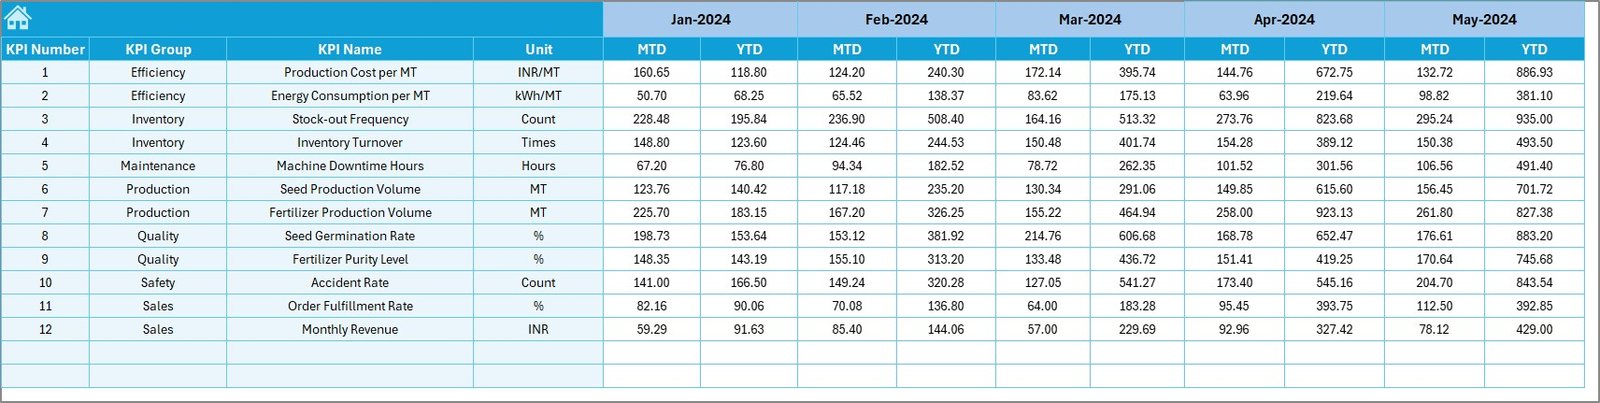
Target Sheet — Enter Monthly Target Values
This worksheet holds the expected performance numbers.
For every KPI, users can enter:
- Monthly Target (MTD)
- Yearly Target (YTD)
Managers use these targets to compare actuals and identify improvement opportunities.
Click to buy Seed & Fertilizer Manufacturing KPI Dashboard in Excel
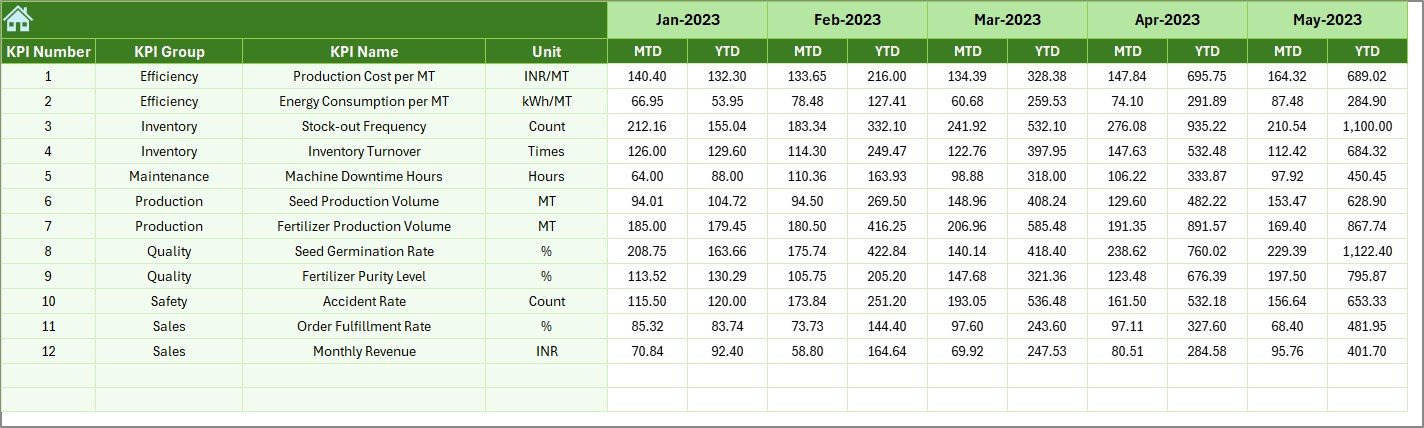
Previous Year Numbers Sheet — Compare Performance Across Years
This sheet helps users input last year’s data, which is essential for analysing growth and improvement.
Once entered, the dashboard automatically calculates:
- PY vs Actual
- PY vs Target
- Year-over-year performance changes
Click to buy Seed & Fertilizer Manufacturing KPI Dashboard in Excel
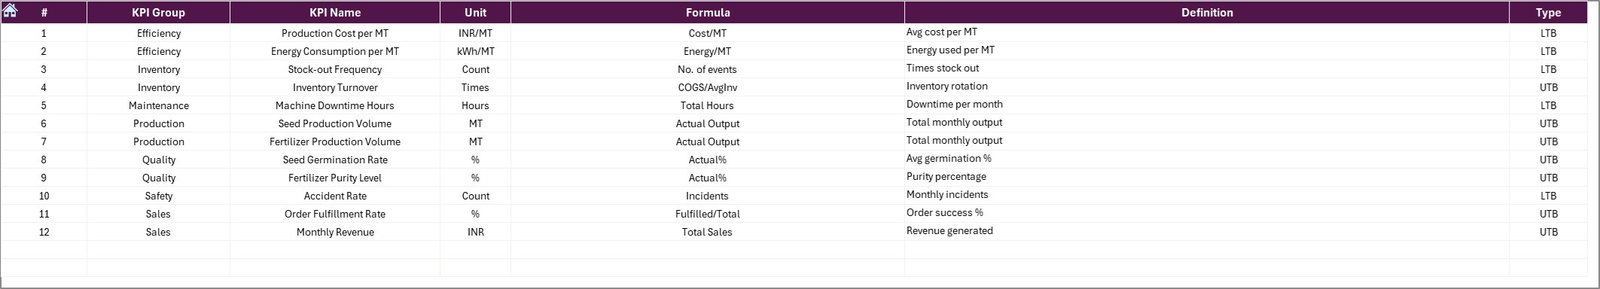
KPI Definition Sheet — Maintain KPI Metadata
This sheet holds the core structure of every KPI.
Users can enter:
- KPI Name
- KPI Group
- Unit
- Formula
- KPI Definition
This ensures clarity, standardization, and consistency across departments.
How Does This Dashboard Improve Manufacturing Performance?
The dashboard helps all stakeholders—from plant heads to line supervisors—make quick and accurate decisions. Here’s how:
- Real-time visibility helps teams respond to issues immediately
- Consistent comparison between Actual, Target, and Previous Year improves planning
- Trend charts highlight inefficiencies early
- Clear KPI definitions reduce confusion
- Organized sheets prevent data errors
- Automated visuals save hours of manual work
When teams see all KPIs clearly, they deliver better results.
Advantages of the Seed & Fertilizer Manufacturing KPI Dashboard in Excel
Below are the major benefits of using this dashboard:
- Improves Operational Efficiency
The dashboard highlights gaps in production, packaging, and supply chain processes. Supervisors take quicker action when issues appear on the dashboard.
- Helps Track Production Accuracy
Seed grading, fertilizer blending, and batch mixing require precision. The dashboard tracks performance month by month and keeps teams aligned with targets.
- Reduces Wastage and Rework
When Actual vs Target shows a negative trend, managers can identify the cause and take corrective action.
- Enhances Quality Control
Quality KPIs such as germination rate, impurity percentage, moisture content, and product consistency become easy to track and improve.
- Supports Long-Term Planning
Trend charts allow leaders to understand seasonal demand, production cycles, and batch behavior. This supports better forecasting.
- Gives a Single Source of Truth
The dashboard centralizes all KPIs so that every team works with the same numbers.
- Helps Management Reduce Costs
When teams identify inefficiencies quickly, cost savings happen naturally. Managers gain control over production, packaging, raw material, and manpower costs.
What KPIs Can You Track in Seed & Fertilizer Manufacturing?
Here are some commonly used KPIs:
Seed Production KPIs
- Germination Rate
- Seed Purity %
- Production Yield %
- Batch Cycle Time
- Moisture Content Level
- Weight Accuracy %
Fertilizer Manufacturing KPIs
- Granule Size Consistency
- Chemical Mixing Accuracy
- Production Output (MTD/YTD)
- Wastage Percentage
- Rework Hours
- Packaging Efficiency
Quality KPIs
- Defect Rate
- Batch Rejection Rate
- Customer Complaint Count
- On-Time Dispatch %
These KPIs help management control quality, productivity, and customer satisfaction.
How This Dashboard Supports Decision-Making
Decision-making becomes faster because:
- All KPIs stay visible on a single screen
- Managers compare Actual, Target, and Last Year easily
- The trend sheet shows improvement and decline areas
- Data entry sheets remove confusion
- Monthly selector helps teams view each period clearly
This gives a clear path toward better production planning and improved profitability.
Best Practices for Using the Seed & Fertilizer Manufacturing KPI Dashboard in Excel
To get maximum value from this dashboard, follow these best practices:
- Update Actual Numbers Regularly
Enter accurate numbers after every month so trends remain correct.
- Set Clear Targets for Every KPI
Use realistic targets for both MTD and YTD. This helps track performance effectively.
- Review Dashboard at Least Once a Month
Encourage plant managers and team leaders to check the dashboard during their monthly review meetings.
- Use Trend Sheet for Forecasting
Analyze seasonal patterns before planning production volumes and raw material procurement.
- Keep KPI Definitions Clear
Ensure KPI definitions remain simple, measurable, and easy to understand.
- Maintain Data Consistency
Double-check values while entering actuals, targets, and previous-year numbers to avoid incorrect insights.
- Train Teams to Use Navigation Buttons
The Summary Page buttons guide users through sheets easily. Teach new users how to navigate the dashboard.
Conclusion
A Seed & Fertilizer Manufacturing KPI Dashboard in Excel gives manufacturers a complete picture of their operational performance. It transforms raw data into powerful insights that help teams track monthly and yearly output, manage wastage, monitor quality, and improve profitability. With clear KPI definitions, automated visuals, trend charts, and structured sheets, this dashboard becomes the perfect tool for every manufacturing plant.
When managers see accurate numbers at the right time, decision-making becomes faster and more effective. This dashboard supports continuous improvement and creates a strong foundation for high-quality seed and fertilizer production.
Frequently Asked Questions (FAQs)
- What is a KPI dashboard in seed and fertilizer manufacturing?
A KPI dashboard is a visual tool that tracks production, quality, efficiency, wastage, and performance metrics in one place. It helps managers understand gaps and take action quickly.
- Why should manufacturers use an Excel-based dashboard?
Excel dashboards are easy to use, customizable, and require no advanced technical skills. Teams can update numbers manually and view automatic insights.
- What KPIs should companies track in seed and fertilizer production?
Common KPIs include germination rate, purity %, production yield, mixing accuracy, wastage %, packaging efficiency, and defect rate.
- Can this dashboard help with forecasting?
Yes. The trend sheet shows seasonal patterns and historical improvements, which support better forecasting.
- How often should teams update the dashboard?
Update MTD and YTD numbers every month to keep the insights accurate.
- Do I need advanced Excel skills to use the dashboard?
No. The dashboard uses simple drop-downs, charts, and input sheets. Anyone with basic Excel knowledge can use it.
- Can I add more KPIs?
Yes, you can add more KPIs in the KPI Definition sheet. The dashboard will adjust based on the structure.
- Does the dashboard support previous-year comparison?
Yes. The Previous Year sheet supports year-over-year comparisons for better analysis.
- Is this dashboard suitable for all manufacturing plants?
Yes. Any seed or fertilizer production setup can use this dashboard to improve performance.
- Can multiple departments use the same dashboard?
Yes. Production, quality, operations, and management teams can all access and benefit from the same centralized view.
Visit our YouTube channel to learn step-by-step video tutorials
Watch the step-by-step video tutorial:
Click to buy Seed & Fertilizer Manufacturing KPI Dashboard in Excel