Water resource management plays a critical role in sustainability, operational efficiency, and regulatory compliance. However, many organizations still track water usage, losses, efficiency, and targets using scattered Excel files or static reports. As a result, decision-makers struggle to identify inefficiencies, compare performance, and take timely corrective actions.
That is exactly where a Water Resource Management KPI Dashboard in Power BI delivers tremendous value.
A Water Resource Management KPI Dashboard in Power BI is a centralized, interactive, and data-driven solution that helps organizations monitor, analyze, and improve water-related performance metrics from a single, visually rich dashboard. Moreover, it transforms raw data into meaningful insights that support smarter and faster decisions.
In this detailed guide, you will learn what this dashboard is, how it works, why it matters, its page-wise structure, advantages, best practices, and frequently asked questions. Additionally, the language stays simple, clear, and practical so that both technical and non-technical users can benefit from it.
Click to buy Water Resource Management KPI Dashboard in Power BI
What Is a Water Resource Management KPI Dashboard in Power BI?
A Water Resource Management KPI Dashboard in Power BI is a ready-to-use analytical dashboard designed to track key performance indicators related to water usage, efficiency, losses, targets, and trends.
Instead of reviewing multiple spreadsheets, this dashboard consolidates all critical KPIs into one structured Power BI report. Therefore, users gain complete visibility into Month-to-Date (MTD), Year-to-Date (YTD), Target vs Actual, and Previous Year comparisons.
Moreover, because the dashboard uses Excel as its data source, organizations can easily maintain and update data without complex integrations.
Why Do Organizations Need a Water Resource Management KPI Dashboard?
Water scarcity, rising costs, and environmental regulations force organizations to manage water more efficiently than ever. However, manual tracking creates delays and errors.
A Water Resource Management KPI Dashboard helps because it:
- Improves visibility across all water KPIs
- Identifies inefficiencies and leakages early
- Tracks performance against targets
- Supports sustainability initiatives
- Enables data-driven decision-making
As a result, organizations reduce waste, control costs, and improve compliance.
How Does a Water Resource Management KPI Dashboard in Power BI Work?
This dashboard works by combining Excel-based data input with Power BI visualization and analytics.
Data Flow Explained
- Users enter actual, target, and KPI definition data into Excel
- Power BI connects directly to the Excel file
- The dashboard automatically updates visuals and calculations
- Users analyze KPIs using slicers, charts, and tables
Because of this approach, teams avoid complex databases and still enjoy powerful analytics.
What Are the Key Pages in the Water Resource Management KPI Dashboard?
This dashboard includes three structured pages, each serving a specific analytical purpose.
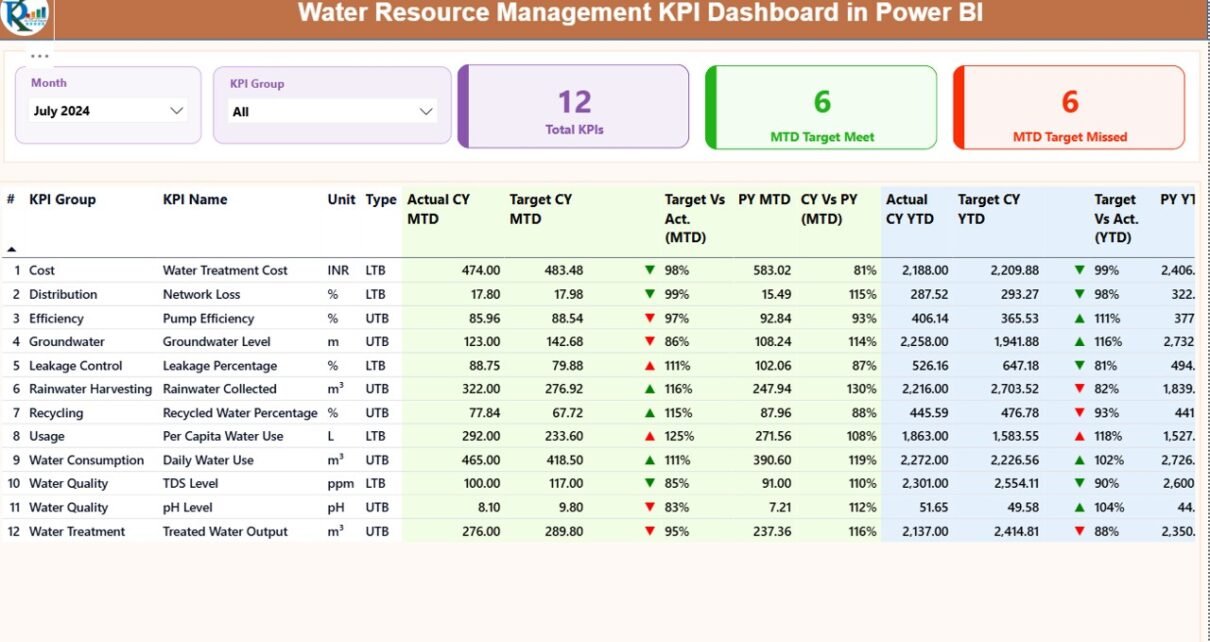
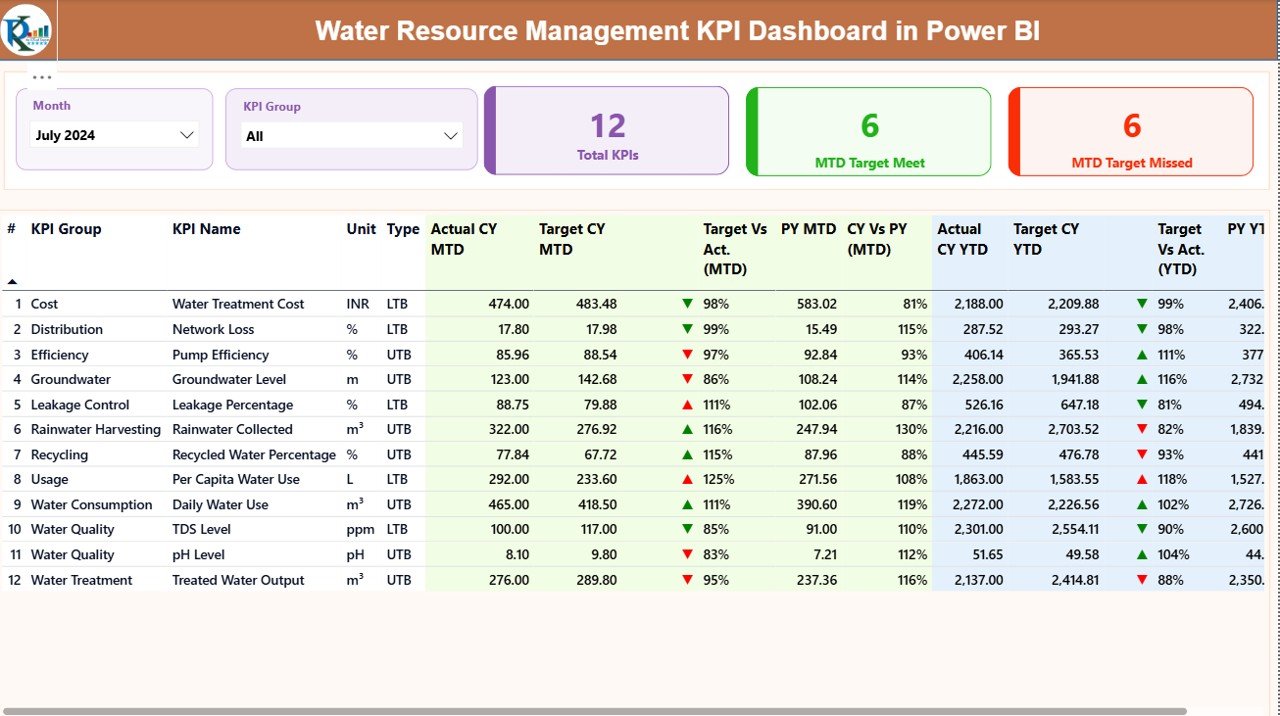
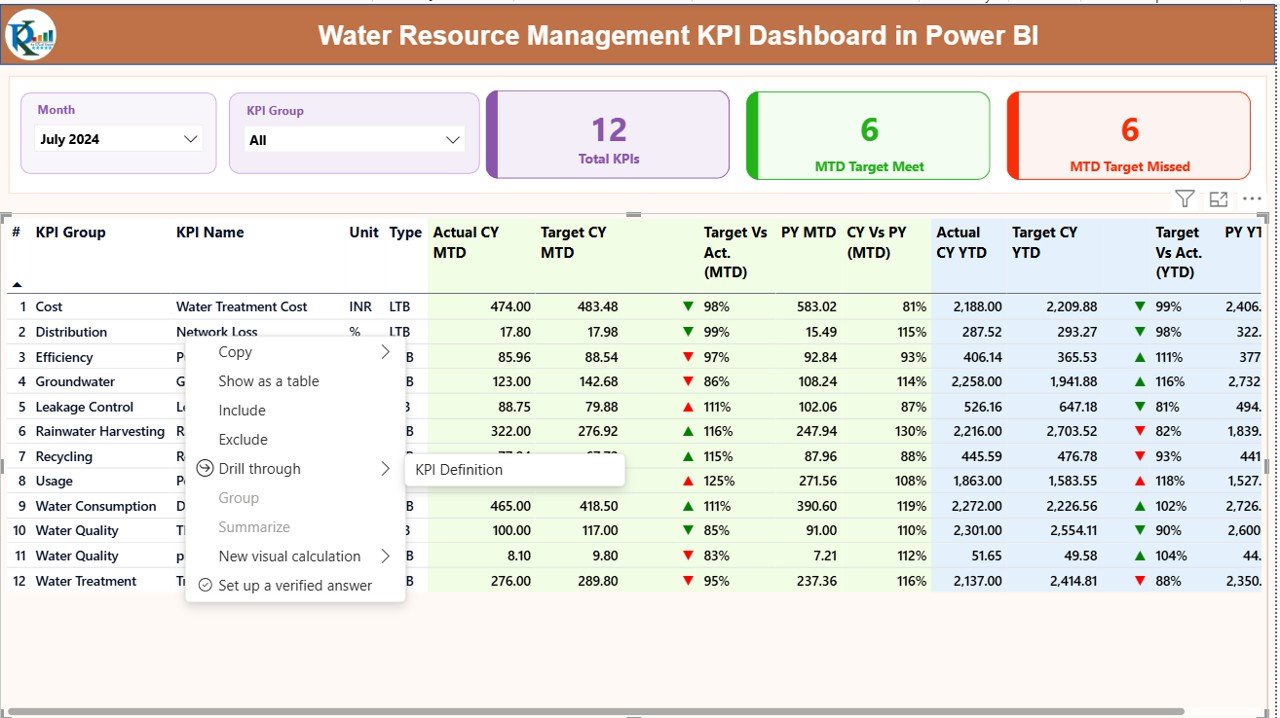
the Summary Page
The Summary Page acts as the central control panel of the dashboard.
Top-Level Slicers
- Month Slicer: Allows users to select a specific month
- KPI Group Slicer: Filters KPIs by category
KPI Cards
At the top, three cards instantly show:
- Total KPIs Count
- MTD Target Met Count
- MTD Target Missed Count
These cards provide an immediate snapshot of overall performance.
Detailed KPI Table
Below the cards, a detailed table displays all KPI-related metrics:
- KPI Number – Sequential KPI ID
- KPI Group – Category of KPI
- KPI Name – Name of the performance metric
- Unit – Unit of measurement
- Type – LTB (Lower the Better) or UTB (Upper the Better)
MTD Performance Metrics
- Actual CY MTD
- Target CY MTD
- MTD Icon (▲ / ▼) with green and red indicators
- Target vs Actual (MTD) = Actual ÷ Target
- PY MTD
- CY vs PY (MTD) = CY ÷ PY
YTD Performance Metrics
- Actual CY YTD
- Target CY YTD
- YTD Icon (▲ / ▼)
- Target vs Actual (YTD)
- PY YTD
- CY vs PY (YTD)
Because of this layout, users can compare current performance with targets and historical trends instantly.
Click to buy Water Resource Management KPI Dashboard in Power BI
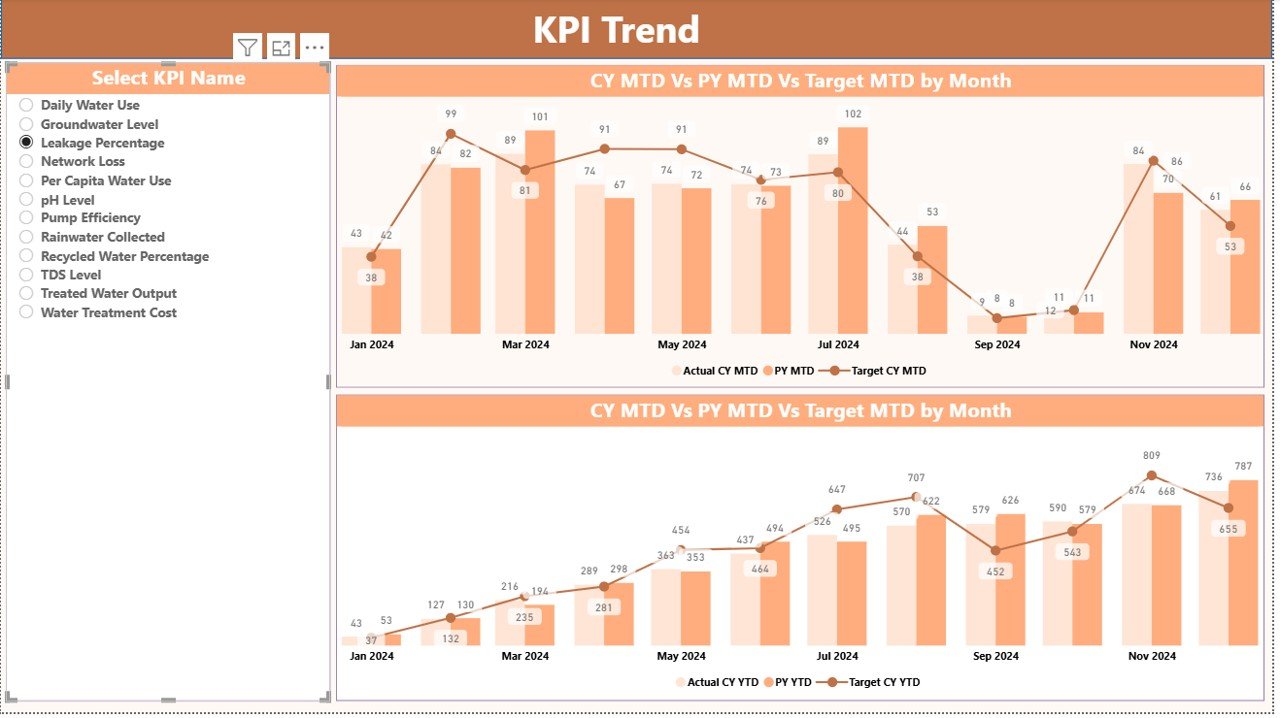
the KPI Trend Page
The KPI Trend Page focuses on performance trends over time.
Key Features
Two combo charts showing:
Current Year Actual
Previous Year Actual
Targets
Separate views for MTD and YTD
KPI Name slicer on the left for easy selection
As a result, users can visually analyze how each KPI performs month after month and year after year.
Click to buy Water Resource Management KPI Dashboard in Power BI
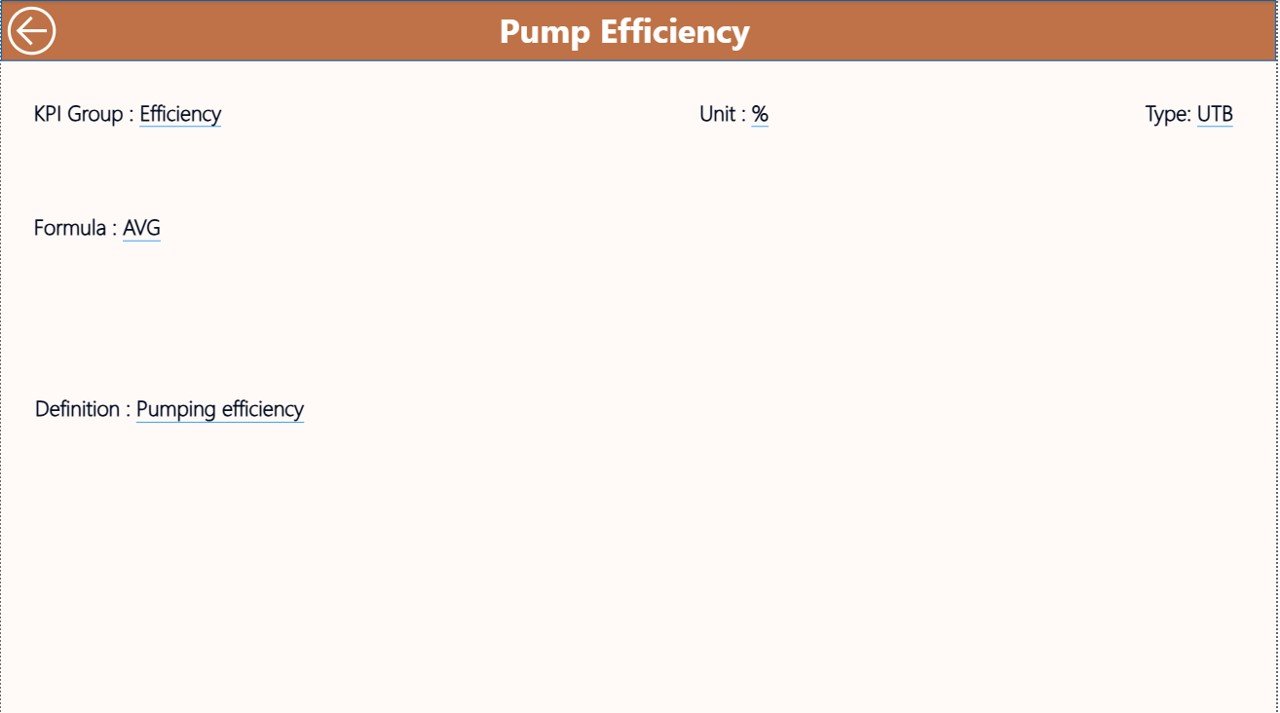
KPI Definition Page
The KPI Definition Page serves as a reference and drill-through page.
Purpose of This Page
- Displays KPI Formula
- Explains KPI Definition
- Clarifies KPI Type (LTB or UTB)
This page remains hidden and appears only when users drill through from the Summary Page. Moreover, a Back button allows users to return easily.
Click to buy Water Resource Management KPI Dashboard in Power BI
Managed Using Excel in This Dashboard?
The dashboard uses an Excel file with three structured worksheets, which makes data entry simple and controlled.
Input_Actual Sheet
In this sheet, users enter:
- KPI Name
- Month (use first date of the month)
- MTD Actual Value
- YTD Actual Value
This sheet captures real performance data.
Input_Target Sheet
Here, users enter:
- KPI Name
- Month
- MTD Target Value
- YTD Target Value
This sheet defines performance expectations.
Click to buy Water Resource Management KPI Dashboard in Power BI
KPI Definition Sheet
This sheet includes:
- KPI Number
- KPI Group
- KPI Name
- Unit
- Formula
- Definition
- Type (LTB or UTB)
Because of this structure, Power BI calculates all metrics accurately.
What KPIs Can Be Tracked in a Water Resource Management Dashboard?
Although KPIs vary by organization, common examples include:
- Total Water Consumption
- Water Loss Percentage
- Leakage Rate
- Recycled Water Usage
- Water Cost per Unit
- Compliance Rate
- Treatment Efficiency
- Consumption per Department
- Sustainability Index
Therefore, organizations can customize KPIs based on operational needs.
Advantages of Water Resource Management KPI Dashboard in Power BI
A Water Resource Management KPI Dashboard offers multiple strategic and operational advantages.
Centralized Monitoring
- Tracks all water KPIs in one place
- Eliminates scattered spreadsheets
Real-Time Performance Visibility
- Instantly identifies target misses
- Highlights trends using visuals
Improved Decision-Making
- Supports proactive interventions
- Reduces water waste and losses
Easy Customization
- Uses Excel as a data source
- Allows quick KPI additions or changes
Cost and Time Savings
- Reduces manual reporting effort
- Saves time spent on data consolidation
Enhanced Accountability
- Tracks MTD and YTD performance clearly
- Encourages ownership of KPIs
Who Should Use a Water Resource Management KPI Dashboard?
This dashboard benefits multiple stakeholders, including:
- Water Utilities
- Municipal Corporations
- Manufacturing Plants
- Industrial Facilities
- Sustainability Teams
- Facility Managers
- Environmental Compliance Officers
- Leadership and Decision-Makers
Therefore, any organization managing water resources can use it effectively.
Best Practices for the Water Resource Management KPI Dashboard
To get maximum value, follow these proven best practices.
Define KPIs Clearly
- Use meaningful and measurable KPIs
- Avoid vague metrics
Maintain Clean Data
- Validate data before entry
- Use consistent units and formats
Update Data Regularly
- Enter data monthly without delay
- Review anomalies immediately
Use KPI Groups Wisely
- Categorize KPIs logically
- Improve analysis clarity
Review Trends, Not Just Numbers
- Focus on trend charts
- Identify recurring patterns early
Train Users Properly
- Explain slicers and drill-through
- Encourage data-driven discussions
How Does This Dashboard Support Sustainability Goals?
Water sustainability requires continuous monitoring and improvement. This dashboard supports sustainability by:
- Tracking water efficiency KPIs
- Highlighting wastage and losses
- Monitoring recycling and reuse
- Supporting compliance reporting
- Encouraging accountability
As a result, organizations align operations with environmental goals.
How Is This Dashboard Different from Traditional Reports?
Traditional reports remain static and time-consuming. In contrast, this dashboard:
- Updates dynamically
- Offers interactive filters
- Displays visuals instead of plain tables
- Supports drill-down analysis
- Reduces reporting time significantly
Therefore, Power BI dashboards outperform traditional reporting methods.
Conclusion: Why Invest in a Water Resource Management KPI Dashboard in Power BI?
Effective water management demands visibility, accuracy, and timely insights. A Water Resource Management KPI Dashboard in Power BI delivers all three in a single, user-friendly solution.
By combining Excel-based data input with Power BI’s analytical power, this dashboard simplifies monitoring, improves accountability, and drives better decisions. Moreover, it supports sustainability initiatives while reducing operational inefficiencies.
If your organization aims to manage water resources smarter, faster, and more efficiently, this dashboard becomes an essential performance management tool.
Frequently Asked Questions (FAQs)
What is a Water Resource Management KPI Dashboard in Power BI?
It is an interactive Power BI dashboard that tracks water-related KPIs using Excel-based data.
Do I need advanced Power BI skills to use this dashboard?
No, basic Power BI knowledge and simple Excel data entry are enough.
Can I customize KPIs in the dashboard?
Yes, you can easily add or modify KPIs using the Excel KPI Definition sheet.
How often should I update the data?
You should update the data monthly to maintain accuracy.
Does the dashboard support MTD and YTD analysis?
Yes, it provides both MTD and YTD metrics with target and previous year comparisons.
Can this dashboard support sustainability reporting?
Yes, it helps track efficiency, losses, and compliance metrics effectively.
Is Excel mandatory as a data source?
This version uses Excel for simplicity, although it can connect to other sources if required.
Visit our YouTube channel to learn step-by-step video tutorials
Watch the step-by-step video tutorial:
Click to buy Water Resource Management KPI Dashboard in Power BI