Managing finance and accounting data often feels overwhelming. Revenue, expenses, assets, liabilities, taxes, invoices, and trends keep changing every month. However, when data stays scattered across multiple files, decision-making becomes slow and risky. That is exactly where a Finance and Accounting Dashboard in Excel makes a real difference.
In this in-depth article, you will clearly understand what a Finance and Accounting Dashboard in Excel is, why businesses need it, how it works, its sheet-wise structure, key metrics, advantages, best practices, and frequently asked questions. Moreover, this guide uses simple language, strong transitions, and practical explanations so that anyone can follow it easily.
Click to buy Finance and Accounting Dashboard in Excel
What Is a Finance and Accounting Dashboard in Excel?
A Finance and Accounting Dashboard in Excel is a centralized, ready-to-use analytical template that tracks and visualizes key financial metrics in one place.
Instead of reviewing raw numbers in multiple spreadsheets, this dashboard converts financial data into clear summaries, charts, KPIs, and comparisons. As a result, finance teams gain instant visibility into financial health and performance.
Because the dashboard runs entirely in Excel, it stays cost-effective, flexible, and familiar. Moreover, users can update data quickly without relying on complex BI tools.
Why Do Businesses Need a Finance and Accounting Dashboard in Excel?
Every organization needs accurate and timely financial insights. However, manual reporting often creates delays and errors. Therefore, businesses increasingly rely on dashboards for faster insights.
A Finance and Accounting Dashboard in Excel helps because it:
- Centralizes financial data in one file
- Improves visibility into revenue, expenses, and cash flow
- Tracks invoices, taxes, assets, and liabilities effectively
- Supports faster and more confident decision-making
- Reduces dependency on manual calculations
As a result, finance leaders stay in control and respond quickly to changes.
Who Should Use a Finance and Accounting Dashboard in Excel?
This dashboard fits a wide range of users. In fact, anyone dealing with financial data can benefit.
- Finance Managers and Controllers
- Accounting Teams
- CFOs and Business Owners
- Auditors and Consultants
- Small and Medium Business Owners
Because Excel remains widely used, teams adopt this dashboard quickly without additional training.
How Does a Finance and Accounting Dashboard in Excel Work?
The dashboard works on a simple but powerful logic.
- You enter or import financial data into predefined input sheets.
- Excel formulas, pivot tables, and charts process the data.
- The dashboard displays KPIs, summaries, and trends automatically.
- You analyze performance using filters like department, region, or month.
Therefore, you save time while improving accuracy and clarity.
What Sheets Are Included in the Finance and Accounting Dashboard in Excel?
This ready-to-use dashboard includes multiple well-structured sheet tabs. Each tab focuses on a specific financial area, which improves clarity and usability.
Overview Sheet
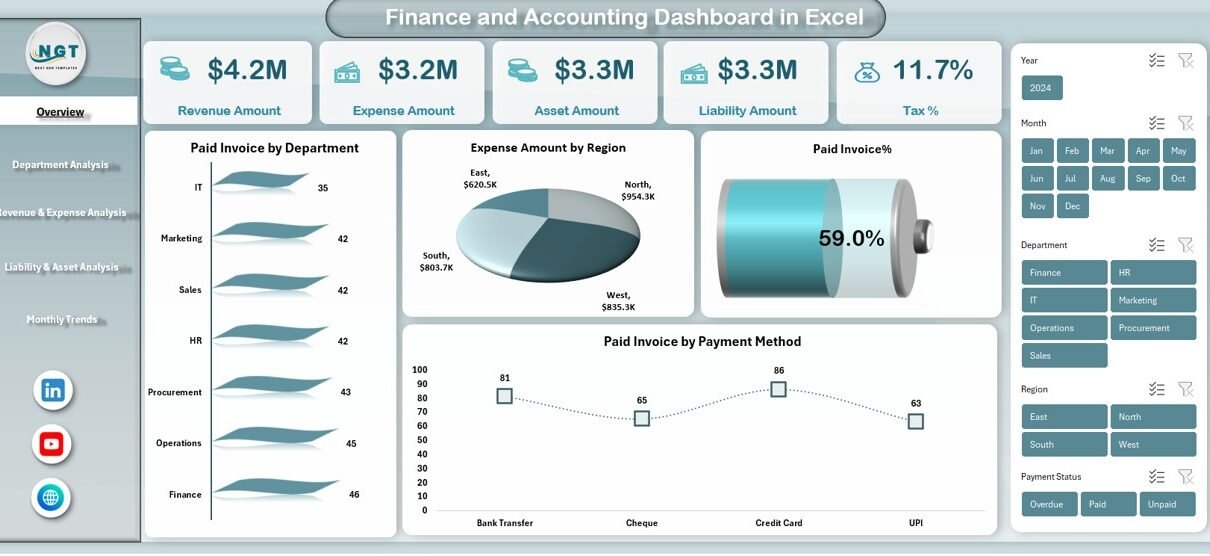
The Overview Sheet acts as the main control panel of the dashboard. It provides a quick snapshot of overall financial performance.
Key Metrics in the Overview Sheet
- Revenue Amount
Shows total revenue generated for the selected period. - Expense Amount
Displays total expenses incurred, helping control costs. - Asset Amount
Highlights the total value of assets owned by the organization. - Liability Amount
Reflects outstanding obligations and financial commitments. - Tax %
Shows the effective tax percentage for quick compliance tracking.
Visual Analysis in the Overview Sheet
- Paid Invoice by Department
Helps compare invoice payments across departments. - Expense Amount by Region
Reveals regional cost distribution. - Paid Invoice by Payment Method
Shows how customers pay invoices, such as cash, bank transfer, or card. - Paid Invoice Status
Summarizes paid invoices for better cash flow visibility.
As a result, decision-makers get instant insights without deep analysis.

Click to buy Finance and Accounting Dashboard in Excel
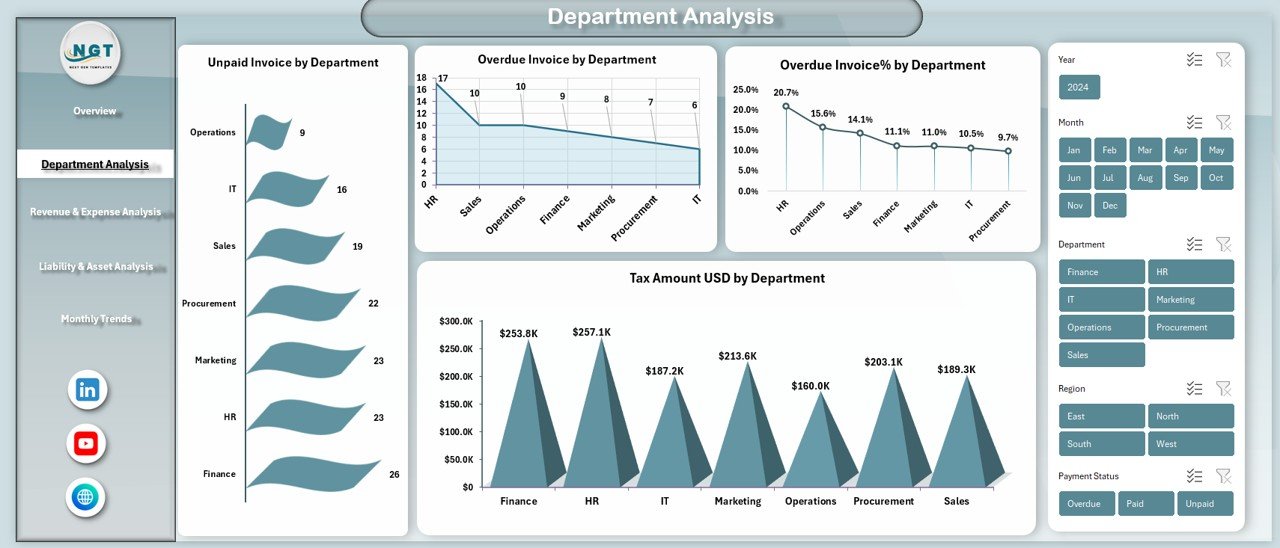
Department Analysis Sheet
The Department Analysis sheet focuses on department-wise financial performance. Therefore, it helps managers identify strengths and issues quickly.
Key Metrics in Department Analysis
- Unpaid Invoice by Department
Highlights pending receivables by department. - Tax Amount (USD) by Department
Shows tax contribution and compliance per department. - Overdue Invoice by Department
Identifies delayed payments that need follow-up. - Overdue Invoice % by Department
Measures overdue risk as a percentage for better prioritization.
Because of this structure, teams can take corrective action faster.
Click to buy Finance and Accounting Dashboard in Excel
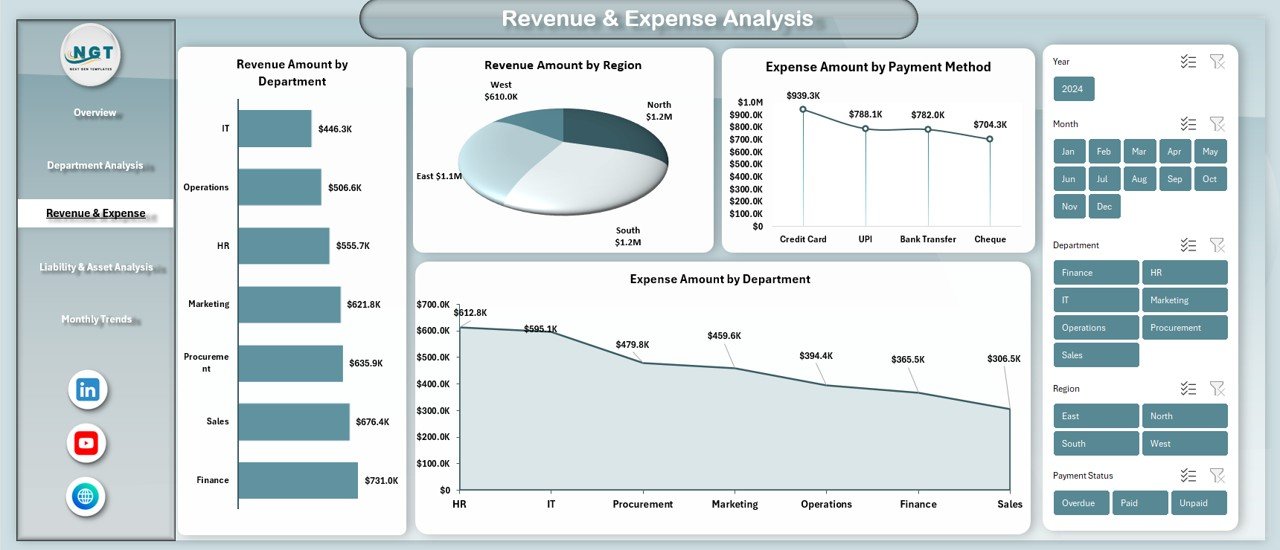
Revenue & Expense Analysis
The Revenue & Expense Analysis sheet provides a deeper look into income and costs. Consequently, businesses can optimize profitability.
Revenue Analysis Metrics
- Revenue Amount by Department
Shows which departments generate the most income. - Revenue Amount by Region
Helps analyze geographical performance.
Expense Analysis Metrics
- Expense Amount by Department
Identifies high-cost departments. - Expense Amount by Payment Method
Reveals how expenses get paid and controlled.
With this insight, finance teams balance growth and cost efficiency effectively.
Click to buy Finance and Accounting Dashboard in Excel
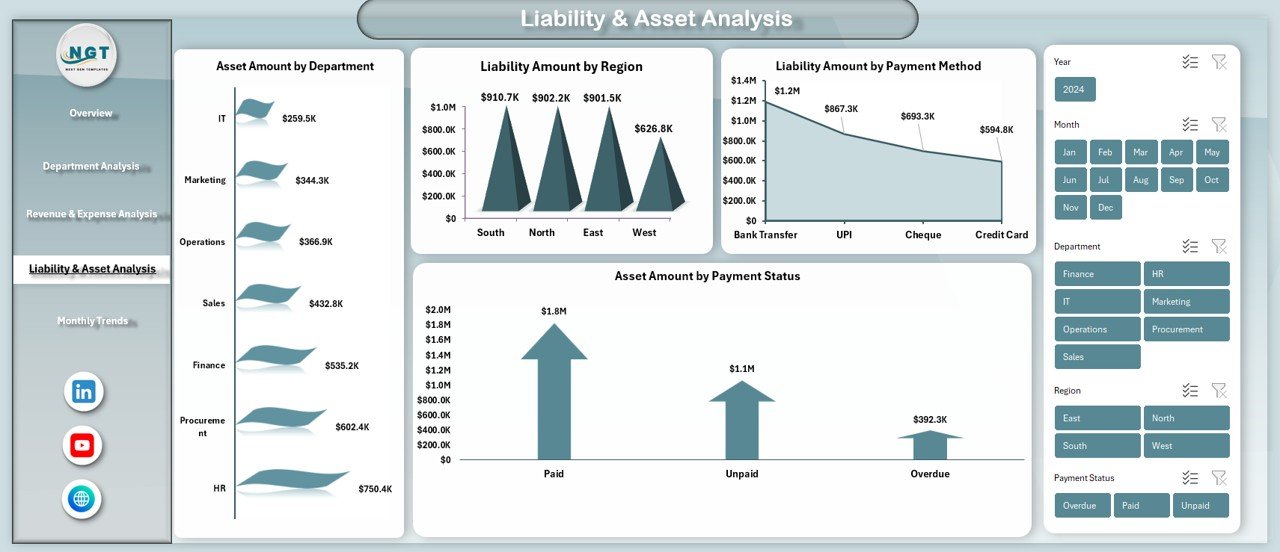
Liability & Asset Analysis Sheet
The Liability & Asset Analysis sheet focuses on balance sheet elements. Therefore, it supports better financial planning.
Asset Analysis
- Asset Amount by Department
Shows asset allocation across departments. - Asset Amount by Payment Status
Tracks paid and unpaid asset-related transactions.
Liability Analysis
- Liability Amount by Region
Highlights region-wise obligations. - Liability Amount by Payment Method
Helps understand how liabilities get settled.
As a result, organizations maintain healthier balance sheets.
Click to buy Finance and Accounting Dashboard in Excel
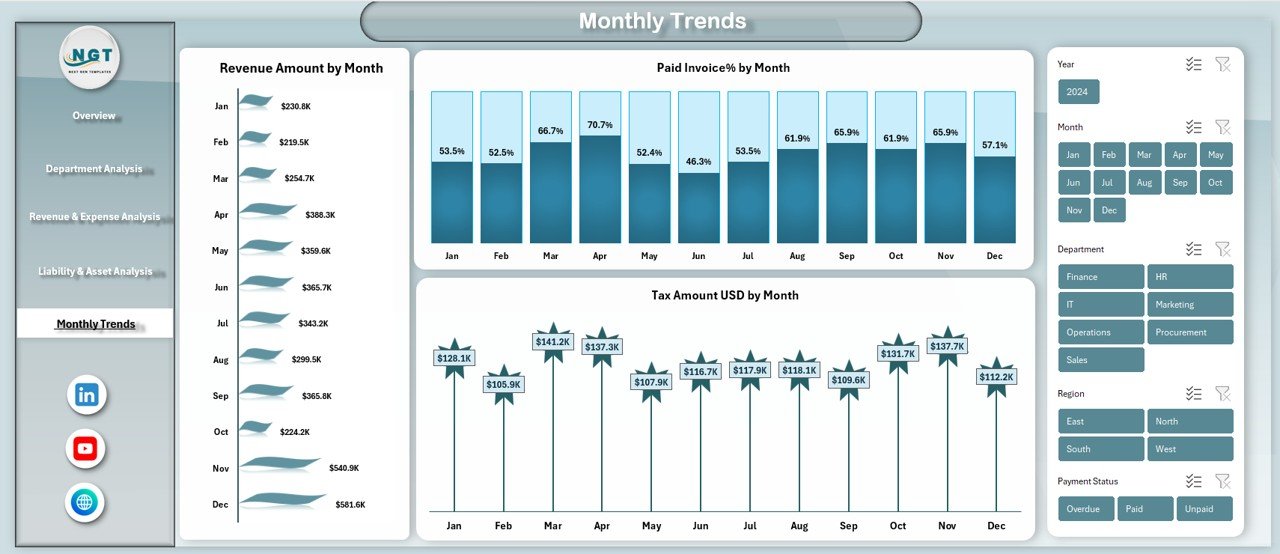
Monthly Trends Sheet
The Monthly Trends sheet tracks performance over time. Therefore, it helps identify patterns and seasonality.
Key Monthly Trend Metrics
- Revenue Amount by Month
Shows growth or decline in revenue trends. - Paid Invoice % by Month
Measures payment efficiency over time. - Tax Amount (USD) by Month
Tracks tax trends for compliance and forecasting.
Because trends reveal direction, leaders plan future strategies confidently.
Click to buy Finance and Accounting Dashboard in Excel
What Are the Key Benefits of Using a Finance and Accounting Dashboard in Excel?
Using this dashboard delivers measurable benefits across the organization.
- Faster financial reporting
- Improved accuracy and consistency
- Better visibility into financial performance
- Stronger cash flow management
- Reduced manual effort and errors
Therefore, finance teams focus more on analysis and less on data preparation.
Advantages of Finance and Accounting Dashboard in Excel
- Centralized Financial Visibility
The dashboard brings all financial metrics into one place. As a result, teams avoid scattered data and confusion.
- Real-Time Performance Tracking
Because Excel updates calculations instantly, users see real-time results after data updates.
- Cost-Effective Solution
Excel dashboards eliminate the need for expensive BI tools. Therefore, even small businesses benefit.
- User-Friendly and Flexible
Most professionals already know Excel. Consequently, adoption becomes quick and smooth.
- Better Decision-Making
Clear visuals and KPIs help leaders make informed financial decisions without delays.
How Does a Finance and Accounting Dashboard Improve Decision-Making?
Decision-making improves when data stays clear and timely.
- Managers identify overspending early
- Finance teams follow up on overdue invoices quickly
- Leaders track profitability by department and region
- Businesses forecast future performance using trends
Thus, financial control becomes proactive rather than reactive.
Best Practices for the Finance and Accounting Dashboard in Excel
Following best practices ensures long-term success and accuracy.
- Maintain Clean and Structured Data
Always enter accurate and consistent data. Clean data improves dashboard reliability.
- Update Data Regularly
Update financial data daily, weekly, or monthly depending on business needs.
- Use Standard Naming Conventions
Consistent naming for departments, regions, and payment methods avoids confusion.
- Protect Critical Formulas
Lock important formulas and cells to prevent accidental changes.
- Review KPIs Periodically
Revisit KPIs regularly to ensure alignment with business goals.
- Train Users Properly
Even simple dashboards work best when users understand how to use them correctly.
Common Mistakes to Avoid While Using Finance Dashboards
Avoiding mistakes saves time and improves results.
- Ignoring data validation
- Overloading dashboards with unnecessary metrics
- Failing to update data on time
- Not reviewing trends regularly
- Using inconsistent formats
By avoiding these errors, dashboards stay reliable and actionable.
How Can Businesses Customize a Finance and Accounting Dashboard in Excel?
Customization enhances dashboard value.
- Add industry-specific KPIs
- Include additional slicers and filters
- Modify charts based on reporting needs
- Integrate data from ERP or accounting systems
Because Excel stays flexible, customization remains easy and scalable.
Conclusion: Why Finance and Accounting Dashboard in Excel Is Essential Today
A Finance and Accounting Dashboard in Excel transforms how businesses manage financial data. It replaces manual reporting with clarity, speed, and insight. Moreover, it supports smarter decisions by presenting revenue, expenses, assets, liabilities, taxes, invoices, and trends in one place.
Whether you manage a small business or a large enterprise, this dashboard helps you stay financially disciplined, transparent, and confident. Therefore, adopting a Finance and Accounting Dashboard in Excel becomes a strategic move rather than a technical upgrade.
Frequently Asked Questions (FAQs)
What is the main purpose of a Finance and Accounting Dashboard in Excel?
The main purpose is to track, analyze, and visualize financial performance in one centralized Excel file for faster decision-making.
Can small businesses use a Finance and Accounting Dashboard in Excel?
Yes, small businesses benefit greatly because Excel dashboards stay affordable, easy to use, and highly flexible.
Does this dashboard require advanced Excel skills?
No, basic Excel knowledge is enough. However, understanding formulas and pivot tables helps users get more value.
How often should financial data be updated in the dashboard?
Businesses should update data daily, weekly, or monthly depending on reporting requirements and transaction volume.
Can this dashboard handle multiple departments and regions?
Yes, the dashboard supports department-wise and region-wise analysis effectively.
Is Excel secure enough for financial dashboards?
Yes, Excel offers password protection and cell locking to secure sensitive financial data.
Can I customize the Finance and Accounting Dashboard in Excel?
Yes, users can easily customize KPIs, charts, filters, and layouts based on business needs.
Does this dashboard support trend analysis?
Yes, the Monthly Trends sheet tracks revenue, paid invoice percentage, and tax amounts over time.
Visit our YouTube channel to learn step-by-step video tutorials
Watch the step-by-step video tutorial:
Click to buy Finance and Accounting Dashboard in Excel