Managing performance in commodities trading never feels simple. You track prices, volumes, margins, risks, and profitability every single day. Moreover, markets move fast, and even a small delay in analysis can lead to missed opportunities or financial losses. Therefore, traders, analysts, and management teams need a clear and reliable way to monitor performance.
That is exactly where a Commodities Trading KPI Dashboard in Excel becomes a powerful solution.
In this detailed guide, you will learn what a Commodities Trading KPI Dashboard in Excel is, why it matters, how it works, its complete dashboard structure, advantages, opportunities for improvement, best practices, and frequently asked questions. Additionally, the article uses simple language, strong transition words, and practical examples so you can apply everything confidently.
Click to buy Commodities Trading KPI Dashboard in Excel
What Is a Commodities Trading KPI Dashboard in Excel?
A Commodities Trading KPI Dashboard in Excel is a structured and interactive reporting tool that converts raw trading data into meaningful KPIs, trends, and visuals.
Instead of reviewing thousands of rows of transaction data, you can track performance through:
- KPI cards
- Trend charts
- Target vs Actual comparisons
- Month-to-date (MTD) and year-to-date (YTD) analysis
As a result, decision-makers gain clarity quickly and act with confidence.
Moreover, Excel makes this dashboard accessible. You do not need expensive BI tools. You only need structured data, logical KPIs, and a well-designed dashboard.
Why Do Commodities Traders Need a KPI Dashboard?
Commodities trading involves volatility, risk, and thin margins. Therefore, tracking performance manually slows down decisions and increases risk.
A KPI dashboard helps because:
- Markets change daily, sometimes hourly
- Margins depend on price movements, costs, and timing
- Risk exposure needs constant monitoring
- Management demands clear performance visibility
When all KPIs stay in one place, teams respond faster and plan better.
How Does a Commodities Trading KPI Dashboard in Excel Work?
The dashboard works by connecting multiple structured sheets into one visual interface.
Here is how the process flows:
- You define KPIs clearly
- You enter actual, target, and previous-year numbers
- Excel formulas calculate variances automatically
- Charts and indicators update instantly
- You analyze trends by month or KPI
As a result, you move from raw numbers to insights in seconds.
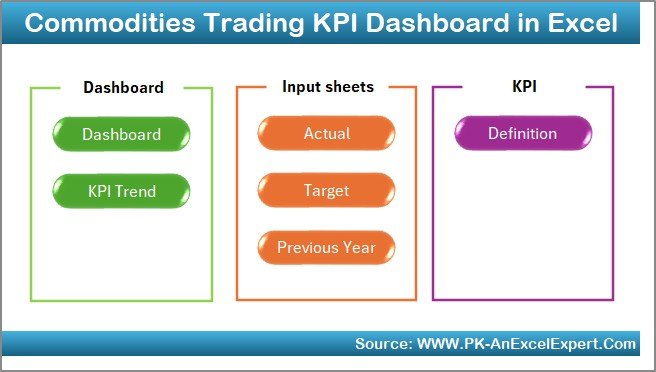
What Are the Key Features of the Commodities Trading KPI Dashboard in Excel?
This dashboard includes 7 structured worksheets, each with a specific purpose. Together, they create a complete performance monitoring system.
Summary Page – How Does the Index Sheet Help Navigation?
The Summary Page acts as the index of the dashboard.
Key Highlights:
- Provides 6 navigation buttons
- Allows instant movement to any worksheet
- Improves user experience and speed
- Reduces confusion for new users
Instead of scrolling through sheets, users jump directly to the required analysis.
Click to buy Commodities Trading KPI Dashboard in Excel
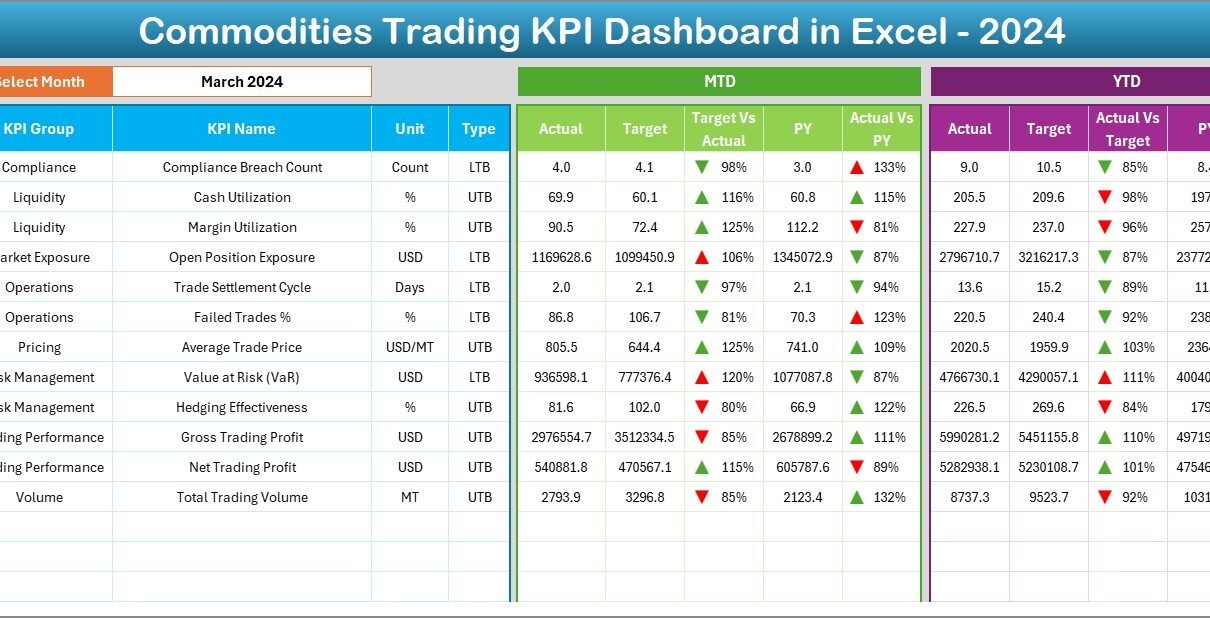
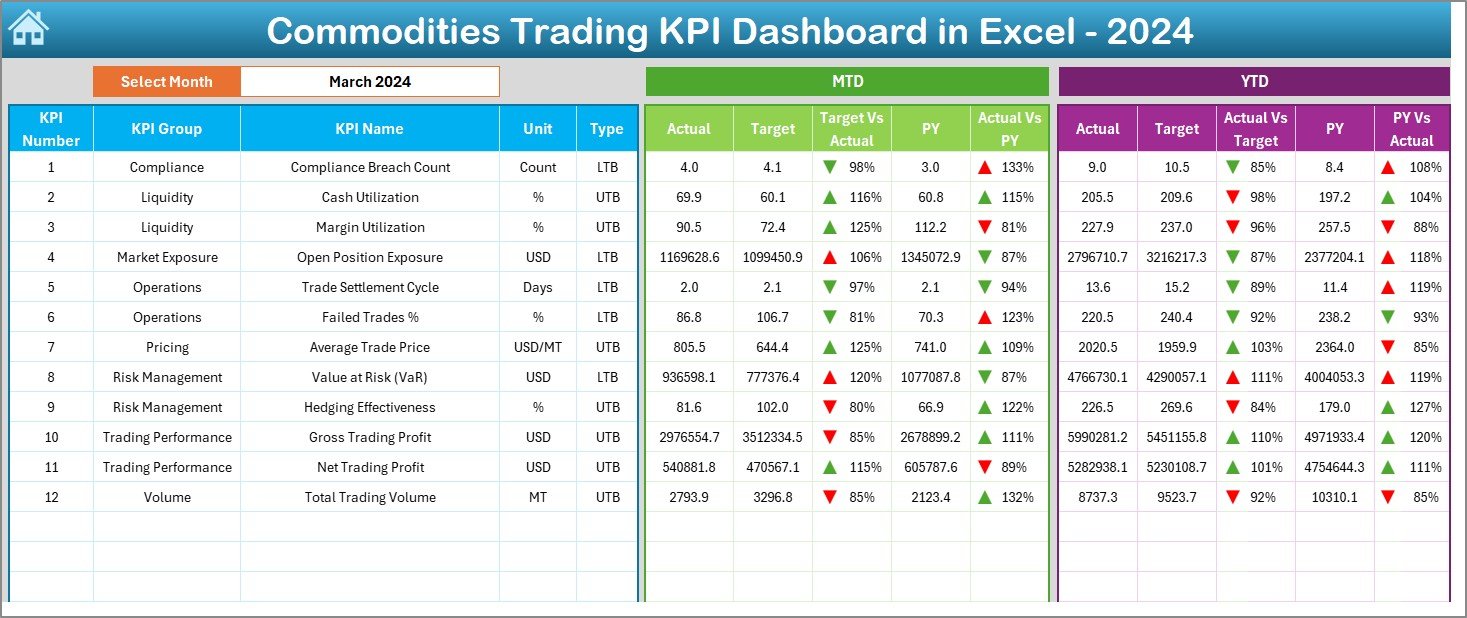
Dashboard Sheet – Where Do You See All KPI Performance?
The Dashboard Sheet is the heart of the solution.
Month Selection
- Cell D3 contains a drop-down to select the month
- All numbers update automatically based on the selected month
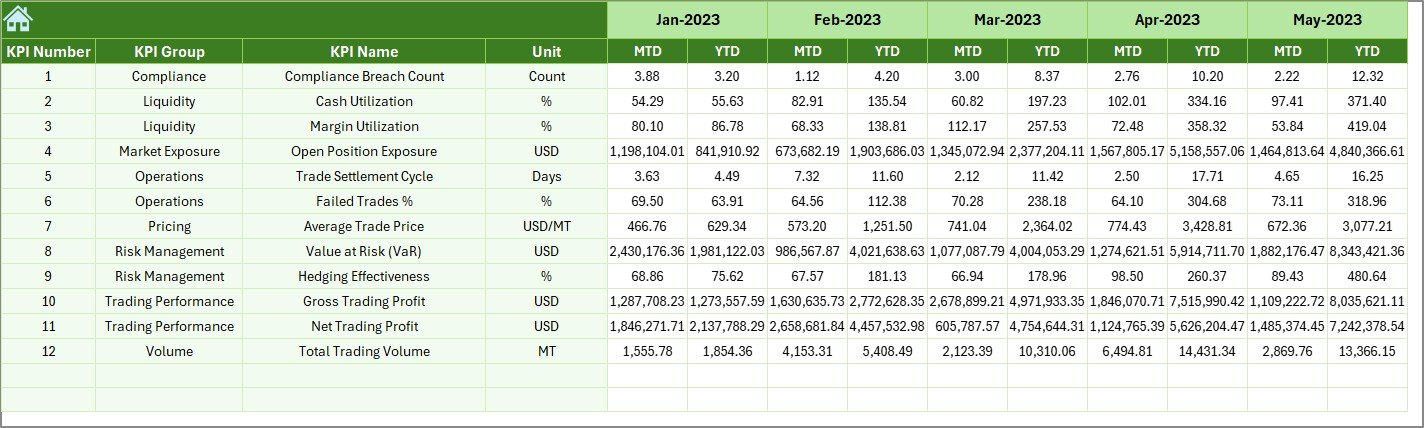
MTD Performance Display
- MTD Actual
- MTD Target
- MTD Previous Year
- Target vs Actual variance
- PY vs Actual variance
Excel shows up and down arrows using conditional formatting. Therefore, performance becomes visible instantly.
YTD Performance Display
- YTD Actual
- YTD Target
- YTD Previous Year
- Target vs Actual variance
- PY vs Actual variance
As a result, users compare short-term and long-term performance in one view.
Click to buy Commodities Trading KPI Dashboard in Excel
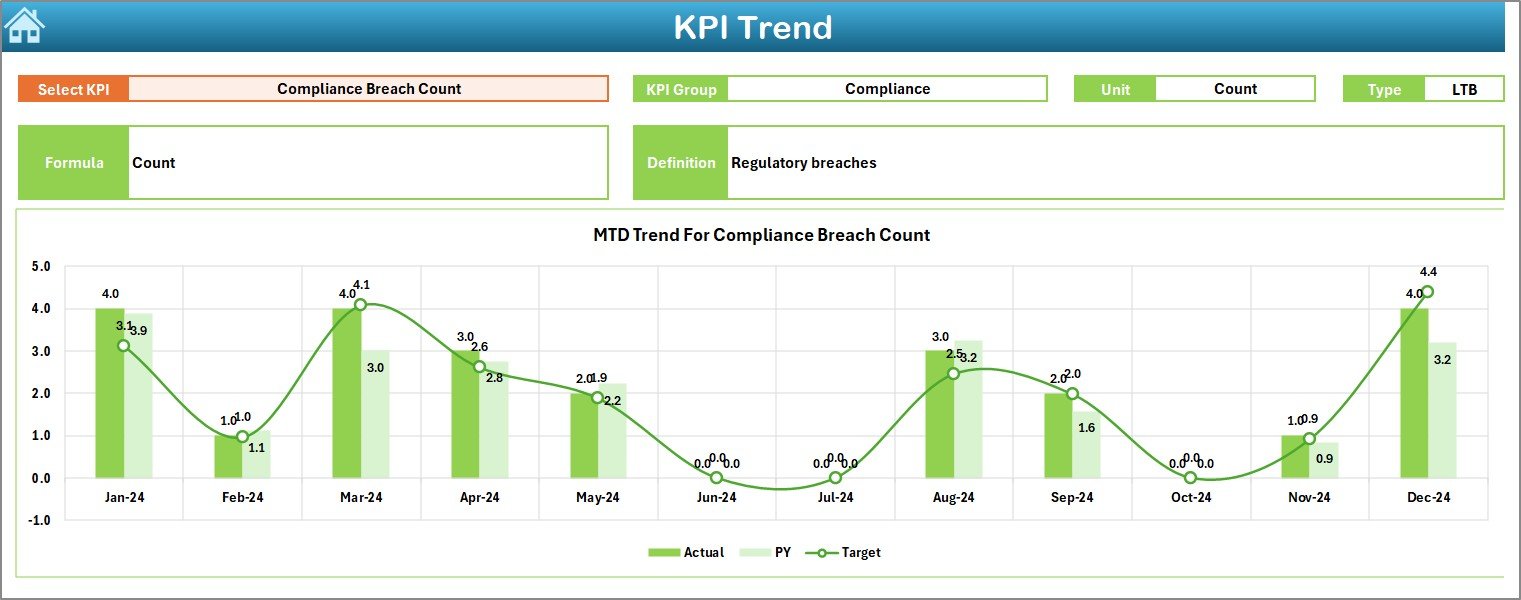
Trend Sheet – How Can You Analyze KPI Trends Over Time?
The Trend Sheet focuses on deep analysis for individual KPIs.
KPI Selection
- Cell C3 contains a KPI drop-down
- Selecting a KPI updates all details instantly
KPI Details Displayed
- KPI Group
- Unit of Measurement
- KPI Type (Upper the Better / Lower the Better)
- KPI Formula
- KPI Definition
Trend Charts
- MTD trend chart for Actual, Target, and PY
- YTD trend chart for Actual, Target, and PY
Therefore, users understand not just current performance but also movement over time.
Click to buy Commodities Trading KPI Dashboard in Excel
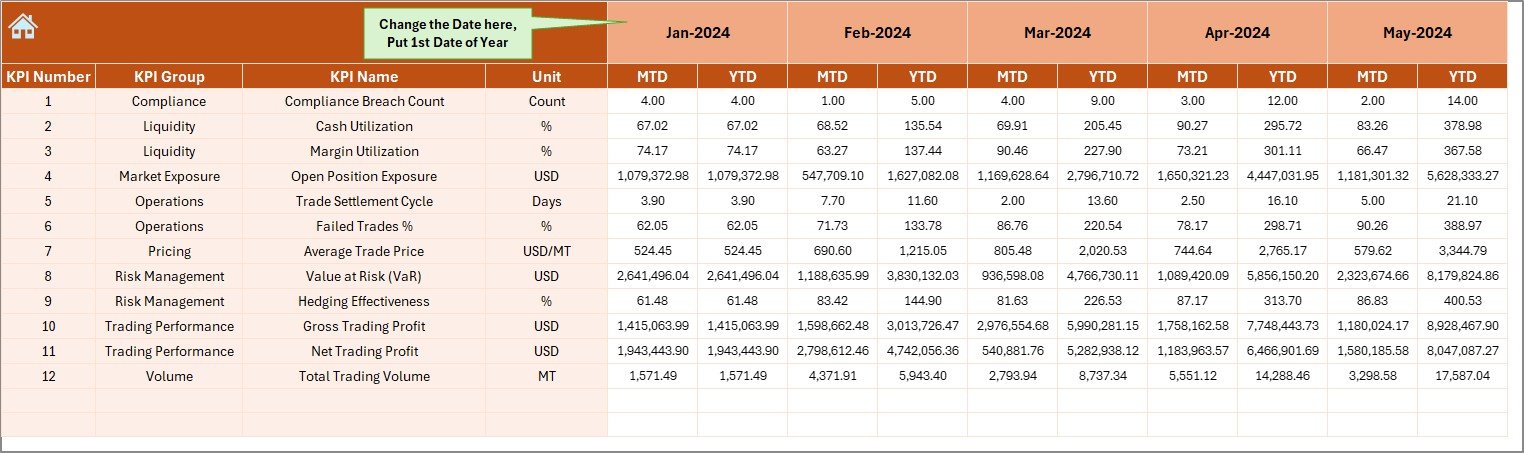
Actual Numbers Input Sheet – Where Do You Enter Real Performance Data?
The Actual Numbers Input Sheet captures real trading results.
How It Works:
- Enter actual MTD and YTD values for each KPI
- Cell E1 controls the starting month of the year
- Data updates dynamically based on the selected month
This structure ensures data consistency and reduces errors.
Click to buy Commodities Trading KPI Dashboard in Excel
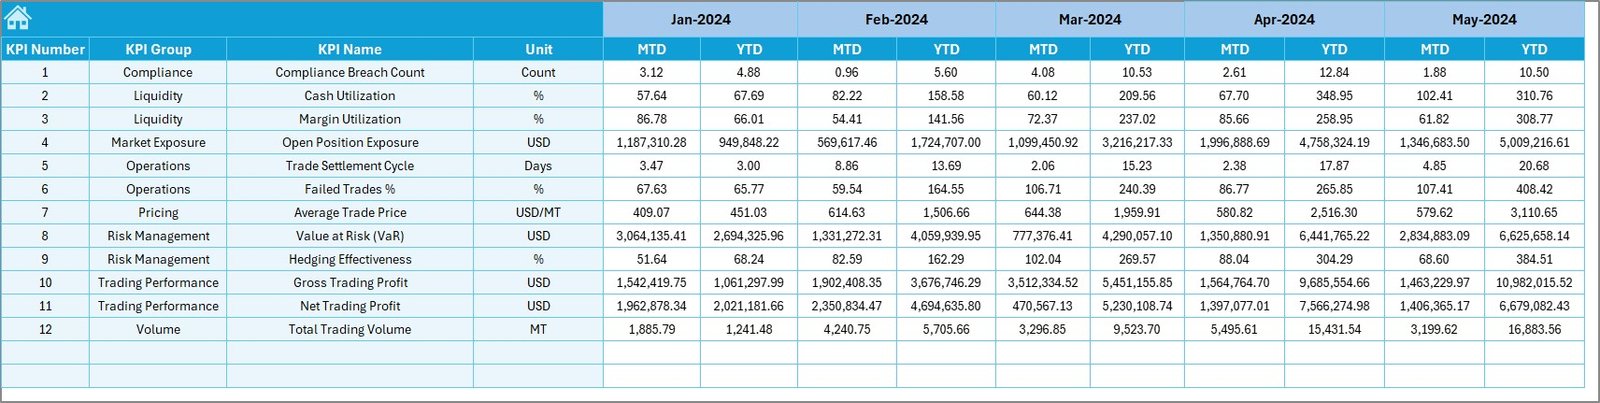
Target Sheet – How Do You Set Performance Benchmarks?
The Target Sheet defines expectations.
Key Inputs:
- Monthly MTD targets
- Monthly YTD targets
- Targets for each KPI
Because targets sit separately, planning remains clean and flexible.
Click to buy Commodities Trading KPI Dashboard in Excel
Previous Year Numbers Sheet – Why Is Historical Comparison Important?
The Previous Year Numbers Sheet stores last year’s data.
Benefits:
- Enables year-over-year analysis
- Highlights growth or decline
- Supports seasonal trend evaluation
When combined with current data, historical numbers add valuable context.
Click to buy Commodities Trading KPI Dashboard in Excel
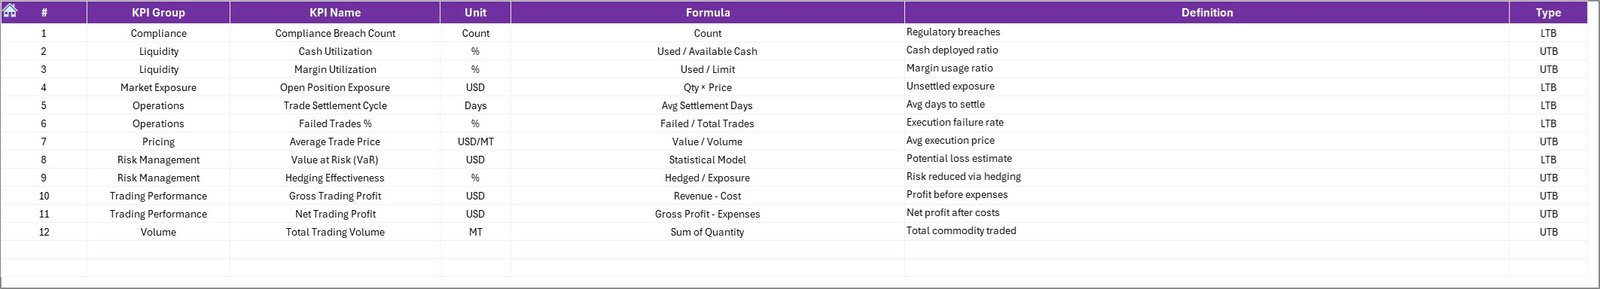
KPI Definition Sheet – How Do You Standardize KPIs?
The KPI Definition Sheet acts as the rulebook.
Fields Included:
- KPI Name
- KPI Group
- Unit
- Formula
- KPI Definition
This sheet ensures everyone interprets KPIs the same way.
Click to buy Commodities Trading KPI Dashboard in Excel
Which KPIs Can You Track in a Commodities Trading KPI Dashboard?
You can customize KPIs based on your trading strategy. However, common KPIs include:
- Trading Volume
- Average Buy Price
- Average Sell Price
- Gross Margin
- Net Profit
- Cost per Unit
- Inventory Turnover
- Exposure Value
- Hedge Effectiveness
- Realized P&L
Because Excel is flexible, you can add or modify KPIs anytime.
Advantages of a Commodities Trading KPI Dashboard in Excel
Using this dashboard delivers several clear benefits.
Key Advantages:
- Centralized KPI monitoring
- Faster decision-making
- Real-time performance visibility
- No dependency on expensive BI tools
- Easy customization
- Familiar Excel environment
Therefore, teams gain control without complexity.
Opportunities for Improvement in a Commodities Trading KPI Dashboard
Even a strong dashboard can evolve.
Improvement Opportunities:
- Add slicers for commodity type or region
- Include risk exposure KPIs
- Add rolling averages
- Integrate scenario analysis
- Enhance visual storytelling
Continuous improvement keeps the dashboard relevant.
Best Practices for the Commodities Trading KPI Dashboard in Excel
Following best practices ensures accuracy and usability.
- Define KPIs Clearly
Always document KPI formulas and definitions.
- Keep Data Entry Clean
Validate inputs to avoid errors.
- Use Consistent Units
Standardize units across all KPIs.
- Avoid Overcrowding
Focus on meaningful KPIs only.
- Review Targets Regularly
Adjust targets as market conditions change.
- Protect Key Sheets
Lock formulas to prevent accidental edits.
How Does This Dashboard Support Better Decision-Making?
The dashboard supports decisions by:
- Highlighting underperformance early
- Showing trends before issues escalate
- Comparing actuals with targets instantly
- Providing historical context
As a result, management responds proactively rather than reactively.
Who Should Use a Commodities Trading KPI Dashboard in Excel?
This dashboard suits:
- Commodity traders
- Risk managers
- Finance teams
- Trading desk heads
- Senior management
Anyone responsible for monitoring trading performance benefits from this tool.
Conclusion
A Commodities Trading KPI Dashboard in Excel transforms complex trading data into clear, actionable insights. It centralizes KPIs, simplifies trend analysis, and improves decision-making speed. Moreover, it delivers flexibility without additional software costs.
By using structured worksheets, clear KPIs, and dynamic visuals, this dashboard helps trading teams stay competitive in fast-moving markets. When you follow best practices and continuously improve the model, Excel becomes a powerful performance management tool.
Frequently Asked Questions (FAQs)
What is a Commodities Trading KPI Dashboard in Excel?
It is an Excel-based tool that tracks key trading performance indicators using KPIs, charts, and trends.
Can I customize KPIs in the dashboard?
Yes. You can add, remove, or modify KPIs easily.
Does the dashboard support MTD and YTD analysis?
Yes. It includes both MTD and YTD tracking for Actual, Target, and Previous Year.
Do I need advanced Excel skills to use it?
No. Basic Excel knowledge is enough to operate the dashboard.
Can this dashboard handle multiple commodities?
Yes. You can extend it with additional dimensions like commodity type or region.
Is Excel reliable for trading performance tracking?
Yes. When structured properly, Excel provides accuracy, flexibility, and speed.
Visit our YouTube channel to learn step-by-step video tutorials
Watch the step-by-step video tutorial:
Click to buy Commodities Trading KPI Dashboard in Excel