In today’s increasingly complex regulatory landscape, ensuring that your business complies with laws, regulations, and internal policies is crucial. Compliance audits help organizations verify that they are following all necessary guidelines, and keeping track of compliance performance is essential for maintaining a healthy, risk-free environment. The Compliance Audit KPI Dashboard in Excel is a powerful tool designed to help you track key performance indicators (KPIs) related to your organization’s compliance audit process.
In this article, we will explore the features of the Compliance Audit KPI Dashboard, the KPIs it tracks, and how it can assist you in improving compliance across your organization.
What is the Compliance Audit KPI Dashboard?
The Compliance Audit KPI Dashboard is a tool that aggregates and visualizes KPIs that are essential for tracking compliance performance. The dashboard provides insights into how well your organization is adhering to legal and regulatory requirements, as well as internal policies. By monitoring these KPIs, businesses can identify areas for improvement, mitigate risks, and ensure they meet industry standards.
The Excel template offers a user-friendly and customizable dashboard with charts, trends, and actionable insights, helping businesses maintain robust compliance practices.
Key Features of the Compliance Audit KPI Dashboard in Excel
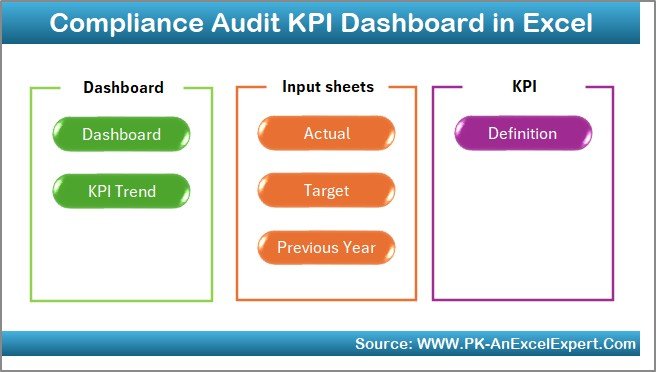
The Compliance Audit KPI Dashboard consists of several worksheets that track various compliance-related KPIs. Below is an overview of the dashboard’s main features:
1. Home Sheet Tab
The Home Sheet serves as the navigation hub, allowing you to easily jump to other sheets within the workbook. This sheet helps streamline your workflow by providing an overview of the dashboard and quick access to key areas.
2. Dashboard Sheet Tab
Click to buy Compliance Audit KPI Dashboard in Excel
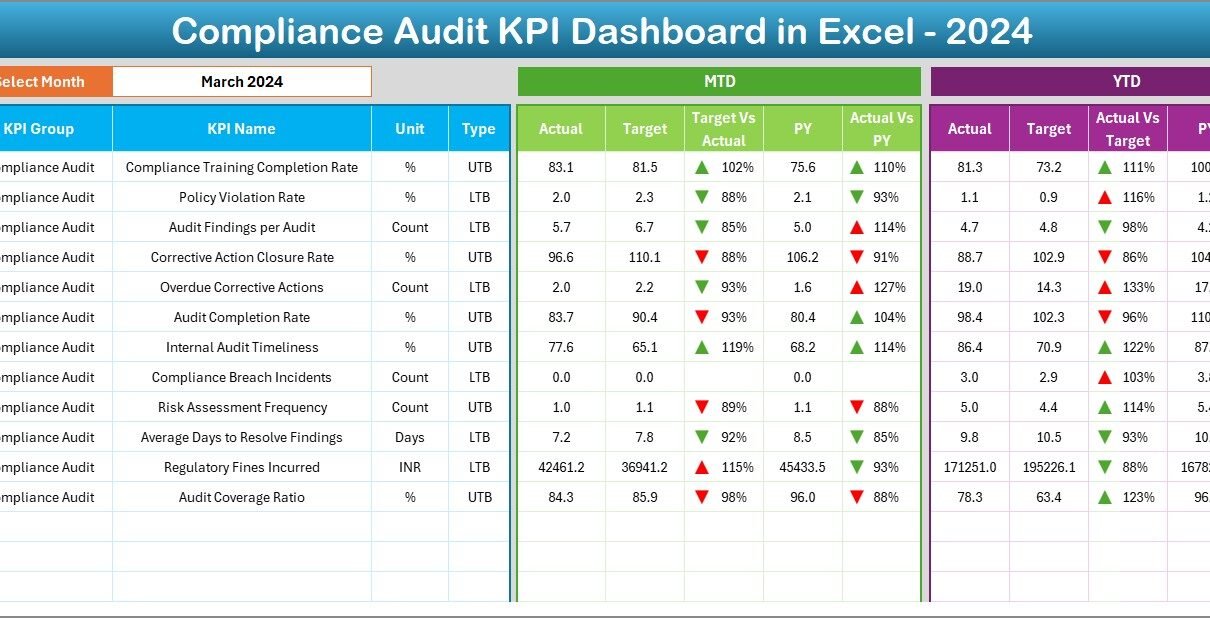
The Dashboard Sheet is the central hub where all KPIs are tracked and displayed. Here, you can view the performance of compliance-related metrics, both in terms of Month-to-Date (MTD) and Year-to-Date (YTD) data. Key features include:
-
Month Dropdown (D3): You can select the month for which you want to view data. The dashboard updates automatically based on your selection.
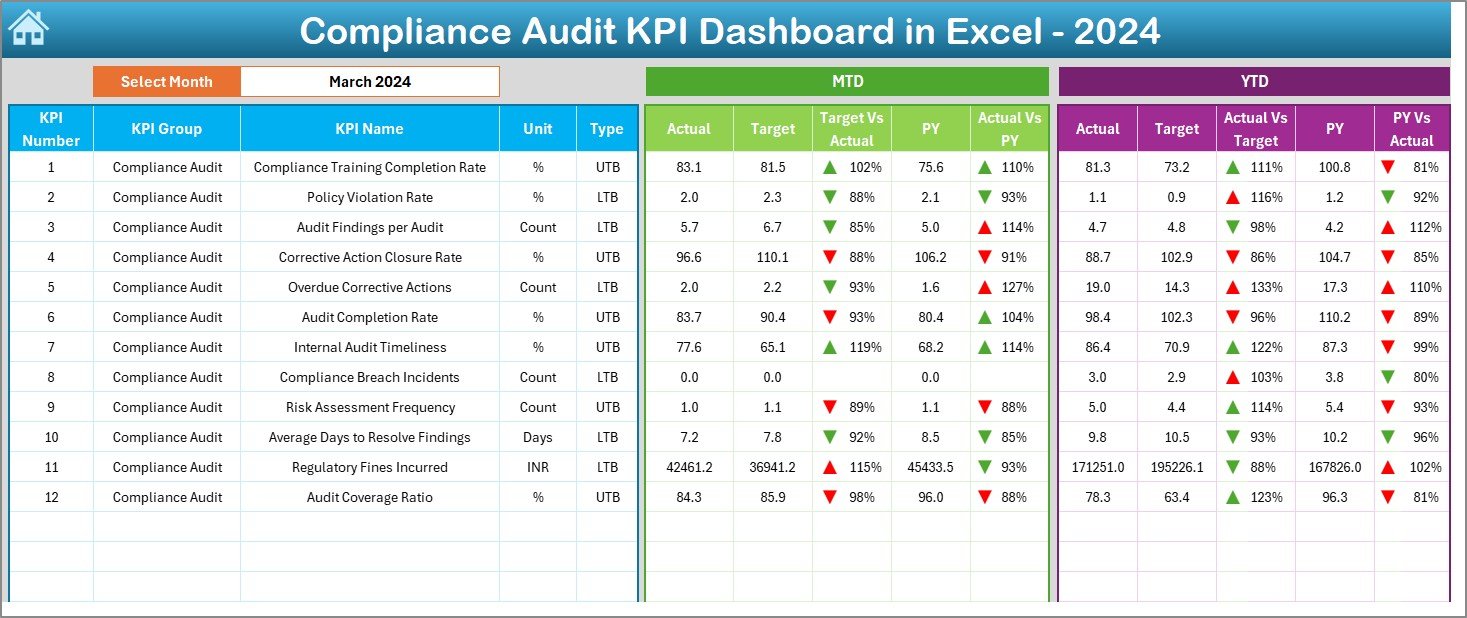
Key Metrics:
- MTD Actual, Target, Previous Year Data: Displays the actual performance for the current month compared to the target and previous year’s data.
- YTD Actual, Target, Previous Year Data: Tracks year-to-date performance and compares it with targets and last year’s data.
- Conditional Formatting: Up and down arrows are used to visually indicate whether each KPI meets or misses the target for both MTD and YTD data.
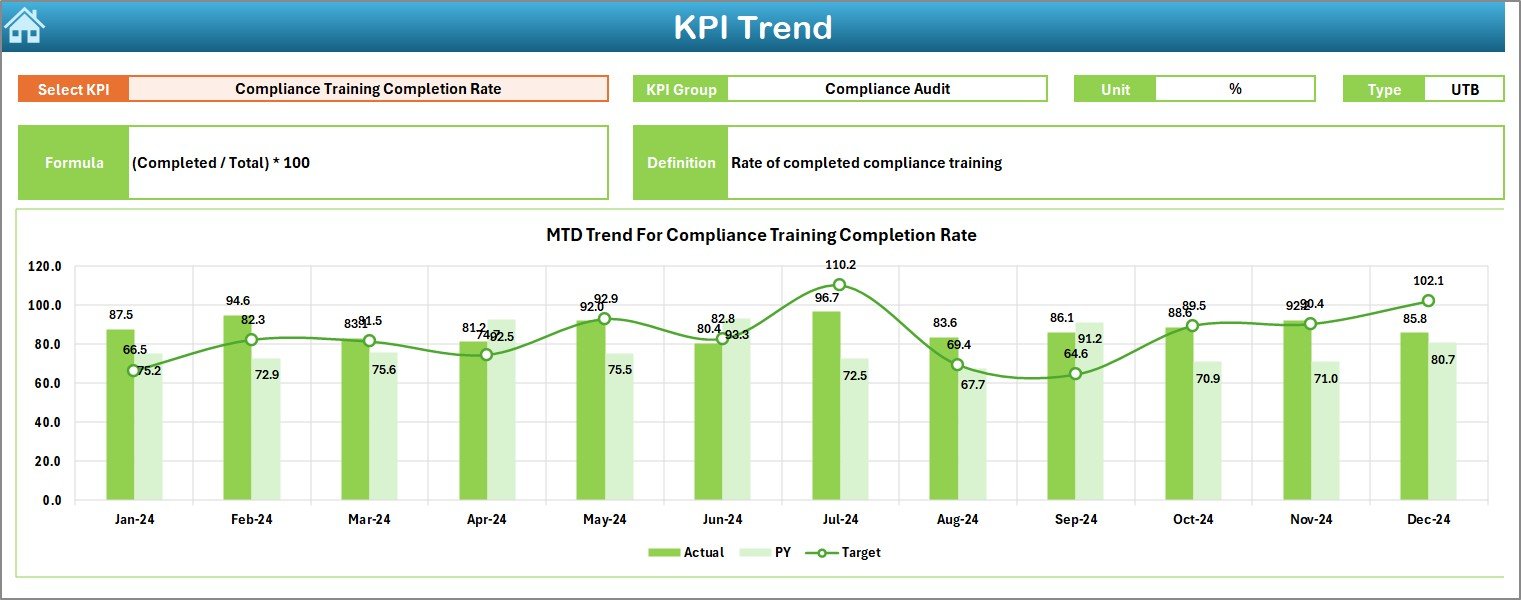
3. KPI Trend Sheet Tab
The KPI Trend Sheet helps you analyze trends over time. You can select any KPI from the dropdown in Range C3 to view its trend data over the months.
-
KPI Group, Unit, Type: This section displays the KPI’s group (e.g., audit performance, compliance status), its unit of measurement, and whether the KPI is “Lower the Better” (LTB) or “Upper the Better” (UTB).
-
Formula and Definition: This section provides the formula for calculating the KPI and an explanation of what each KPI measures.
Click to buy Compliance Audit KPI Dashboard in Excel
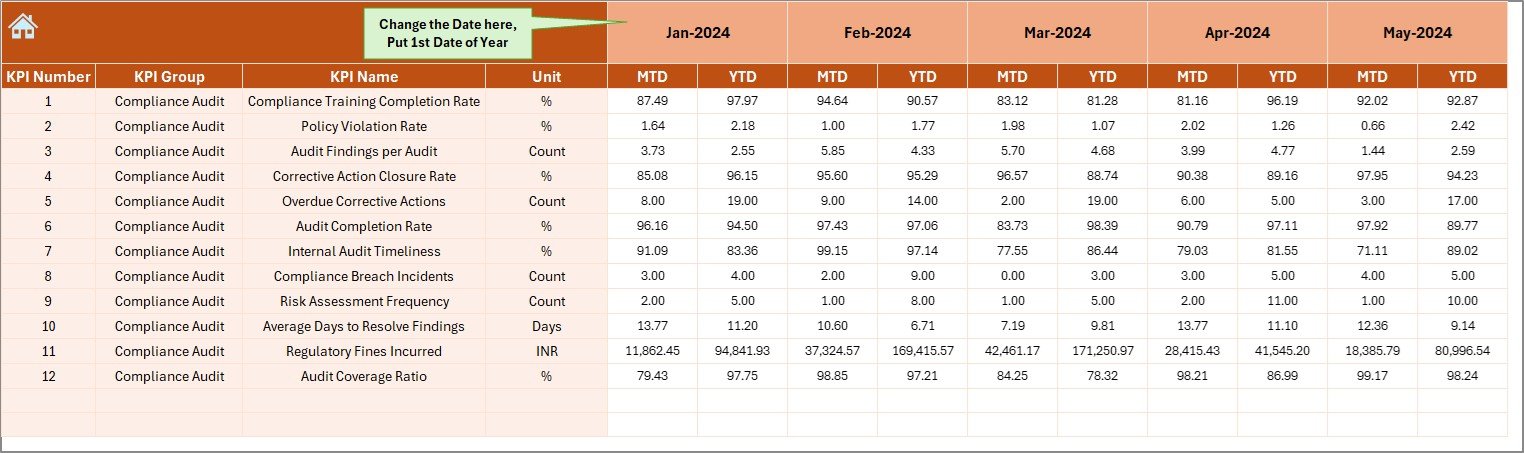
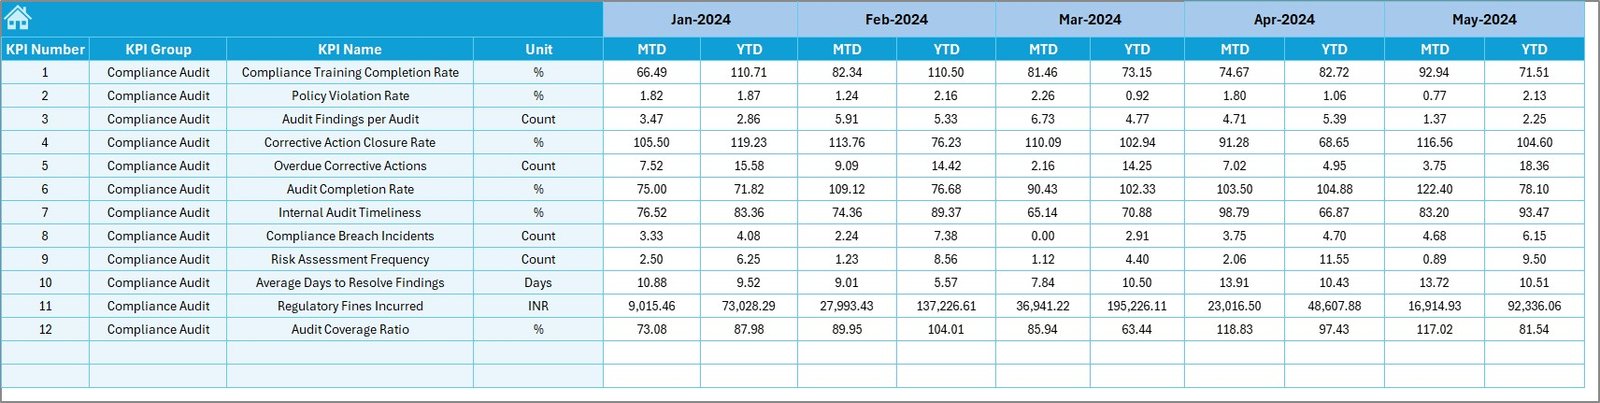
4. Actual Numbers Sheet Tab
In the Actual Numbers Sheet, you can input actual performance data for the month and year. This sheet allows you to update MTD and YTD values to track the organization’s progress against compliance targets.
-
MTD and YTD Input: Enter the actual values for each KPI, which will automatically update the dashboard.
-
Month Selection (E1): Select the first month of the year to automatically adjust the data and refresh the dashboard.
5. Target Sheet Tab
The Target Sheet lets you input target values for each KPI:
-
Monthly and YTD Targets: Enter target values for each KPI to compare actual performance against the established goals.
Click to buy Compliance Audit KPI Dashboard in Excel
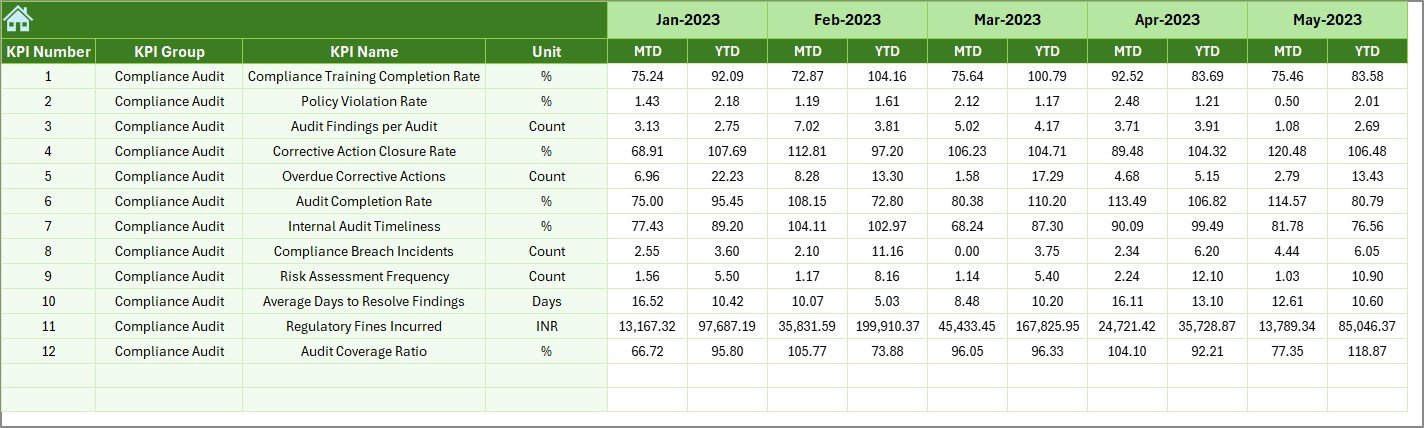
6. Previous Year Number Sheet Tab
In this tab, you can enter data for the previous year:
-
Historical Comparison: This allows you to compare the current year’s performance with that of the previous year, providing insight into trends, growth, and areas needing attention.
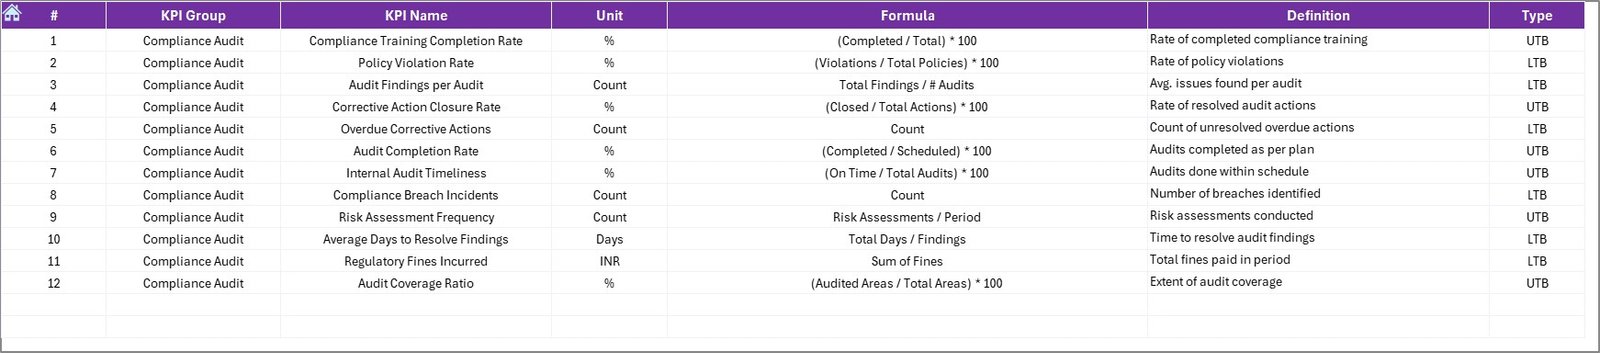
7. KPI Definition Sheet Tab
The KPI Definition Sheet is where each KPI is defined clearly:
-
KPI Name, Group, Unit: Defines each KPI’s name, group (e.g., audit performance, regulatory compliance), and unit of measurement.
-
Formula and Definition: Provides a clear explanation of how each KPI is calculated and its significance in measuring compliance.
Advantages of Using the Compliance Audit KPI Dashboard
The Compliance Audit KPI Dashboard offers several key advantages:
-
Centralized Data: All compliance-related KPIs are organized and displayed in one dashboard, providing a clear and comprehensive view of your compliance performance.
-
Real-Time Monitoring: Track the status of your compliance efforts in real-time, allowing for quick adjustments and improvements.
-
Visual Representation: Charts and conditional formatting (up/down arrows) provide a visual understanding of how well the organization is performing in various compliance areas.
-
Enhanced Decision-Making: With accurate and up-to-date data, decision-makers can make informed choices about compliance strategies and priorities.
-
Ease of Use: The dashboard is user-friendly and can be customized to fit your organization’s specific needs, making it an accessible tool for all team members involved in compliance management.
Opportunity for Improvement in the Compliance Audit KPI Dashboard
Click to buy Compliance Audit KPI Dashboard in Excel
While the Compliance Audit KPI Dashboard is a powerful tool, there are several opportunities to improve it:
-
Automated Data Entry: Integrating the dashboard with compliance management systems can automate data entry, reducing the time spent on manual updates and improving data accuracy.
-
Predictive Analytics: Adding predictive analytics could help forecast potential compliance risks, allowing you to address issues before they arise.
-
Mobile Accessibility: Making the dashboard mobile-friendly would allow managers and auditors to monitor compliance performance from anywhere.
-
Custom Alerts: Including customizable alerts for critical KPIs could help ensure that key compliance issues are addressed in a timely manner.
Best Practices for Using the Compliance Audit KPI Dashboard
To get the most out of the Compliance Audit KPI Dashboard, consider the following best practices:
-
Update Regularly: Ensure that data is updated regularly to maintain accuracy and provide timely insights.
-
Focus on High-Impact KPIs: Track KPIs that have the most significant impact on your compliance goals, such as the Compliance Rate and Audit Findings.
-
Monitor Trends: Use the trend analysis feature to track changes in compliance performance over time and identify areas for improvement.
-
Set Clear Targets: Establish clear and achievable compliance targets for each KPI and use the dashboard to monitor progress.
-
Collaborate Across Teams: Share the dashboard with all stakeholders involved in compliance management, ensuring alignment and coordination.
Conclusion
The Compliance Audit KPI Dashboard in Excel is a comprehensive tool that helps businesses track and monitor compliance performance. By focusing on key metrics such as compliance rates, audit findings, and corrective actions, this dashboard provides valuable insights into your organization’s compliance efforts. Whether you’re a compliance officer, auditor, or manager, this tool helps you make data-driven decisions to maintain compliance, mitigate risks, and improve overall operations.
Frequently Asked Questions (FAQs)
Click to buy Compliance Audit KPI Dashboard in Excel
1. What KPIs are tracked in the Compliance Audit KPI Dashboard?
The dashboard tracks KPIs such as compliance rates, audit findings, corrective action rates, regulatory non-compliance incidents, and more.
2. How do I input data into the Compliance Audit KPI Dashboard?
You enter the data in the Actual Numbers Sheet for MTD and YTD metrics, and you can set targets in the Target Sheet and historical data in the Previous Year Sheet.
3. Can I customize the Compliance Audit KPI Dashboard?
Yes, the dashboard is customizable. You can modify KPIs, formulas, and the layout to fit your organization’s specific compliance needs.
4. How often should I update the data in the Compliance Audit KPI Dashboard?
It’s recommended to update the dashboard regularly (e.g., weekly or monthly) to ensure it reflects the most current compliance performance data.
5. Can the Compliance Audit KPI Dashboard be automated?
Yes, the dashboard can be integrated with compliance management systems for automated data collection, reducing manual data entry.
Visit our YouTube channel to learn step-by-step video tutorials
Watch the step-by-step video Demo:
Click to buy Compliance Audit KPI Dashboard in Excel