Customer engagement is more critical than ever in the fast-paced world of IT and technology. Businesses rely heavily on actionable insights to improve customer relationships, boost satisfaction, and enhance loyalty. But how do you keep track of these insights across different metrics without losing your sanity? The answer lies in a Customer Engagement KPI Dashboard in Excel—a powerful and ready-to-use tool designed for IT and tech companies.
In this comprehensive guide, we’ll walk you through everything you need to know about creating, using, and maximizing the benefits of an IT and Tech Customer Engagement KPI Dashboard in Excel. You’ll discover its structure, key features, advantages, best practices, and even answers to the most commonly asked questions.
Click to Purchases IT and Tech Customer Engagement KPI Dashboard in Excel
What is a Customer Engagement KPI Dashboard?
A Customer Engagement KPI Dashboard in Excel is a centralized visual tool that helps IT and tech businesses track, measure, and analyze engagement metrics. These dashboards help visualize data using dynamic charts, slicers, and tables, offering a holistic view of how customers interact with your company.
Instead of juggling dozens of spreadsheets, this dashboard presents all your key performance indicators (KPIs) in one place—making it easier to assess performance and take timely action.
Key Features of the IT and Tech Customer Engagement KPI Dashboard
This ready-to-use Excel template is carefully structured with 7 interactive worksheets, each playing a crucial role in helping teams manage, measure, and analyze customer engagement:
Home Sheet
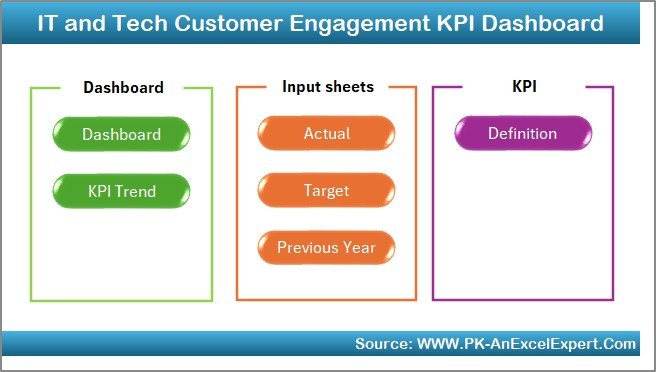
The Home sheet serves as your navigation hub. It features 6 clickable buttons, making it easy to jump between various sections of the dashboard without getting lost. This structure boosts usability and streamlines your workflow.
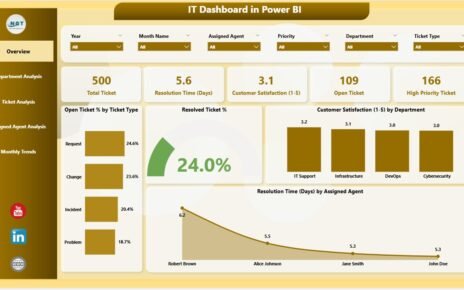
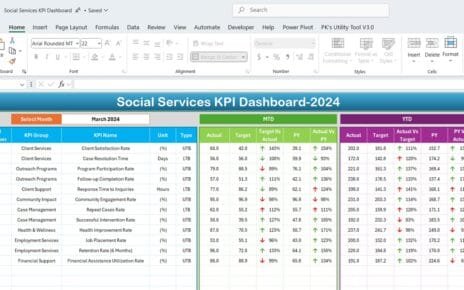
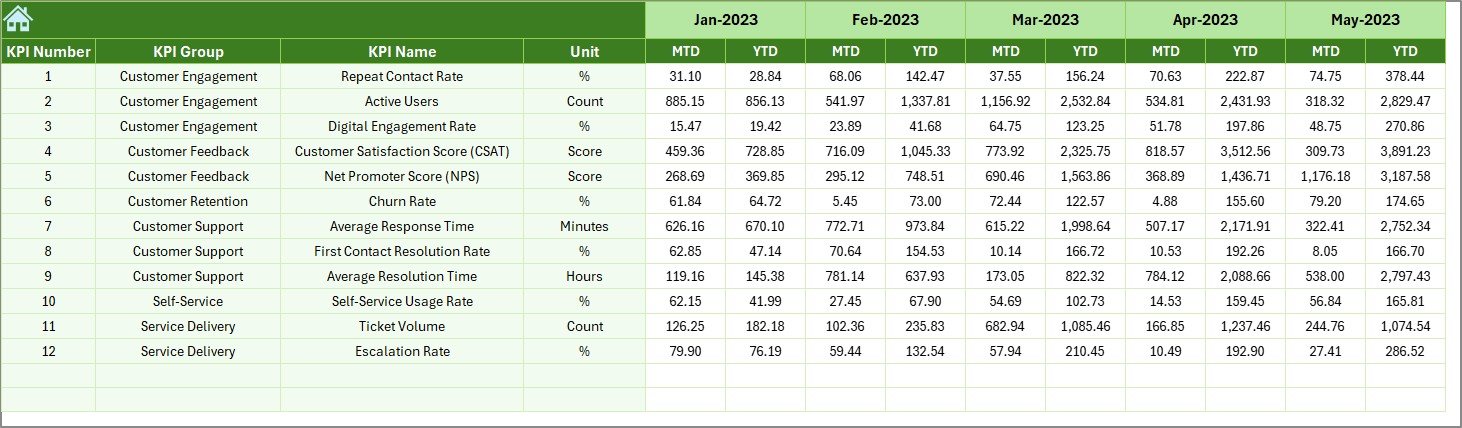
Dashboard Sheet Tab
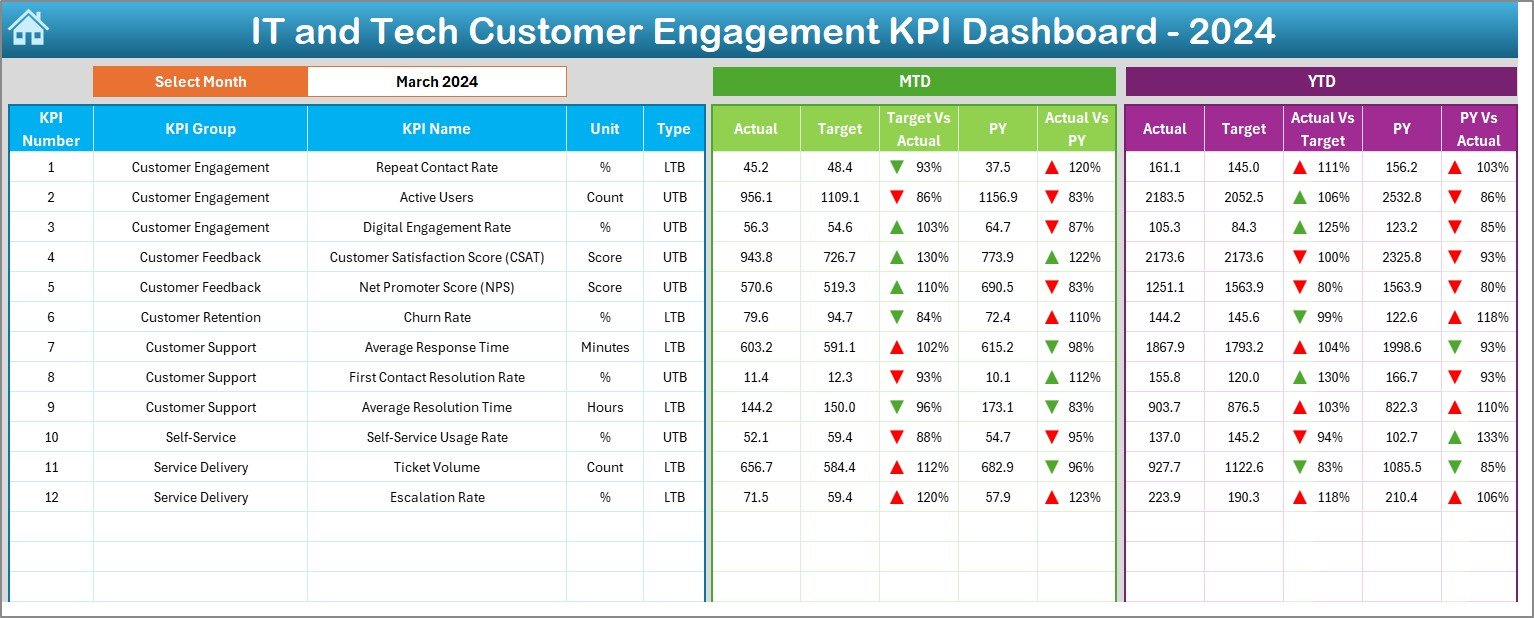
The Dashboard tab is the heart of this template. It presents a dynamic view of:
-
Month-to-Date (MTD) and Year-to-Date (YTD) actual values
-
Corresponding targets
-
Previous year (PY) data for comparison
-
Color-coded conditional formatting with up/down arrows to show trends
With a simple dropdown on cell D3, you can select a specific month. Instantly, all figures adjust—helping you make fast, informed decisions.
KPI Trend Sheet
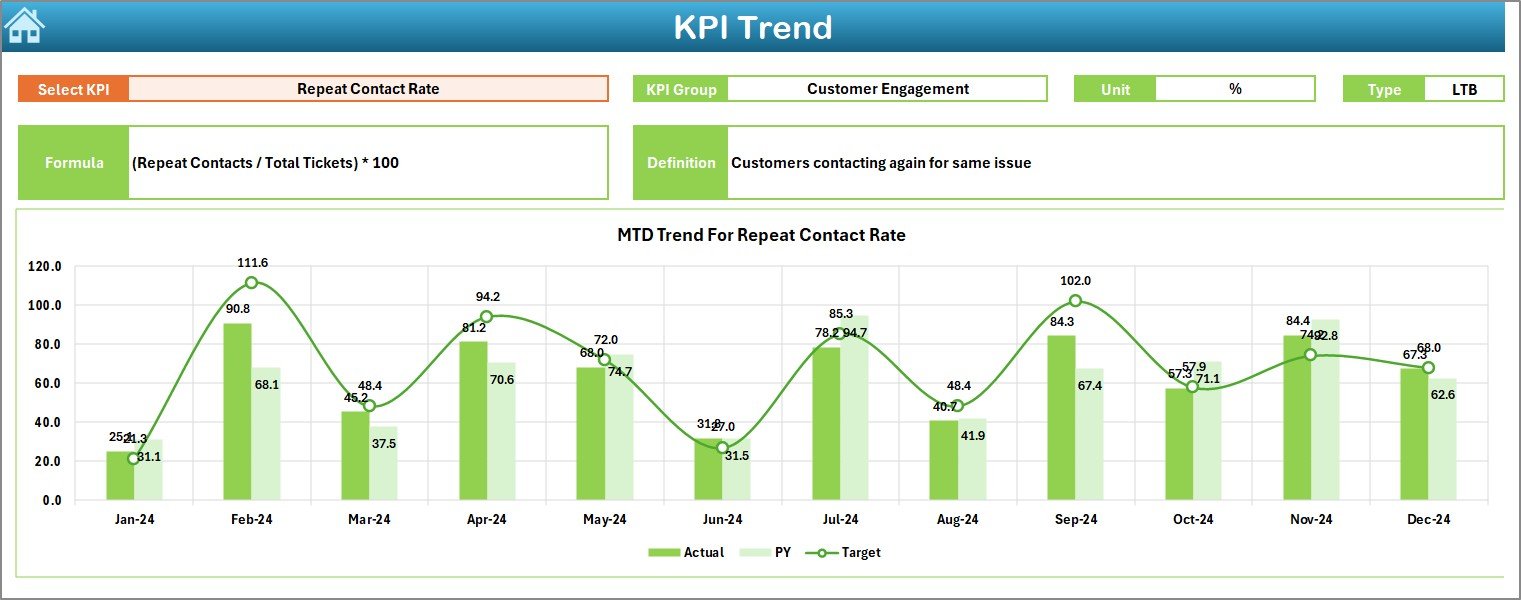
This sheet provides deep insights into the behavior of specific KPIs over time.
-
You can select any KPI from the dropdown in cell C3.
-
It shows details like KPI Group, Unit, KPI Type (Lower or Upper the Better), Formula, and Definition.
-
Below that, visual trend charts for MTD and YTD values (Actual vs. Target vs. PY) provide a quick performance overview.
Actual Numbers Input Sheet
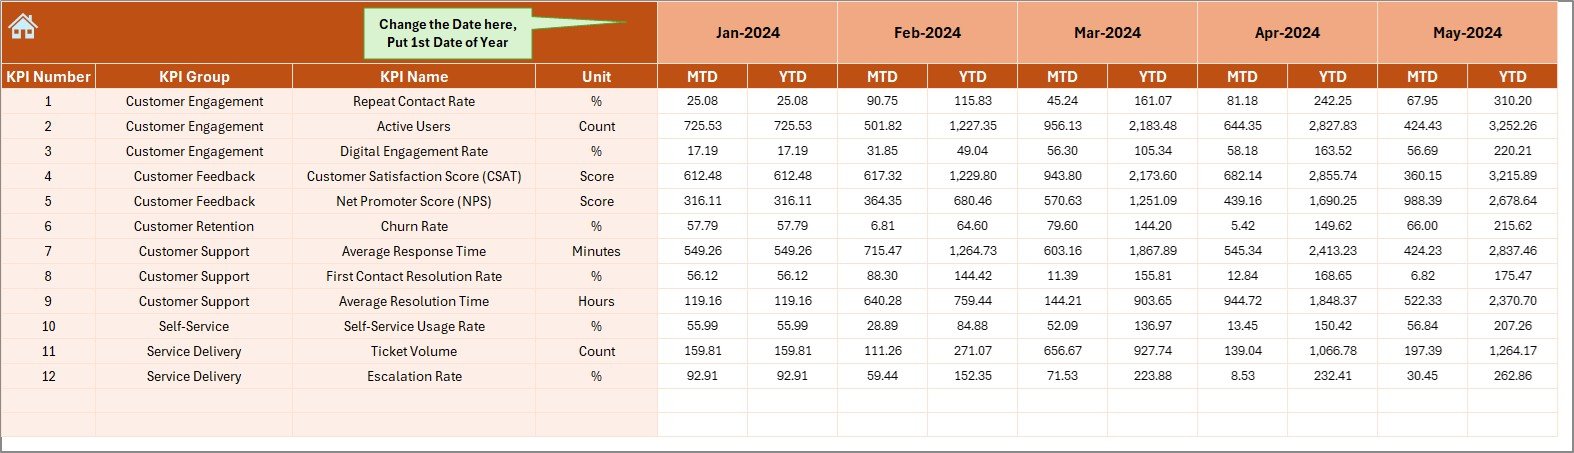
Here’s where data entry gets straightforward. This sheet allows you to:
-
Enter MTD and YTD actual numbers
-
Choose the month dynamically from cell E1
-
Quickly record data without disturbing any formulas or formatting
Target Sheet Tab
Input your monthly MTD and YTD target values in this sheet. Keeping targets updated regularly helps you compare your goals with actual performance effectively.
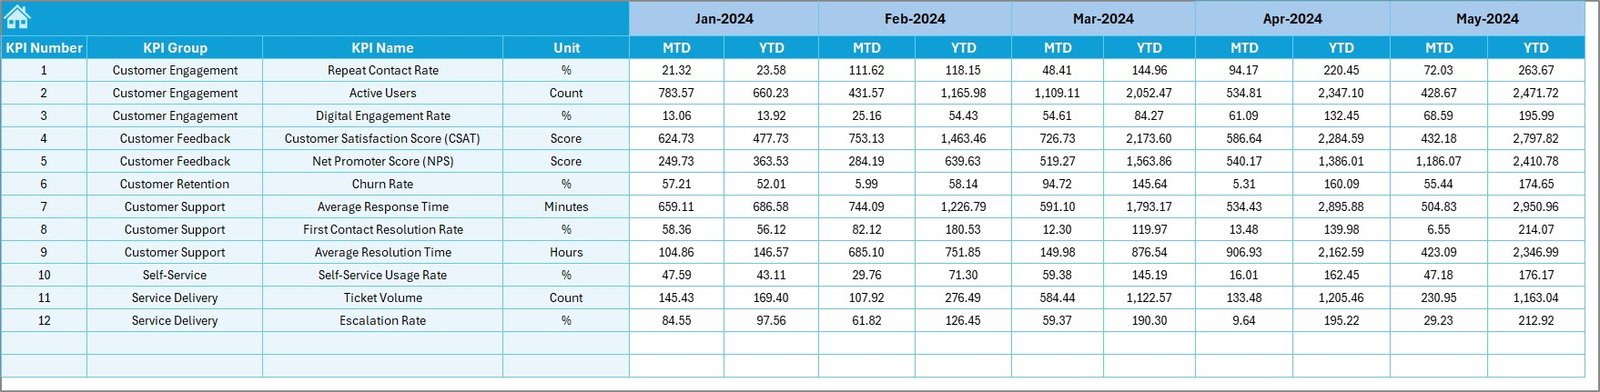
Previous Year Numbers
Consistency matters. That’s why this sheet captures last year’s data, providing a historical benchmark. Comparing against PY helps track year-on-year improvements or gaps.
KPI Definition Sheet Tab
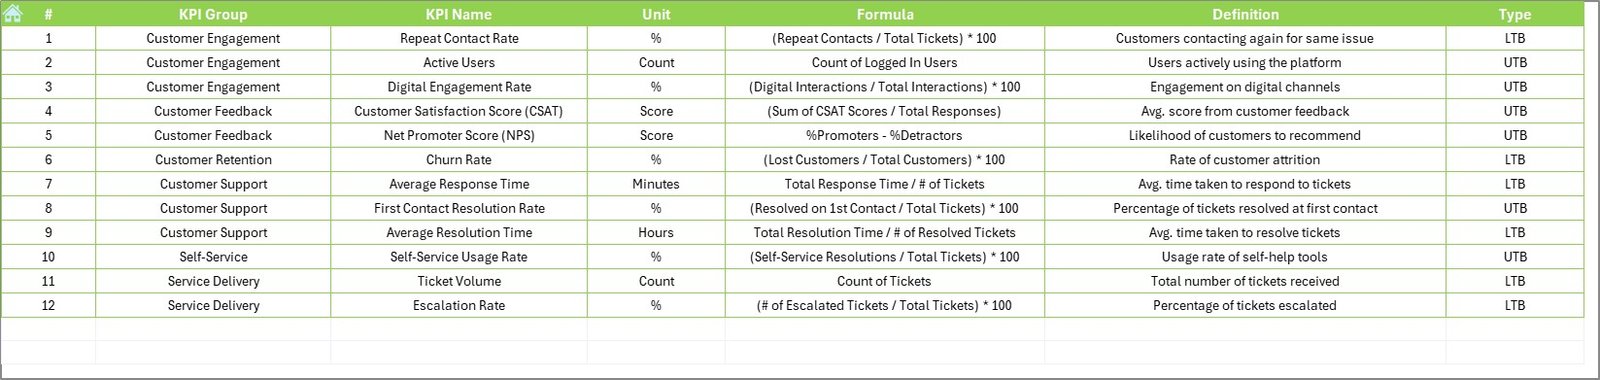
Transparency is critical when working with metrics. This sheet includes:
-
KPI Name
-
Group
-
Unit
-
Formula
-
Short Definition
This section ensures everyone—managers, analysts, and team members—understands what each KPI represents.
Advantages of Using a Customer Engagement KPI Dashboard in Excel
Let’s dive into why this dashboard is a game-changer for IT and tech teams:
1. Centralized Reporting
You no longer need to open multiple sheets or files. The dashboard brings all engagement metrics under one roof.
2. Time-Saving Automation
Thanks to dropdowns, dynamic formulas, and charts, you can view reports in just a few clicks—saving hours of manual work.
3. Real-Time Insights
You can immediately see whether your KPIs are above or below target using color-coded arrows and conditional formatting.
4. Enhanced Decision-Making
With all data organized and visualized, leadership can make strategic decisions backed by facts—not guesswork.
5. Historical Comparison
Benchmark your current performance with last year’s numbers and analyze seasonal trends or repeated issues.
6. Easy Collaboration
This Excel-based dashboard can be easily shared across departments, enabling better coordination and understanding of customer engagement strategies.
Click to Purchases IT and Tech Customer Engagement KPI Dashboard in Excel
Best Practices for IT and Tech KPI Dashboards
Here are some tried-and-tested best practices for getting the most out of your KPI dashboard:
1. Keep Your Data Updated
Regularly update your actuals, targets, and PY values to ensure your dashboard reflects the current reality.
2. Limit the Number of KPIs
Focus on the most relevant KPIs instead of tracking everything. Too many metrics can clutter your view and dilute focus.
3. Use Monthly Trends
Monthly tracking allows you to respond to changes quickly, without waiting for quarterly or yearly reviews.
4. Explain Every Metric
Always use the KPI Definition Sheet to describe what a metric means, how it’s calculated, and its importance. This avoids confusion among users.
5. Keep the Visuals Clean
Avoid chart overload. Use only essential visuals that help interpret the data clearly.
Common KPIs to Include in a Tech Customer Engagement Dashboard
Here’s a list of commonly used KPIs in IT and tech customer engagement:
-
Net Promoter Score (NPS)
-
Customer Satisfaction Score (CSAT)
-
Average Response Time
-
Customer Retention Rate
-
First Contact Resolution (FCR)
-
Support Ticket Volume
-
Self-Service Usage Rate
-
Churn Rate
-
Average Handling Time (AHT)
-
Customer Lifetime Value (CLTV)
-
Escalation Rate
-
Feedback Response Rate
How to Customize the Dashboard for Your Team
Every tech company is different. You might need to track software performance engagement or SaaS support metrics. Here’s how to tailor the dashboard:
-
Modify or add KPI rows in the KPI Definition Sheet
-
Adjust formulas and labels based on your organization’s metric structure
-
Use your branding colors or logos in the Dashboard and Home sheets
-
Add slicers or pivot filters for deeper segmentation (e.g., by product or region)
Why Excel is Still Powerful for Dashboards?
Click to Purchases IT and Tech Customer Engagement KPI Dashboard in Excel
Despite the rise of BI tools like Power BI or Tableau, Excel remains a go-to for many teams due to:
-
Familiar interface
-
No steep learning curve
-
Flexibility to adapt
-
Offline access
-
Quick implementation time
-
Easy integration with other tools or exports
Who Should Use This Dashboard?
This Excel dashboard is ideal for:
-
IT Helpdesk Teams
-
Customer Support Managers
-
Product Managers
-
Client Relationship Executives
-
Customer Success Teams
-
CXO-level Decision Makers in Tech Firms
If you deal with tech customers and want to track engagement, this tool is for you.
Conclusion
A well-designed Customer Engagement KPI Dashboard in Excel empowers IT and tech teams to monitor what truly matters. It centralizes your metrics, reveals actionable insights, and supports data-driven decisions.
So whether you’re leading a small startup or managing global customer support, using this dashboard can elevate your strategy and results—without the need for expensive software or technical complexity.
Frequently Asked Questions (FAQs)
1. What is the purpose of a Customer Engagement KPI Dashboard?
The main purpose is to measure how well your IT or tech company engages with customers. It shows data on satisfaction, retention, support efficiency, and more.
2. How often should I update the dashboard?
Ideally, you should update it monthly. Make sure to enter new actuals, targets, and previous year numbers regularly to keep it relevant.
3. Can I use this Excel dashboard for SaaS products?
Absolutely. You can customize it by adding KPIs related to user onboarding, trial conversion rates, and monthly active users.
4. Do I need advanced Excel knowledge to use this?
Not at all. The template is user-friendly and includes dropdowns and basic data entry fields. If you can work with tables and charts, you’re good to go.
5. Is this dashboard better than using Google Sheets?
Excel has more robust features, better conditional formatting, and faster processing for larger datasets. However, you can convert the format to Google Sheets if needed.
6. Can I add more KPIs later?
Yes! You can always expand the KPI Definition Sheet, adjust the dashboard logic, and update formulas as per your new requirements.
Visit our YouTube channel to learn step-by-step video tutorials
Click to Purchases IT and Tech Customer Engagement KPI Dashboard in Excel