In the retail industry, having a clear overview of sales, inventory, and performance metrics is essential for making informed decisions and driving business growth. The Retail Dashboard in Power BI is a ready-to-use template designed to provide valuable insights into various aspects of retail operations, from sales performance to customer analysis. In this article, we will explain the key features of this dashboard and how it can help retail businesses optimize their operations and enhance overall performance.
What is the Retail Dashboard in Power BI?
The Retail Dashboard in Power BI is an interactive tool designed to help businesses track and analyze key retail metrics. It offers a comprehensive view of sales, product performance, customer analysis, and team performance. By utilizing multiple pages and visual elements, this dashboard enables decision-makers to identify trends, monitor sales, and evaluate team performance in real time.
This dashboard includes multiple pages that focus on different aspects of retail operations, making it easy to drill down into specific data points and gain insights.
Key Features of the Retail Dashboard in Power BI
Click to buy Retail Dashboard in Power BI
The Retail Dashboard in Power BI consists of several pages, each dedicated to a specific area of analysis. Here’s a breakdown of each page and its key features:
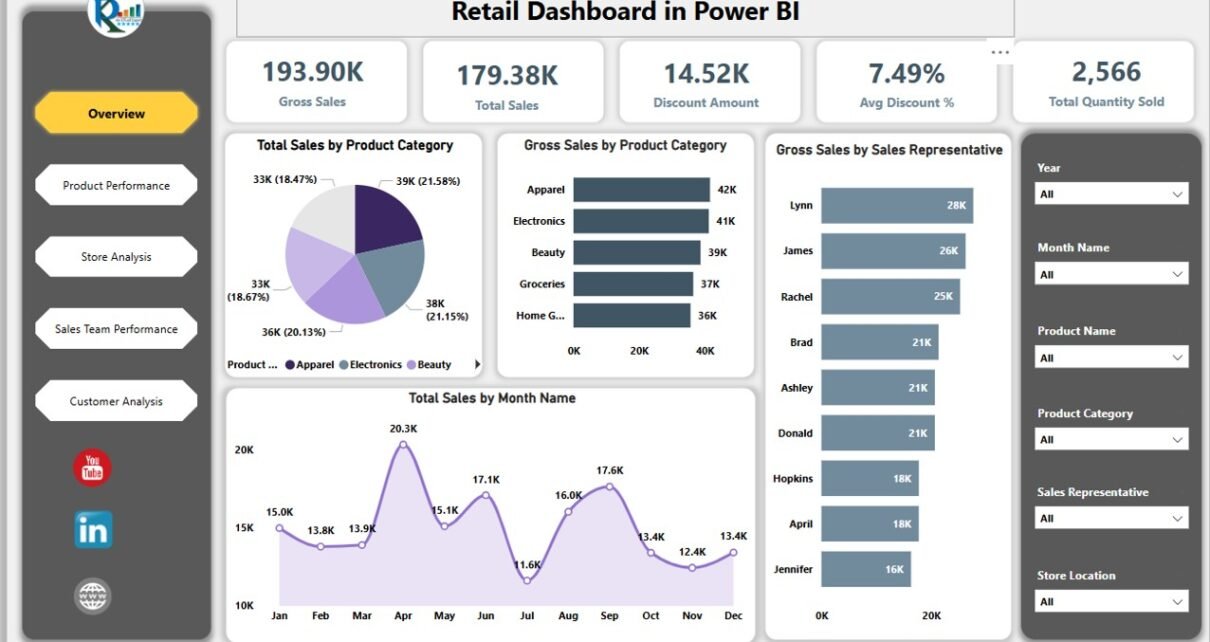
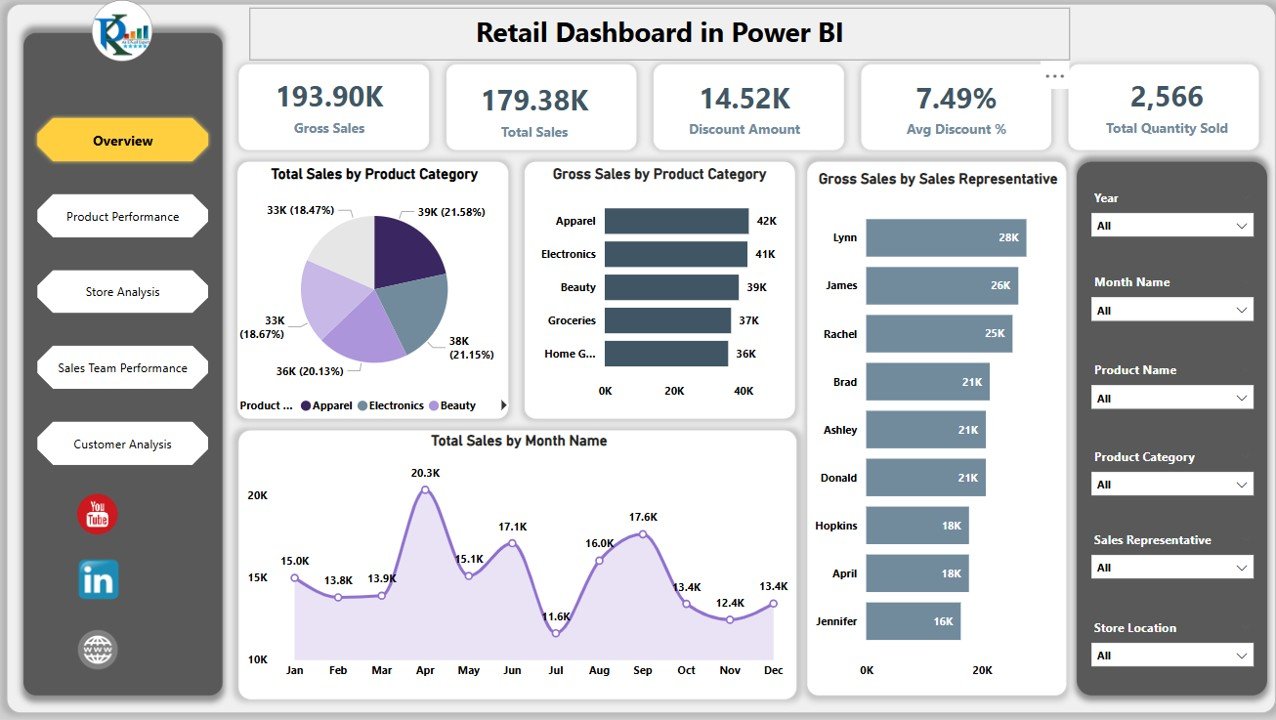
1. Overview Page
The Overview Page provides a snapshot of the overall retail performance. It includes the following elements:
Cards:
- Gross Sale: Displays the total gross sales for the selected period.
- Total Sale: Shows the net sales after returns and discounts.
- Discount Amount: Displays the total discount amount applied across all sales.
- Avg. Discount %: Displays the average discount percentage across all products.
- Total Qty Sold: Shows the total quantity of products sold during the selected period.
Charts:
- Total Sales by Product Category: Visualizes sales distribution across different product categories.
Gross Sales by Product Category: Shows the gross sales for each product category.
- Gross Sales by Sales Representative: Displays sales performance by individual sales reps.
- Total Sales by Month Name: A time-series chart showing total sales per month.
Click to buy Retail Dashboard in Power BI
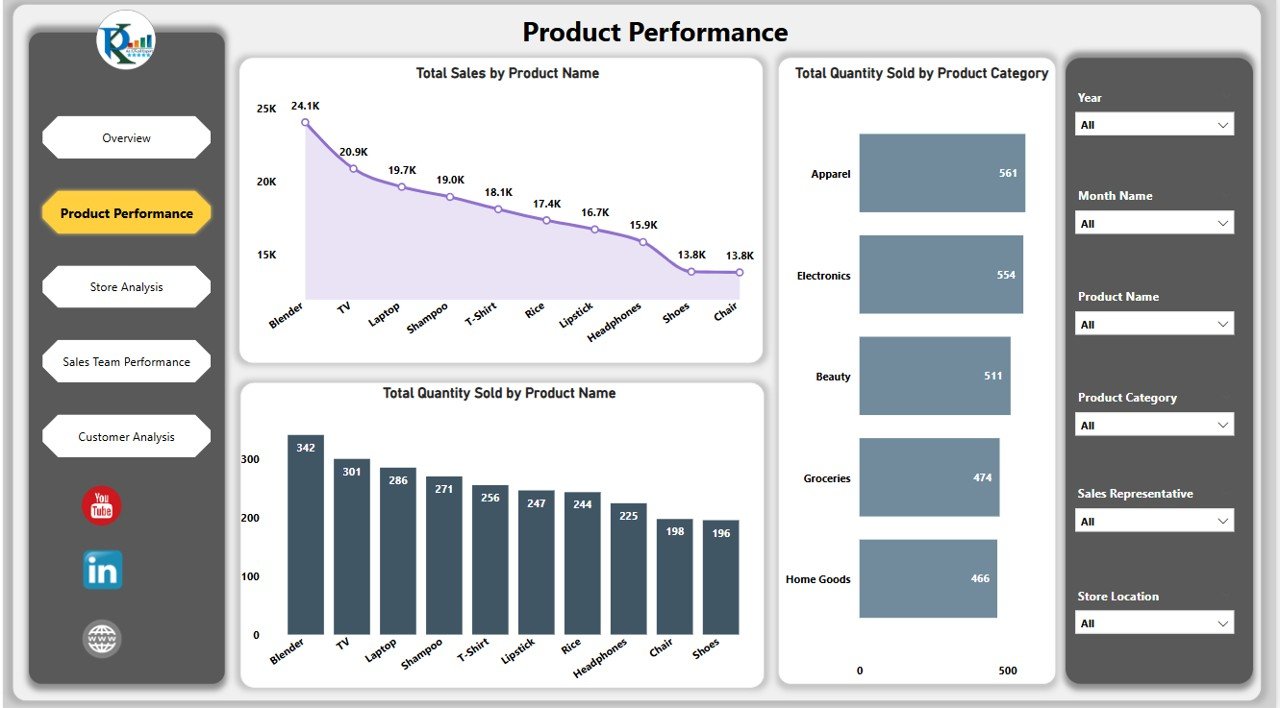
2. Product Performance Page
This page focuses on the performance of individual products. It includes:
Charts:
- Total Sales by Product Name: Shows total sales for each product.
- Total Quantity Sold by Product Category: Displays the total quantity sold for each product category.
- Total Quantity Sold by Product Name: Provides a breakdown of total units sold per product.
3. Store Analysis Page
The Store Analysis Page provides insights into store-level performance. It includes:
Charts:
- Total Sales by Store Location: Displays total sales by store location.
- Avg Discount % by Store Location: Shows the average discount percentage by each store.
- Total Quantity Sold by Store Location: Tracks the quantity of products sold at each store.

Click to buy Retail Dashboard in Power BI
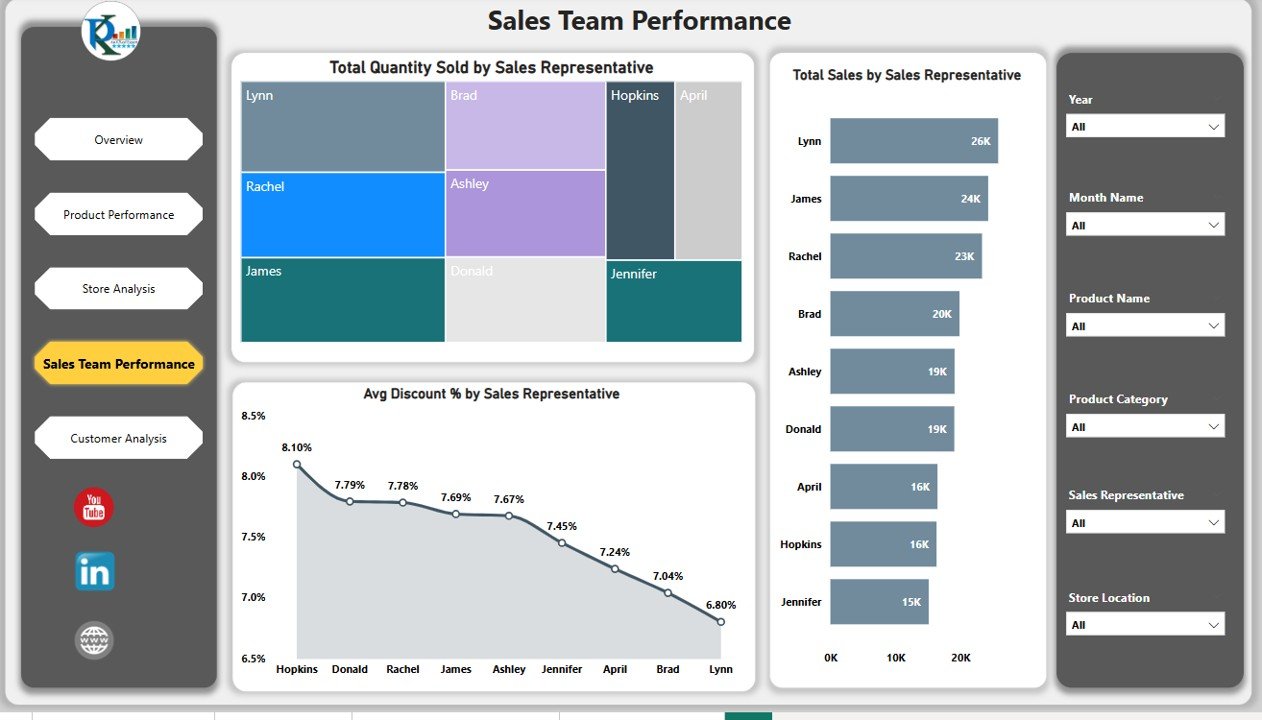
4. Sales Team Performance Page
This page tracks the performance of your sales team. It includes:
Charts:
- Total Quantity Sold by Sales Representative: Shows the total quantity of products sold by each sales representative.
- Total Sales by Sales Representative: Displays the total sales generated by each sales rep.
- Avg Discount % by Sales Representative: Tracks the average discount percentage applied by each sales representative.
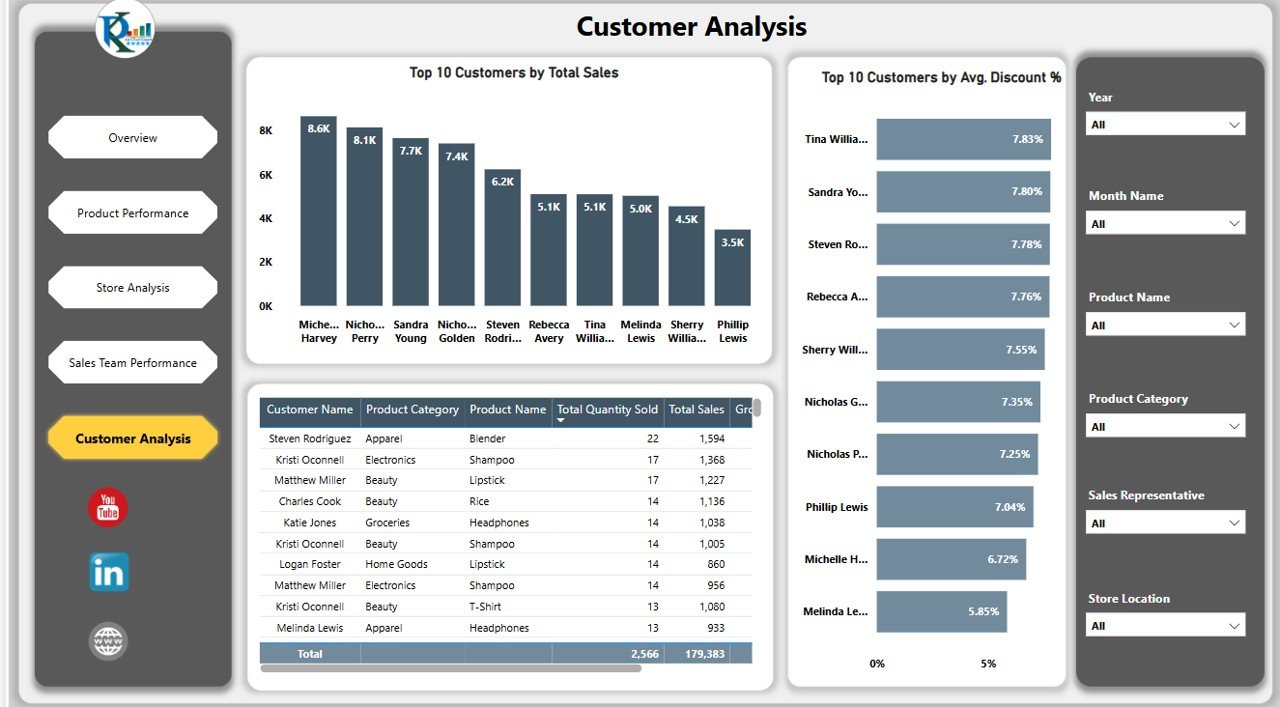
5. Customer Analysis Page
The Customer Analysis Page focuses on your customer base, helping you understand purchasing behavior and identify top customers.
Charts:
- Top 10 Customers by Total Sales: Lists the top 10 customers based on total sales.
- Top 10 Customers by Avg. Discount %: Shows the top 10 customers based on the average discount percentage received.
-
Table: Customer-wise Table: A detailed table showing individual customer data, including total sales and discount percentages.
Click to buy Retail Dashboard in Power BI
Benefits of Using the Retail Dashboard in Power BI
-
Comprehensive Insights: Track all key metrics such as total sales, product performance, store performance, and sales team success in one place.
-
Interactive Visuals: The use of charts and cards allows for easy navigation and a quick understanding of complex data.
-
Customizable: The dashboard can be adapted to meet the unique needs of any retail business by adding or modifying specific KPIs.
-
Data-Driven Decisions: With access to real-time data, businesses can make informed decisions to optimize sales strategies, inventory management, and marketing efforts.
-
Enhanced Performance Tracking: The ability to track individual sales representatives and customer behavior helps identify top performers and opportunities for improvement.
Best Practices for Using the Retail Dashboard in Power BI
Click to buy Retail Dashboard in Power BI
To maximize the effectiveness of the Retail Dashboard in Power BI, consider the following best practices:
-
Regularly Update Data: Ensure that sales, inventory, and customer data are updated regularly to keep the dashboard accurate and relevant.
-
Monitor Key Metrics: Focus on KPIs such as Total Sales, Avg. Discount %, and Top Customers to understand the health of your retail operations.
-
Analyze Trends: Use the Total Sales by Month chart to identify seasonal trends, and plan your marketing and sales strategies accordingly.
-
Track Sales Representative Performance: Regularly monitor the Sales Team Performance Page to assess individual performance and provide targeted training.
-
Review Store-Level Data: Use the Store Analysis Page to compare performance across different store locations and implement strategies for underperforming areas.
Conclusion
The Retail Dashboard in Power BI is an essential tool for retail businesses looking to track and analyze their sales data, customer behavior, and employee performance. With its comprehensive features and visual insights, this dashboard enables businesses to make informed decisions, improve operational efficiency, and drive growth. Whether you are tracking sales trends, monitoring store performance, or analyzing customer data, the Retail Dashboard in Power BI provides all the tools needed for successful retail management.
Frequently Asked Questions (FAQs)
Click to buy Retail Dashboard in Power BI
1. What key metrics are tracked in the Retail Dashboard?
The dashboard tracks KPIs such as Total Sales, Discount Amount, Product Performance, Sales Team Performance, and Customer Analysis.
2. How often should I update the dashboard?
It’s recommended to update the dashboard regularly—daily or weekly—depending on your sales volume to ensure that the data is accurate and up-to-date.
3. Can I customize the dashboard to add additional KPIs?
Yes, the dashboard is customizable. You can add new KPIs, modify existing ones, and create custom reports based on your specific retail business needs.
4. How does the customer analysis help my business?
The Customer Analysis Page helps you identify top customers, track purchasing behavior, and analyze the effectiveness of discounts and promotions.
5. Can I track the performance of multiple stores?
Yes, the Store Analysis Page allows you to track sales and performance data by store location, helping you identify areas for improvement.
Visit our YouTube channel to learn step-by-step video tutorials
Youtube.com/@NeotechNavigators
Watch the step-by-step video Demo:
Click to buy Retail Dashboard in Power BI