In the healthcare industry, data-driven decisions are essential for improving patient care, managing costs, and optimizing operations. The Healthcare Dashboard in Power BI provides a ready-to-use solution for healthcare providers, offering powerful insights into patient statistics, financial performance, and treatment outcomes. This dashboard helps healthcare organizations monitor key metrics in real-time, enabling improved decision-making, better resource allocation, and enhanced patient satisfaction.
What is the Healthcare Dashboard in Power BI?
The Healthcare Dashboard in Power BI is a dynamic tool designed to track and visualize essential healthcare metrics. With its interactive charts, slicers, and cards, this dashboard makes it easy to access insights related to patient visits, treatment costs, doctor performance, patient satisfaction, and more. Whether you are a healthcare manager, administrator, or financial analyst, this dashboard empowers you to make informed, data-driven decisions.
Key Features of the Healthcare Dashboard in Power BI
Click to buy Healthcare Dashboard in Power BI
The Healthcare Dashboard in Power BI is designed with multiple tabs that display a variety of charts and tables. Each sheet focuses on a specific aspect of healthcare performance. Below are the key features of each sheet:
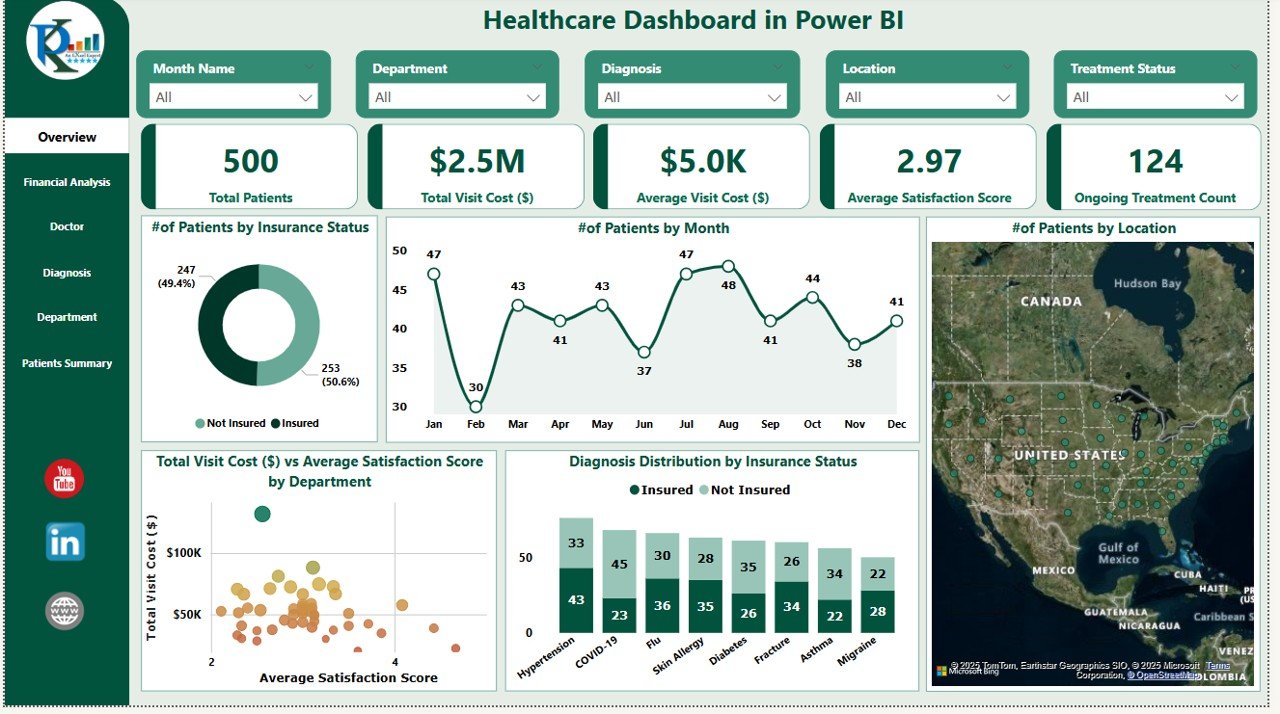
1. Overview Sheet Tab
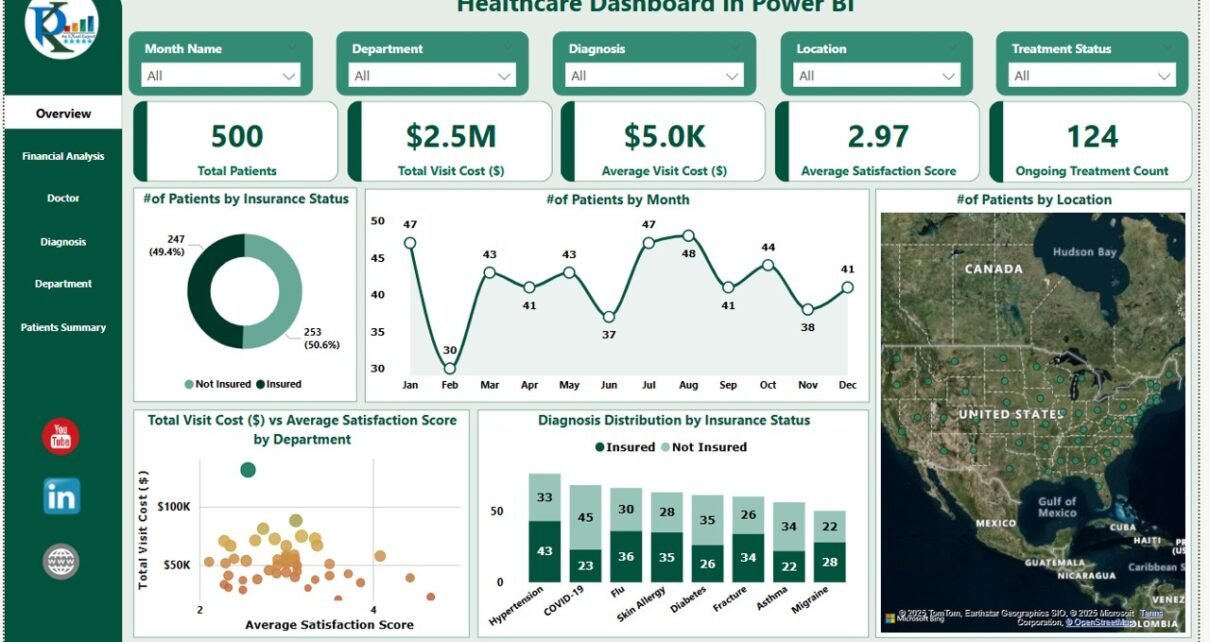
The Overview sheet provides a high-level summary of your healthcare data with various charts, slicers, and cards. This sheet includes:
Cards:
- Total Patient: Displays the total number of patients.
- Total Visit Cost: Shows the total cost of patient visits.
- Avg. Total Visit Cost: Displays the average visit cost per patient.
- Avg. Satisfaction Score: Shows the average patient satisfaction score.
- Ongoing Treatment: Displays the number of patients currently undergoing treatment.
Charts:
- # of Patients by Insurance Status: Displays the distribution of patients by their insurance status.
- # of Patients by Month: Tracks the number of patients attending each month.
- # of Patients by Location: Visualizes patient distribution by location.
- Total Visit Cost ($) vs Average Satisfaction Score by Department: Shows the relationship between treatment costs and satisfaction scores by department.
- Diagnosis Distribution by Insurance Status: Displays the distribution of diagnoses based on insurance status.
Click to buy Healthcare Dashboard in Power BI
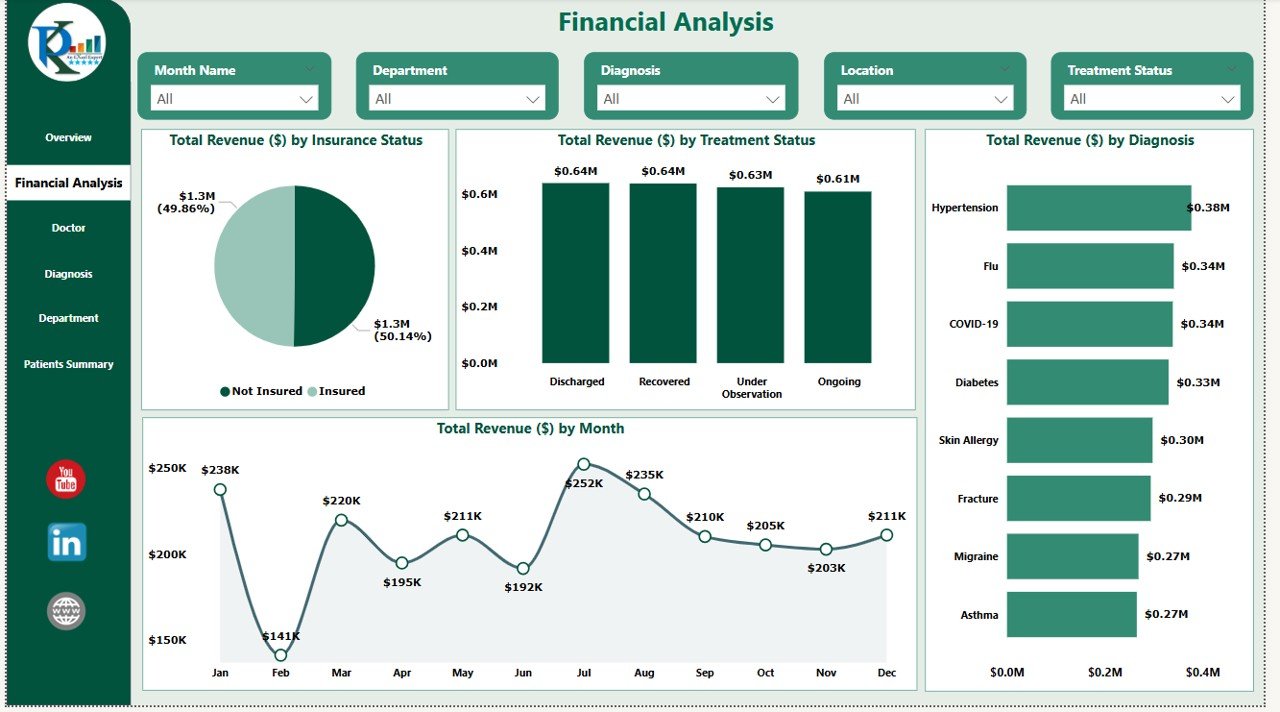
2. Financial Analysis Page
The Financial Analysis page focuses on revenue-related metrics. This sheet includes:
Charts:
- Total Revenue ($) by Insurance Status: Displays total revenue for each insurance status group.
- Total Revenue ($) by Treatment Status: Shows revenue generated by the status of treatments.
- Total Revenue ($) by Diagnosis: Displays revenue by diagnosis type.
- Total Revenue ($) by Month: Tracks monthly revenue trends.
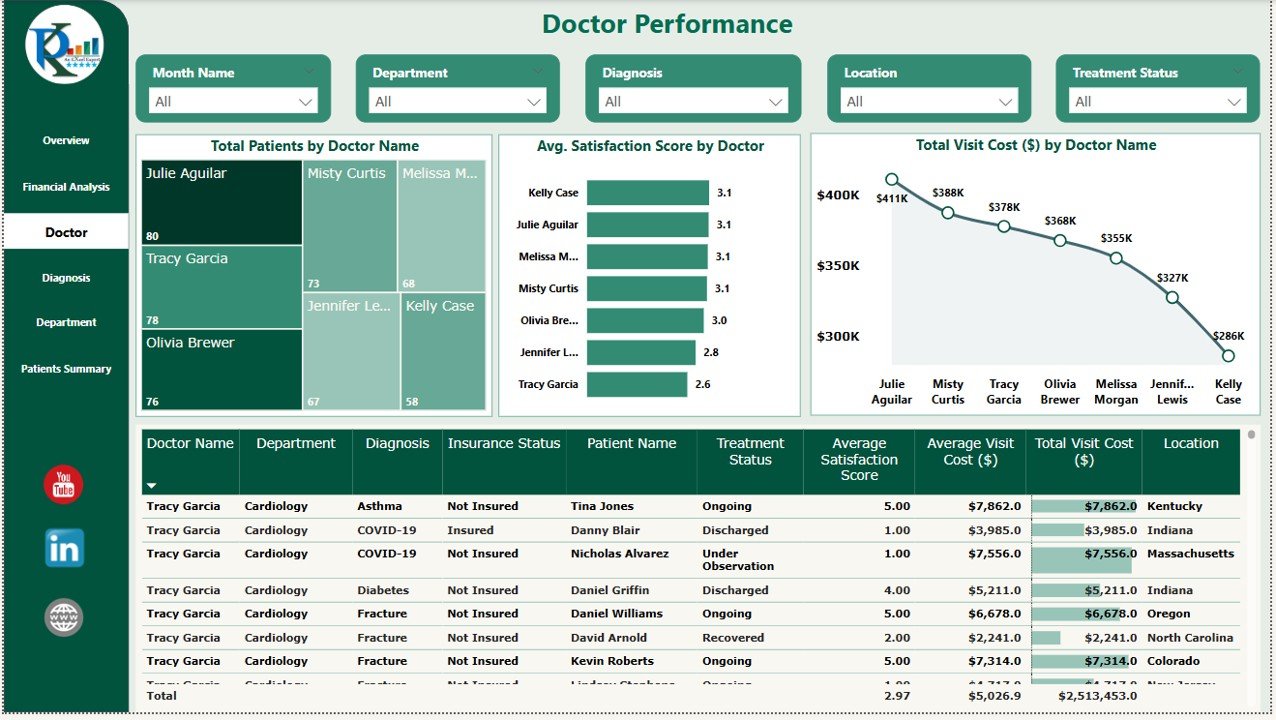
3. Doctor Page
The Doctor Page focuses on tracking doctor-related metrics. Key elements include:
Charts:
- Total Patients by Doctor Name: Displays the total number of patients treated by each doctor.
- Avg. Satisfaction Score by Doctor: Shows the average satisfaction score for each doctor.
- Total Visit Cost ($) by Doctor Name: Displays total visit cost by doctor.
-
Table:Doctor Information: Contains detailed information about each doctor, such as their specialty and experience.
Click to buy Healthcare Dashboard in Power BI
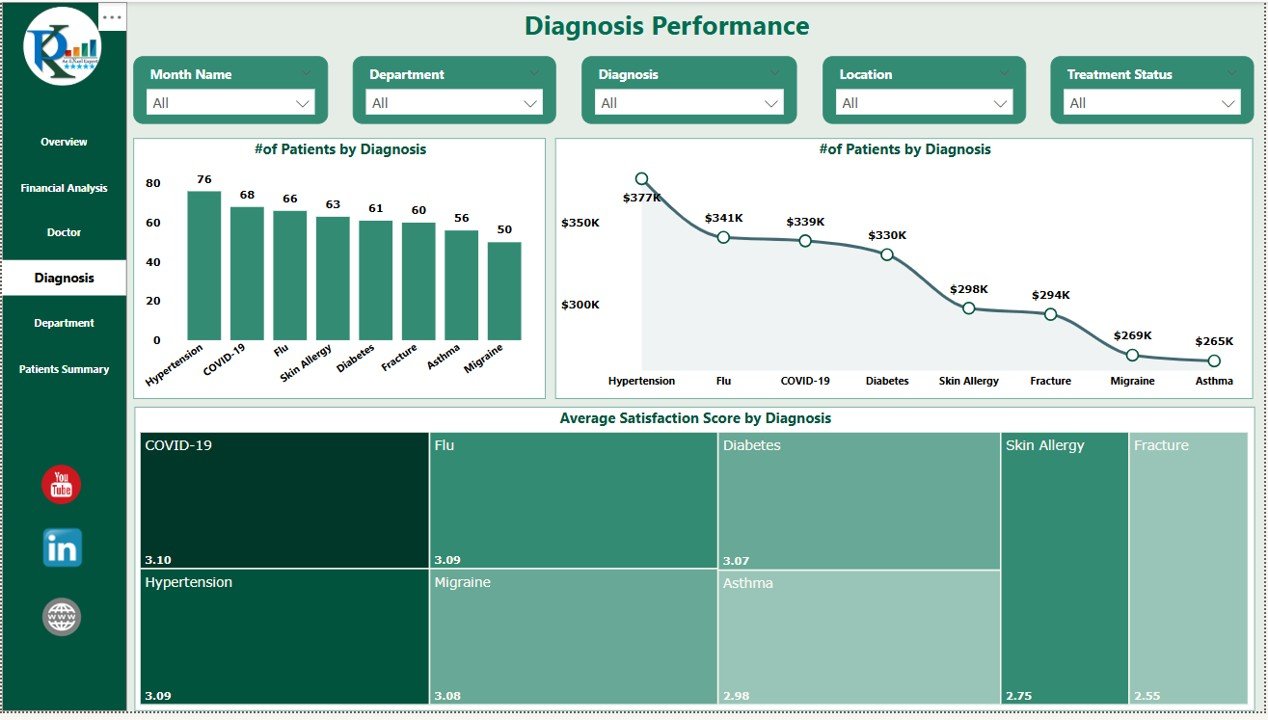
4. Diagnosis Page
The Diagnosis Page analyzes patient data based on different diagnoses. This sheet includes:
Charts:
- # of Patients by Diagnosis: Displays the number of patients categorized by diagnosis.
- Average Satisfaction Score by Diagnosis: Tracks satisfaction scores based on diagnosis types.
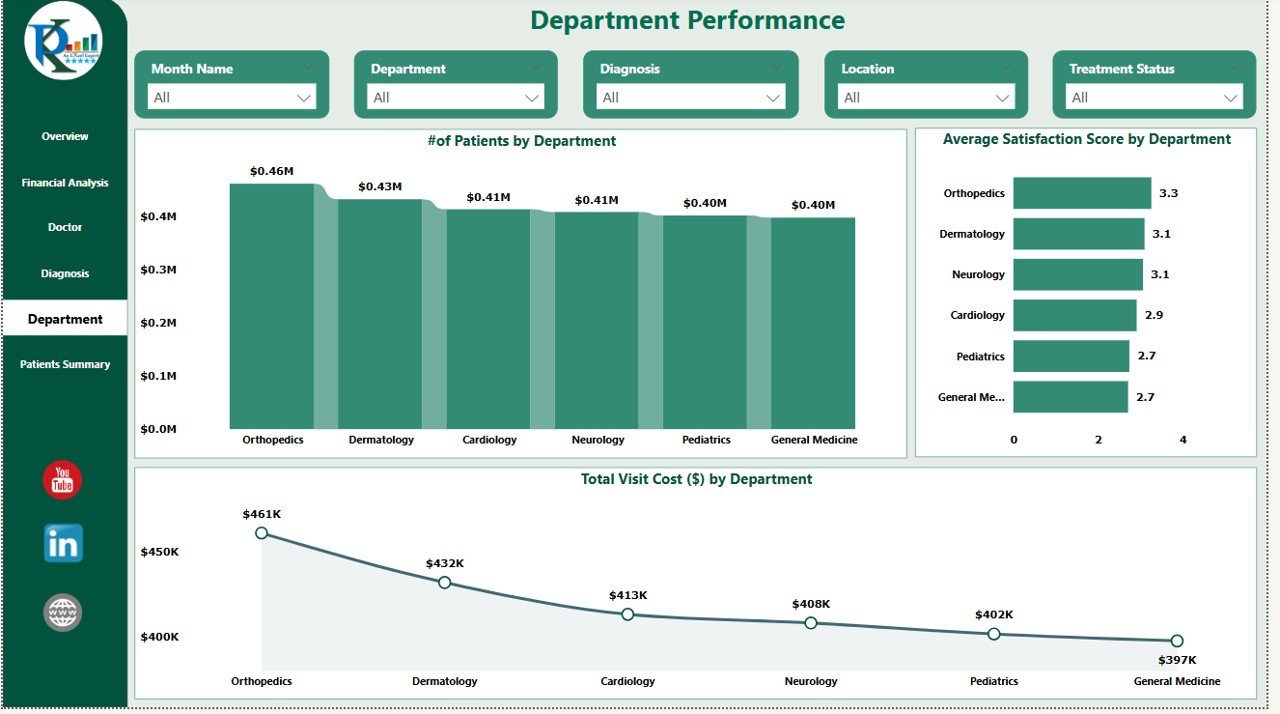
5. Department Page
The Department Page offers insights into healthcare performance by department. It includes:
Charts:
- # of Patients by Department: Displays the number of patients per department.
- Average Satisfaction Score by Department: Tracks satisfaction scores for each department.
- Total Visit Cost ($) by Department: Displays the total cost for each department.
Click to buy Healthcare Dashboard in Power BI
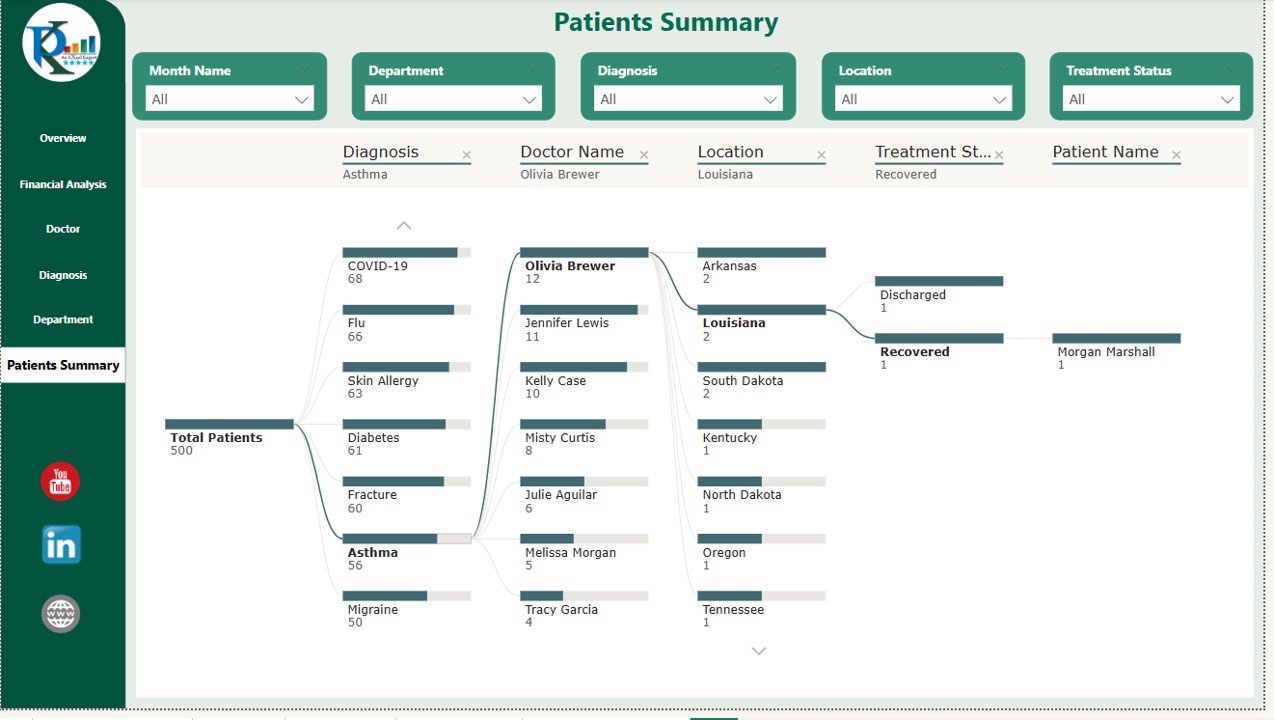
6. Patients Summary Page
The Patients Summary page provides an in-depth analysis of individual patient data. It includes:
Chart:
- Decomposition Tree (Patient-wise Summary): A detailed breakdown of each patient’s data, including treatment, cost, satisfaction, and diagnosis.
How the Healthcare Dashboard Helps Improve Operations
The Healthcare Dashboard in Power BI provides valuable insights into various aspects of healthcare operations, helping organizations make informed decisions. Here’s how it helps improve healthcare performance:
-
Track Patient Demographics and Treatment Costs: Monitor the number of patients, their insurance status, and treatment costs to optimize resource allocation and improve cost management.
-
Monitor Financial Performance: Analyze revenue based on insurance status, treatment status, and diagnosis to ensure profitability and cost-effectiveness.
-
Evaluate Doctor Performance: Track patient satisfaction and treatment costs by doctor to identify top performers and areas for improvement.
-
Analyze Patient Satisfaction: Use satisfaction scores to gauge the quality of care provided and identify areas for improvement.
-
Improve Department Efficiency: Analyze department-level data to identify trends in patient volume, satisfaction, and costs, helping you streamline operations.
Advantages of Using the Healthcare Dashboard in Power BI
Click to buy Healthcare Dashboard in Power BI
The Healthcare Dashboard in Power BI offers several advantages to healthcare providers and administrators:
-
Real-Time Insights: The dashboard automatically updates in real time, ensuring that you have access to the most current data.
-
Comprehensive Reporting: By integrating multiple departments, diagnoses, and performance metrics, the dashboard provides a holistic view of healthcare operations.
-
Data-Driven Decisions: With powerful data visualizations, healthcare providers can make informed decisions that improve patient care, reduce costs, and increase efficiency.
-
Customization: The dashboard can be customized to suit the specific needs of your healthcare organization, including adding new charts or metrics.
-
Interactive and User-Friendly: The interactive charts and slicers make it easy to explore data from different angles, empowering users at all levels to gain valuable insights.
Best Practices for Using the Healthcare Dashboard in Power BI
To make the most of the Healthcare Dashboard in Power BI, follow these best practices:
-
Regular Data Entry: Ensure that patient, financial, and treatment data is entered consistently and accurately to maintain the dashboard’s reliability.
-
Analyze Trends: Regularly review trends and patterns in patient demographics, treatment costs, and satisfaction scores to identify areas for improvement.
-
Set KPIs: Use the dashboard to set performance targets for departments, doctors, and treatment areas to drive continuous improvement.
-
Engage Stakeholders: Share the dashboard with key stakeholders to align everyone in the organization around common goals.
-
Use Decomposition Tree for Patient Analysis: The Decomposition Tree is a powerful tool for understanding individual patient data and can be used to identify specific treatment challenges.
Conclusion
Click to buy Healthcare Dashboard in Power BI
The Healthcare Dashboard in Power BI is an invaluable tool for healthcare providers looking to enhance patient care, optimize operations, and improve financial performance. With its comprehensive set of features, real-time insights, and customizable layout, the dashboard helps organizations track critical metrics, identify trends, and make data-driven decisions. Whether you are a healthcare manager, administrator, or financial analyst, this dashboard offers everything you need to enhance healthcare operations and improve patient outcomes.
Frequently Asked Questions (FAQs)
1. What key metrics are tracked in the Healthcare Dashboard?
The dashboard tracks metrics such as total patients, visit costs, satisfaction scores, doctor performance, diagnoses, and revenue by various factors (insurance status, treatment status, etc.).
2. Can I customize the Healthcare Dashboard to fit my specific needs?
Yes, the dashboard is highly customizable. You can modify the charts, add new metrics, and adjust the layout to fit the unique needs of your healthcare organization.
3. How do I enter data into the Healthcare Dashboard?
Data is entered into Power BI through connected data sources or manual entry. Ensure that all patient, financial, and treatment data is regularly updated to keep the dashboard accurate.
4. How can the dashboard help with financial performance analysis?
The Financial Analysis page allows you to track revenue by various factors such as insurance status, treatment status, diagnosis, and month, providing insights into profitability and cost management.
5. Can the Healthcare Dashboard help with patient care quality?
Yes, the dashboard tracks patient satisfaction scores across departments, doctors, and diagnoses, helping identify areas where patient care can be improved.
Visit our YouTube channel to learn step-by-step video tutorials
Watch the step-by-step video Demo:
Click to buy Healthcare Dashboard in Power BI