In today’s data-driven business world, marketers cannot rely on guesswork. They need actionable insights, real-time visibility, and performance clarity across all campaigns. That’s where a Marketing Dashboard in Power BI comes into play.
Whether you’re a digital marketing manager, a campaign analyst, or a business owner, this interactive and visually rich dashboard helps you track, compare, and improve every marketing effort.
In this article, we’ll break down everything you need to know about this powerful tool, its components, key benefits, best practices, and even opportunities for improvement.
What is a Marketing Dashboard in Power BI?
A Marketing Dashboard in Power BI is a prebuilt, interactive report that pulls marketing data from sources like Excel, Google Ads, social media platforms, or CRMs and visualizes it in real time. It enables users to analyze campaign metrics such as budget, spend, ROI, conversion rate, and more—all within a single view.
Power BI helps marketers:
-
Track KPIs over time
-
Identify winning campaigns
-
Spot underperforming channels
-
Optimize spend and targeting
The dashboard is divided into multiple pages, each designed to focus on a specific performance area.
Key Pages in the Marketing Dashboard
Click to buy Marketing Dashboard in Power BI
Let’s explore the different pages included in this Power BI Marketing Dashboard and what each of them offers:
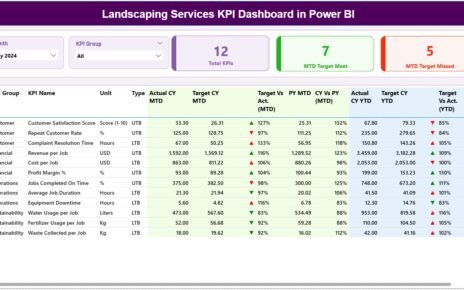
Overview Page
This is your command center—the first screen that offers a high-level snapshot of marketing performance.
KPIs Cards:
-
Total Budget – Sum of allocated budget across all campaigns.
-
Total Spend – Total amount actually spent.
-
Total Revenue – Earnings generated from campaigns.
-
Conversion Rate (%) – Ratio of conversions to total interactions.
-
ROI (%) – Return on investment percentage.
Charts:
-
Campaigns by Manager – Who’s running the most campaigns?
-
Campaigns by Channel – Breakdown by email, search, social, etc.
-
Campaigns by Type – Insights by campaign formats (e.g., webinar, product launch).
-
Campaigns by Month – Seasonal or monthly trends.

Click to buy Marketing Dashboard in Power BI
This page helps you quickly spot performance gaps or growth opportunities.
Budget and Spend Analysis Page
This page provides a deep dive into how your marketing dollars are being used.
Charts Include:
-
Budget vs. Spend by Campaign Manager – Who’s managing budget most effectively?
-
Budget vs. Spend by Campaign Type – Are webinars more cost-efficient than email campaigns?
-
Total Clicks by Channel – Which channels are driving user engagement?
-
Budget vs. Spend by Month – Helps identify time-based budget fluctuations.
This section supports cost control and planning accuracy.

Click to buy Marketing Dashboard in Power BI
Conversion and Revenue Analysis Page
Conversions matter most when it comes to results. This page helps evaluate efficiency.
Charts Include:
-
Conversion Rate by Manager – Analyze the impact of campaign ownership.
-
Conversion Rate by Type – Learn which types convert best.
-
Conversion Rate by Channel – Discover channel effectiveness.
You can identify what works best, replicate success, and adjust your targeting strategies.

Click to buy Marketing Dashboard in Power BI
ROI Revenue Analysis Page
ROI (Return on Investment) is the north star metric for marketers.
Charts Display:
-
ROI (%) by Manager
-
ROI (%) by Campaign Type
-
ROI (%) by Channel
-
ROI (%) by Month
This page allows stakeholders to see where money turns into value and which efforts need refinement.

Details Page with Drillthrough
This page offers granular information about each campaign. Using Power BI’s drillthrough functionality, users can click on charts to view detailed tables showing:
-
Campaign name
-
Budget
-
Spend
-
Clicks
-
Revenue
-
Status
-
Owner
You can go from overview to detailed analysis in a click.

Click to buy Marketing Dashboard in Power BI
Advantages of Using a Marketing Dashboard in Power BI
A Marketing Dashboard offers immense value. Let’s highlight the most important benefits:
-
Real-Time Insights: View up-to-date campaign data anytime.
-
Visual Clarity: Easy-to-understand visuals like bar charts, KPIs, and heatmaps.
-
Custom Filtering: Use slicers for month, campaign type, or manager to tailor your view.
-
Better Decision Making: Compare ROI across months or channels to guide future investments.
-
Time Efficiency: Save hours compared to manual reporting in Excel or PowerPoint.
-
Cross-Team Alignment; Share dashboards with sales, finance, and C-level teams easily.
Opportunities for Improvement in the Marketing Dashboard
Even a powerful dashboard can be made better. Here are some areas for improvement:
-
Add Forecasting Capabilities: Predict next month’s spend and conversions using Power BI’s AI features.
-
Integrate Social Media Sentiment: Pull Twitter or Facebook sentiment to correlate campaign mood with performance.
-
Include A/B Testing Results: Track which variations perform better in real-time.
-
Embed Automated Alerts; Notify campaign managers when spend exceeds threshold or ROI drops.
-
Incorporate Funnel Analysis: Map user journey from first click to final conversion visually.
By adding these enhancements, your dashboard becomes even more insightful and proactive.
Best Practices for Creating a Marketing Dashboard in Power BI
Click to buy Marketing Dashboard in Power BI
Creating a successful marketing dashboard goes beyond charts. Follow these best practices:
1. Focus on Relevant KPIs
Only show what matters. Avoid clutter. Stick to metrics that support goals—like leads, ROI, spend, and revenue.
2. Use Slicers and Filters
Add slicers for campaign type, time period, or region. This enables tailored views for different users.
3. Keep Visuals Simple
Use clear bar or column charts. Avoid pie charts unless absolutely necessary. Power BI offers intuitive visuals—use them wisely.
4. Automate Data Updates
Connect to live sources (e.g., Excel, SQL, or Google Sheets) and set auto-refresh to keep the dashboard always current.
5. Align with Stakeholders
Before finalizing your dashboard, get feedback from marketing leads, sales reps, and decision-makers. Ensure it answers their key questions.
Why Choose Power BI for Marketing Dashboards?
Click to buy Marketing Dashboard in Power BI
You might wonder—why Power BI and not another tool?
Here’s why Power BI is perfect for marketing teams:
-
Microsoft Integration – Works seamlessly with Excel, Teams, and SharePoint.
-
Drag-and-Drop Interface – No coding required to build powerful visuals.
-
Cloud-Based Sharing – Share reports with your team or embed them in portals.
-
Cost-Effective – Offers powerful analytics at a lower price than most BI tools.
-
Strong Community Support – Thousands of free templates, tutorials, and forums.
Conclusion
A Marketing Dashboard in Power BI is more than just a report—it’s a strategic weapon for marketers. From tracking budgets and measuring conversions to uncovering ROI trends, it empowers you to make smarter, faster, and more profitable decisions.
When used correctly, this dashboard not only saves time but also boosts team productivity and campaign effectiveness. And with Power BI’s flexibility, you can tailor your dashboard exactly the way your team needs it.
If you haven’t yet started using a marketing dashboard in Power BI, now is the perfect time to make the switch.
Frequently Asked Questions (FAQs)
1. What data sources can I use with a Power BI marketing dashboard?
You can connect Excel files, Google Analytics, Facebook Ads, HubSpot, SQL databases, and more.
2. Can I track ROI in real-time with this dashboard?
Yes. By connecting live data sources, you can monitor ROI as campaigns progress.
3. Do I need coding skills to build this dashboard?
No. Power BI uses a user-friendly, drag-and-drop interface. Basic Excel knowledge is enough to start.
4. How often should I update the dashboard?
If connected to live sources, it auto-refreshes. Otherwise, update it weekly or monthly based on your reporting needs.
5. Can I share the dashboard with my team?
Yes. You can publish it on Power BI Service and control who can view or edit the report.
6. Is it possible to customize the visuals?
Absolutely. You can use Power BI’s visual gallery or import custom visuals from the marketplace.
7. Can I export the report to PDF or PowerPoint?
Yes. Power BI allows export options including PDF snapshots and PowerPoint slide decks.
Visit our YouTube channel to learn step-by-step video tutorials
Watch the step-by-step video Demo:
Click to buy Marketing Dashboard in Power BI