Content marketing has become one of the most powerful tools for businesses today. Copywriting & Content Creation KPI Dashboard in Excel Brands rely on copywriting and content creation to attract customers, improve brand awareness, and boost conversions. However, without the right system in place, it is hard to measure the true impact of these efforts. That’s where a Copywriting & Content Creation KPI Dashboard in Excel plays a crucial role.
In this article, we will explore everything you need to know about this dashboard—its features, benefits, structure, and implementation. We will also share advantages, best practices, and frequently asked questions to help you use this tool effectively.
Click to Purchase Copywriting & Content Creation KPI Dashboard in Excel
What Is a Copywriting & Content Creation KPI Dashboard in Excel?
A Copywriting & Content Creation KPI Dashboard is a structured Excel template designed to track, monitor, and analyze the performance of content marketing activities. It summarizes data into meaningful KPIs (Key Performance Indicators) that help writers, marketers, and decision-makers evaluate the effectiveness of their strategies.
Instead of reviewing endless spreadsheets or relying on guesswork, this dashboard provides clear insights into:
-
Monthly and yearly performance trends.
-
Actual vs. target achievements.
-
Comparison with previous year data.
-
Strengths and weaknesses in content performance.
With this tool, copywriters and content teams can optimize campaigns, allocate resources better, and prove ROI (Return on Investment) to stakeholders.
Key Features of the Copywriting & Content Creation KPI Dashboard
This dashboard has been designed with seven structured worksheets, each serving a unique purpose. Let’s break them down:
1. Home Sheet

-
Works as the index page for the dashboard.
-
Includes six navigation buttons that allow users to jump to any sheet quickly.
-
Improves user experience by saving time and avoiding manual searching.
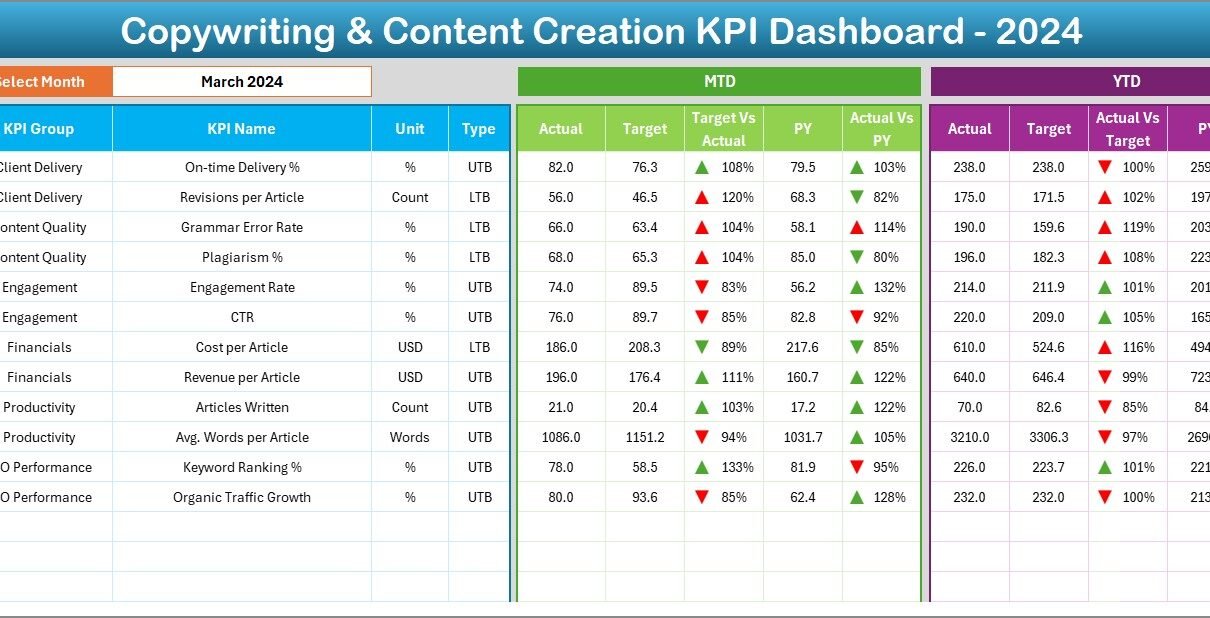
2. Dashboard Sheet Tab

-
Acts as the main reporting page.
-
Displays all KPI results in a visually appealing format.
-
Includes a drop-down menu at cell D3 to select the month.
-
Once you choose a month, the dashboard automatically updates the numbers.
Here’s what you can view on this page:
-
MTD (Month-to-Date) Data: Shows actual vs. target vs. previous year with conditional formatting.
-
YTD (Year-to-Date) Data: Displays actual vs. target vs. previous year with visual arrows (up/down) for better comparison.
-
Target vs. Actual Analysis: Helps you track where your content strategy is succeeding or falling short.
3. KPI Trend Sheet Tab

-
Focuses on individual KPI analysis.
-
A drop-down in cell C3 allows you to select the KPI name.
-
Provides details such as:
-
KPI Group
-
Unit of measurement
-
KPI Type (Upper the Better / Lower the Better)
-
Formula and Definition
-
-
Includes trend charts for MTD and YTD data (Actual, Target, and Previous Year).
-
Ideal for spotting performance patterns over time.
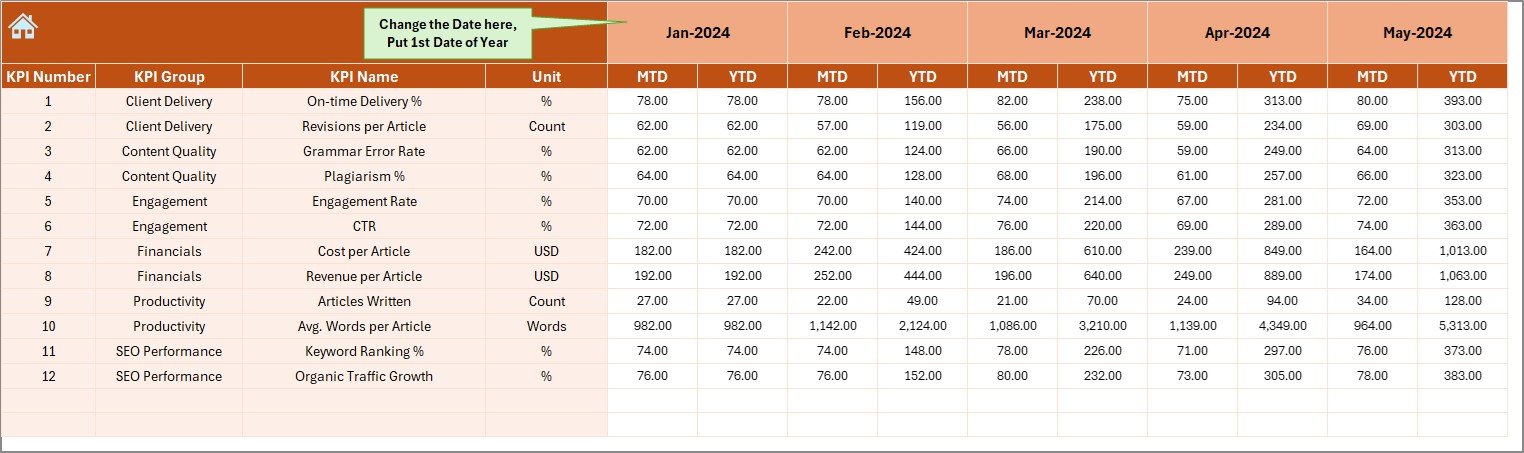
4. Actual Numbers Input Sheet
-
This is where you enter real performance data.
-
Includes MTD and YTD input fields.
-
At cell E1, you can select the starting month of the year.
-
Provides flexibility for businesses that operate on different fiscal years.
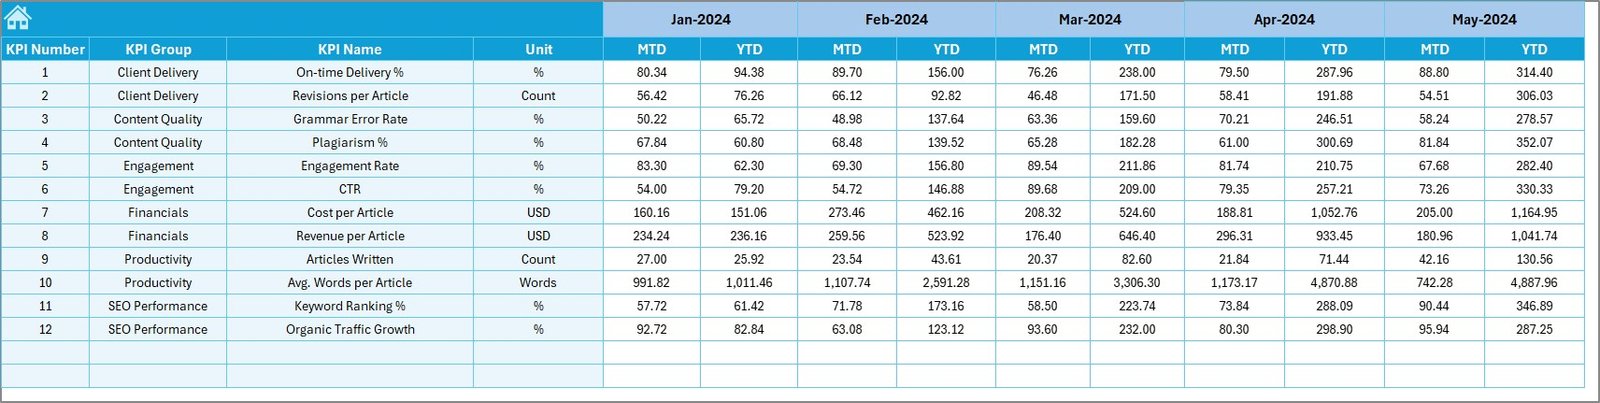
5. Target Sheet Tab
-
Used to set performance benchmarks.
-
You can input monthly and yearly targets for each KPI.
-
Helps align team goals with organizational objectives.
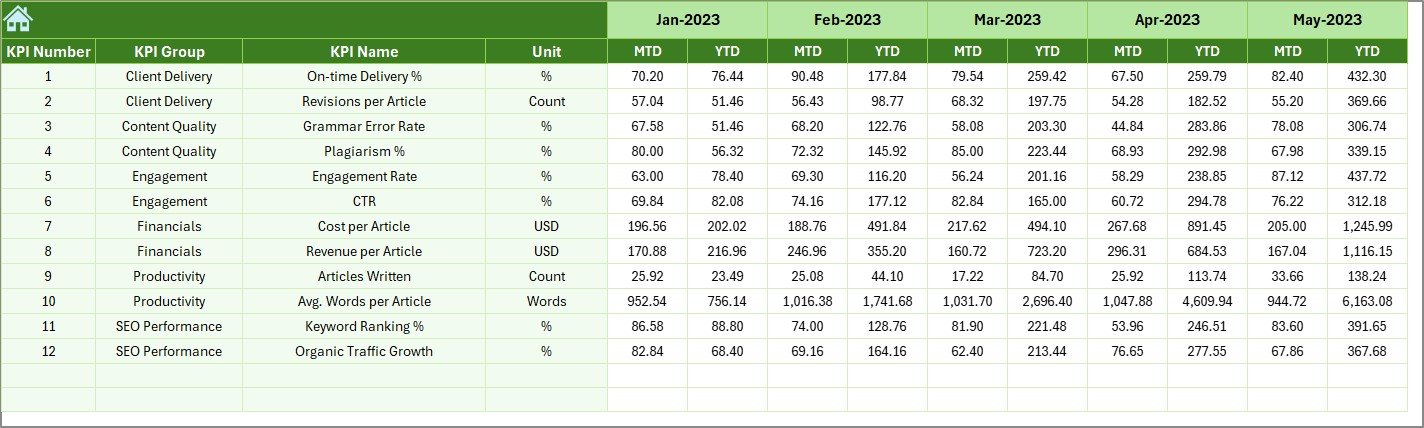
6. Previous Year Numbers Sheet
-
Stores data from the previous year.
-
Useful for year-over-year comparisons.
-
Makes it easier to track long-term improvements.
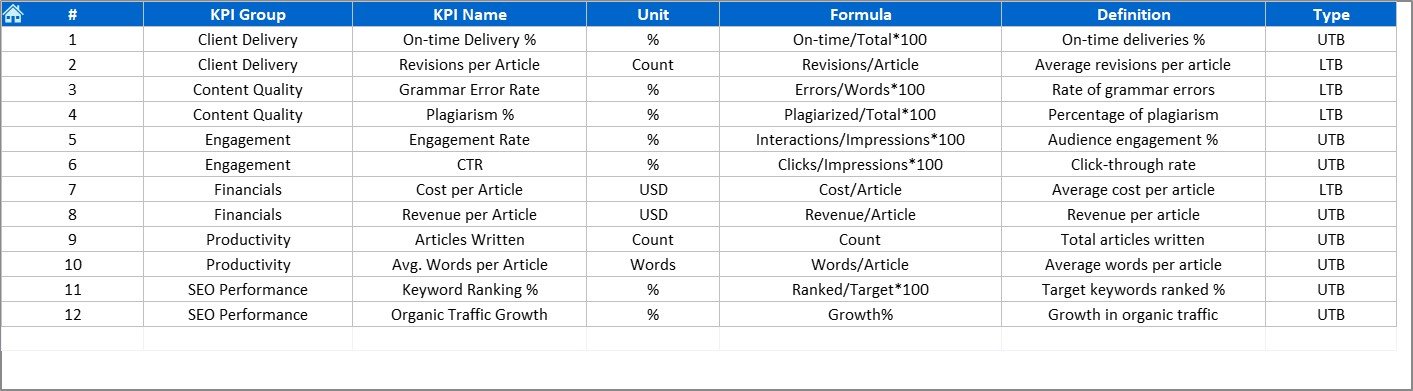
7. KPI Definition Sheet
-
Works as a reference sheet.
-
Contains all KPI names, groups, formulas, units, and definitions.
-
Ensures that everyone in the organization understands metrics in the same way.
Why Do You Need a KPI Dashboard for Copywriting & Content Creation?
Content creation involves more than writing blogs or posts. Businesses need to measure outcomes such as engagement, leads, and sales. Without measurable KPIs, teams may waste time and money on ineffective strategies.
Click to Purchase Copywriting & Content Creation KPI Dashboard in Excel
A KPI Dashboard in Excel ensures:
-
Clarity: Everyone knows what success looks like.
-
Consistency: Data is updated regularly for accuracy.
-
Productivity: Teams can focus on strategies that deliver results.
-
Decision-making: Leaders can identify gaps and optimize campaigns faster.
Advantages of a Copywriting & Content Creation KPI Dashboard
Implementing this dashboard brings multiple benefits:
✅ Centralized Data: All performance indicators are in one place.
✅ Time-Saving: Automated updates reduce manual work.
✅ Customizable: Add or remove KPIs based on your unique goals.
✅ Data-Driven Insights: Clear comparisons between actual, target, and past results.
✅ Visual Storytelling: Conditional formatting and charts make data easy to understand.
✅ Performance Tracking: Both MTD and YTD insights for precise reporting.
✅ Goal Alignment: Keeps writers and marketers aligned with business objectives.
Common KPIs for Copywriting & Content Creation
To make your dashboard more effective, include KPIs such as:
-
Website Traffic: Number of visitors generated by content.
-
Conversion Rate: Leads or sales from written content.
-
Bounce Rate: Percentage of visitors leaving after one page.
-
Engagement Rate: Likes, comments, and shares on posts.
-
Click-Through Rate (CTR): Effectiveness of CTAs.
-
Content Production Rate: Number of blogs, ads, or social posts created per month.
-
Keyword Rankings: Visibility of SEO-driven content.
-
Return on Content Investment (ROCI): Revenue generated compared to content cost.
Best Practices for Using the KPI Dashboard
To get the best results from your dashboard, follow these practices:
-
📊 Choose Relevant KPIs: Focus on metrics that impact your business goals.
-
📅 Update Data Regularly: Enter actual numbers every week or month.
-
🎯 Set Realistic Targets: Avoid unrealistic benchmarks that demotivate the team.
-
🔄 Compare Trends: Use year-over-year data to evaluate progress.
-
🖼️ Use Visuals: Highlight insights with charts and arrows for clarity.
-
👥 Collaborate: Share the dashboard with writers, editors, and marketers for joint accountability.
-
⚡ Automate Where Possible: Use Excel formulas and conditional formatting to reduce manual errors.
Opportunities for Improvement in Content Dashboards
While this Excel dashboard is highly effective, there are areas for growth:
-
Integration with Tools: Connect with Google Analytics or SEO tools for live data.
-
Automation: Add macros or VBA to automate repetitive tasks.
-
Visualization Upgrade: Convert the dashboard into a Power BI report for advanced visuals.
-
Mobile-Friendly Version: Create a simplified sheet for on-the-go tracking.
-
AI Insights: Use predictive analytics to forecast performance.
How to Implement the Dashboard Step by Step
-
Download the Template: Get the Excel file ready.
-
Set Up KPI Definitions: Fill in the KPI Definition sheet with all relevant metrics.
-
Enter Previous Year Data: Add last year’s performance to the Previous Year sheet.
-
Add Targets: Define monthly and yearly goals in the Target sheet.
-
Input Actual Data: Update MTD and YTD figures in the Actual Numbers sheet.
-
Analyze Dashboard: Review the Dashboard and KPI Trend pages to track performance.
-
Adjust Strategy: Take action based on gaps between target and actual results.
Conclusion
A Copywriting & Content Creation KPI Dashboard in Excel is more than a reporting tool—it is a strategic partner for content teams. It helps businesses measure success, improve performance, and make better decisions. By centralizing KPIs and offering real-time insights, it ensures your content marketing strategy delivers measurable results.
With advantages like automation, visual clarity, and flexibility, this dashboard is a must-have for any content-driven business. And when combined with best practices, it becomes a powerful driver of growth and productivity.
Click to Purchase Copywriting & Content Creation KPI Dashboard in Excel
Frequently Asked Questions (FAQs)
1. What is the main purpose of a Copywriting & Content Creation KPI Dashboard?
It helps track and measure the performance of copywriting and content activities through clear KPIs, ensuring better decision-making.
2. Can I customize the dashboard for my business?
Yes, the dashboard is fully customizable. You can add or remove KPIs, change targets, and update layouts based on your needs.
3. How often should I update the actual data?
For accurate insights, update it monthly at minimum. Weekly updates provide even better control.
4. What are the most important KPIs for copywriting?
Key KPIs include website traffic, conversion rate, bounce rate, CTR, engagement rate, and content production volume.
5. Can this dashboard replace advanced analytics tools?
Not entirely. While Excel provides structured analysis, integrating with tools like Google Analytics or Power BI can enhance reporting.
6. Who should use this dashboard?
It is ideal for copywriters, content managers, digital marketers, and business leaders who want to measure ROI from content.
7. How does it improve decision-making?
By comparing actual vs. target vs. previous year data, leaders can identify what’s working and make timely adjustments.
8. Does it support collaboration?
Yes, you can share the Excel file across teams and even host it on cloud services like OneDrive or Google Drive.
Visit our YouTube channel to learn step-by-step video tutorials
Click to Purchase Copywriting & Content Creation KPI Dashboard in Excel
Watch the step-by-step video tutorial: