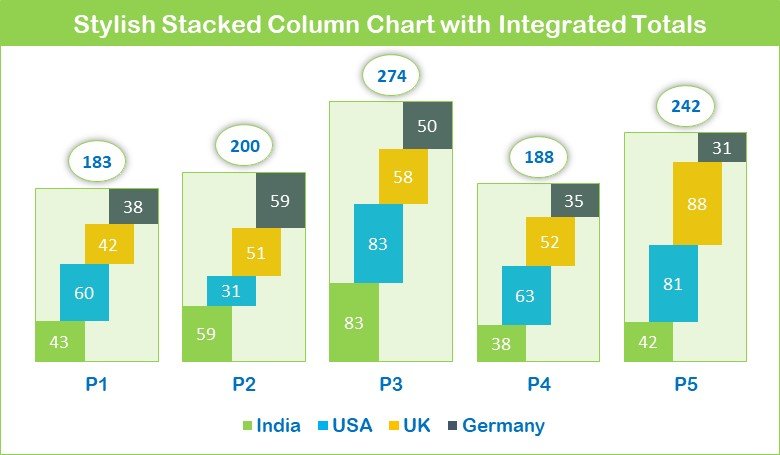
Effective Stacked Column Chart with Integrated Totals
Excel is an essential tool in the corporate world, and its charting capabilities are among its most powerful features. Among these, the Stacked Column Chart stands out for its effectiveness