• Excel and VBA
    • VBA Course
    • Shortcut Keys
    • Useful Formulas
    • Basic Charts
    • Advanced Chart
    • Sort and Filter
    • Pivot Table
    • Data Validation
    • Conditional Formatting
    • Auto Fill and Flash Fill
    • Find and Replace
  • DownloadsPopular
    • Excel VBA Tools
    • Dashboard
      • Excel Dashboard
      • KPI Dashboard
      • Power BI Dashboard
    • Charts
      • Progress Charts
      • Info-graphics
      • Animated Charts
      • Comparisons
      • Gantt Charts
      • Heatmaps
      • Speedometers
      • Timelines
    • Inventory Management
    • HR and Payrolls
    • VBA Automation
    • Utilities and Converters
    • Checklist
    • Calendars
    • Data Analysis
    • Excel Templates
    • Financial Tools
    • Project Management
    • Sales and Marketing
    • Productivity
  • Excel Dashboard
  • Templates
  • Tutorials
    • Charts and Visualization
    • VBA
    • Excel Tips and Tricks
  • Power BI
  • Template StoreNew
  • CoursesNew
  • About Us
  • Contact Us

PK: An Excel Expert

Transforming Data into Decisions

Charts and Visualization

In this category, you will find comprehensive tutorials on creating stunning charts and visualizations in Excel. Impress your colleagues and boss with attractive and informative visuals by following our step-by-step guides. Each tutorial comes with a free practice file for download and tutorial videos to help you understand the process. Explore this category now and enhance your data analysis and presentation skills with Excel.

Power View in Excel
Charts and Visualization

Sales Dashboard Power View in Excel 2013

December 30, 2019March 3, 2025 PKComments Off on Sales Dashboard Power View in Excel 2013
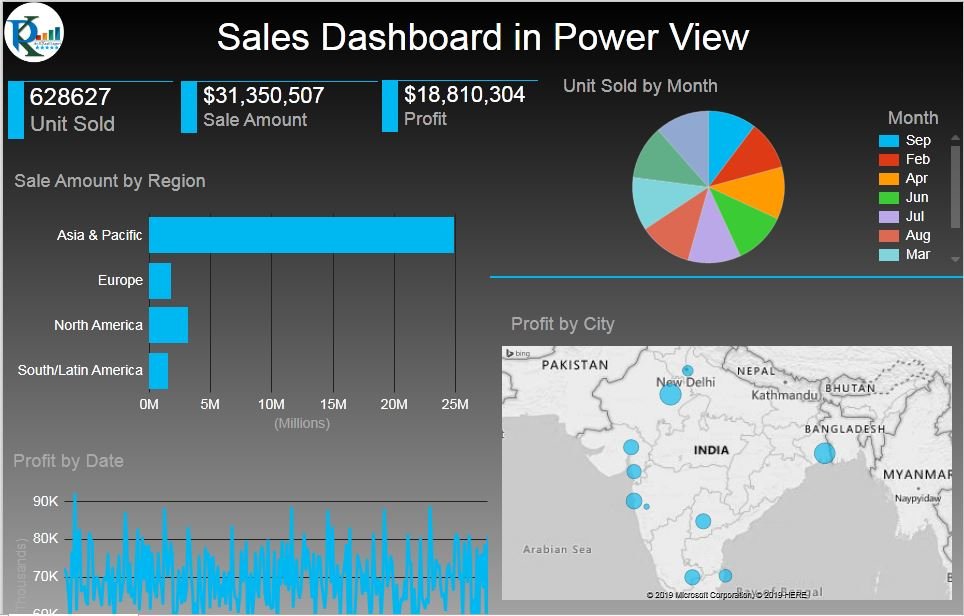
Sales Dashboard Power View in Excel 2013 In this article, we have created a beautiful Sales Dashboard Power View in Excel 2013. [caption id="attachment_22871" align="aligncenter" width="964"] Power View in Excel[/caption]
Read More
5 Layered Doughnut Chart
Charts and Visualization

5 Layered Advanced Doughnut Chart

December 2, 2019March 3, 2025 PKComments Off on 5 Layered Advanced Doughnut Chart
5 Layered Advanced Doughnut Chart In this article, we have created the 5 Layered Doughnut Chart to display the KPI value up to 500%. We have created two different version
Read More
RAG Waffle Chart with Slicer
Charts and Visualization

RAG waffle Chart visualization with Slicer

November 18, 2019March 5, 2025 PKComments Off on RAG waffle Chart visualization with Slicer
In this article, we have create a RAG waffle Chart visualization with slicer to display the Red, Amber and Green percentage. We have used Conditional Formatting and linked picture feature
Read More
Dynamic Performance Chart
Charts and Visualization

Dynamic Performance Chart in Excel

November 7, 2019March 3, 2025 PKComments Off on Dynamic Performance Chart in Excel
In this article, we have created dynamic Performance Charts. We have used excel shapes and Doughnut Chart here. To make these charts dynamic we have used Form control option buttons. Dynamic
Read More
3D Table in Excel
Charts and Visualization

Data Driven 3D Table in Excel

October 17, 2019March 8, 2025 PKComments Off on Data Driven 3D Table in Excel
In this article, we have designed a data driven 3D table in Excel. We have used Linked picture and excel shapes to create this table. You can use this in
Read More
Timer Chart Visualization
Charts and Visualization

Timer Chart Visualization in Excel

October 14, 2019March 6, 2025 PKComments Off on Timer Chart Visualization in Excel
In this article, we have created a beautiful data driven Timer Chart visualization. You can use this chart to display KPI metrics like Service Level, Quality Score, Sales conversion etc.
Read More
Dynamic Conditional Formatting
Charts and Visualization

Dynamic Conditional Formatting in Excel

October 10, 2019March 6, 2025 PKComments Off on Dynamic Conditional Formatting in Excel
In this article, we have created Dynamic Conditional Formatting in Excel using Form Control Option Buttons. Conditional Formatting is changed in Heat Map (Color Scale), Data Bar and Traffic Lights
Read More
Animated Speedometer
Charts and Visualization

Animated Speedometer Chart in Excel

September 3, 2019March 5, 2025 PKComments Off on Animated Speedometer Chart in Excel
In this article, we have created an Animated Speedometer Chart in Excel using Charts and VBA. This beautiful chart can be used in your business dashboard. An animation will run
Read More
Dynamic Variance Arrow Chart with Slicer
Charts and Visualization

Dynamic Variance Arrows Chart with Slicers

August 29, 2019March 10, 2025 PKComments Off on Dynamic Variance Arrows Chart with Slicers
In the previous article we create a Dynamic Chart with Variance Arrows using multiple check boxes. In this article, we have created the similar Dynamic Variance Arrows Chart with Slicers.
Read More
Dynamic Variance Arrows Chart with Check Boxes
Charts and Visualization

Dynamic Variance Arrows Chart with Check Boxes

August 27, 2019March 10, 2025 PKComments Off on Dynamic Variance Arrows Chart with Check Boxes
In this article, we have created a Dynamic Variance Arrows Chart with Check Boxes. This is quite useful chart to display the Sale variance in compare of previous year. We
Read More

Posts pagination

Previous 1 … 7 8 9 … 16 Next
  • Excel and VBA
    • VBA Course
    • Shortcut Keys
    • Useful Formulas
    • Basic Charts
    • Advanced Chart
    • Sort and Filter
    • Pivot Table
    • Data Validation
    • Conditional Formatting
    • Auto Fill and Flash Fill
    • Find and Replace
  • DownloadsPopular
    • Excel VBA Tools
    • Dashboard
      • Excel Dashboard
      • KPI Dashboard
      • Power BI Dashboard
    • Charts
      • Progress Charts
      • Info-graphics
      • Animated Charts
      • Comparisons
      • Gantt Charts
      • Heatmaps
      • Speedometers
      • Timelines
    • Inventory Management
    • HR and Payrolls
    • VBA Automation
    • Utilities and Converters
    • Checklist
    • Calendars
    • Data Analysis
    • Excel Templates
    • Financial Tools
    • Project Management
    • Sales and Marketing
    • Productivity
  • Excel Dashboard
  • Templates
  • Tutorials
    • Charts and Visualization
    • VBA
    • Excel Tips and Tricks
  • Power BI
  • Template StoreNew
  • CoursesNew
  • About Us
  • Contact Us
Copyright © 2023 PK-AnExcelExpert.com - Privacy Policy
This website uses cookies to improve your user experience, analyze site traffic and serve targeted ads in accordance with our Privacy Policy ACCEPT
Privacy & Cookies Policy

Privacy Overview

This website uses cookies to improve your experience while you navigate through the website. Out of these cookies, the cookies that are categorized as necessary are stored on your browser as they are essential for the working of basic functionalities of the website. We also use third-party cookies that help us analyze and understand how you use this website. These cookies will be stored in your browser only with your consent. You also have the option to opt-out of these cookies. But opting out of some of these cookies may have an effect on your browsing experience.
Necessary
Always Enabled
Necessary cookies are absolutely essential for the website to function properly. This category only includes cookies that ensures basic functionalities and security features of the website. These cookies do not store any personal information.
Non-necessary
Any cookies that may not be particularly necessary for the website to function and is used specifically to collect user personal data via analytics, ads, other embedded contents are termed as non-necessary cookies. It is mandatory to procure user consent prior to running these cookies on your website.
SAVE & ACCEPT