Dynamic Variance Arrows Chart with Check Boxes
In this article, we have created a Dynamic Variance Arrows Chart with Check Boxes. This is quite useful chart to display the Sale variance in compare of previous year. We
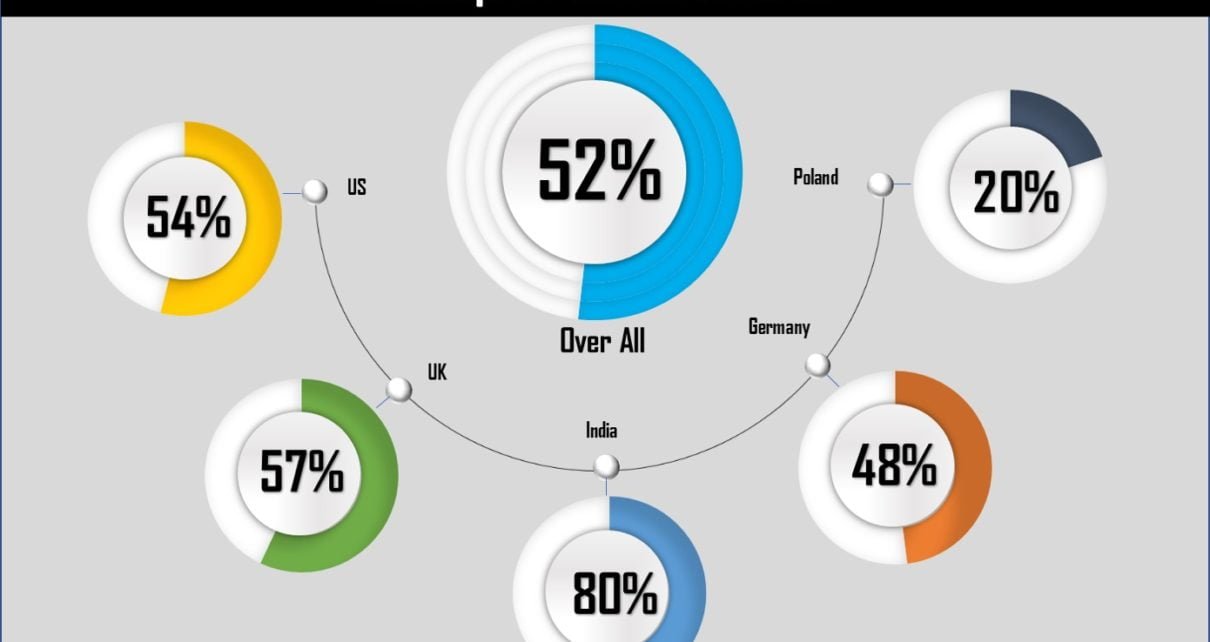
Transforming Data into Decisions
In this category, you will find comprehensive tutorials on creating stunning charts and visualizations in Excel. Impress your colleagues and boss with attractive and informative visuals by following our step-by-step guides. Each tutorial comes with a free practice file for download and tutorial videos to help you understand the process. Explore this category now and enhance your data analysis and presentation skills with Excel.