New: NextGenTemplates Academy - video courses on Excel formulas with AI and Pivot Tables & dashboards. Early-bird: 20% off with code EARLYBIRD20 - first 20 orders only. See the courses →
  • Learn Excel (Free Course)
    • 1. Shortcut Keys
    • 2. Fill & Flash Fill
    • 3. Find & Replace
    • 4. Sort & Filter
    • 5. Formulas & Functions
    • 6. Data Validation
    • 7. Conditional Formatting
    • 8. Basic Charts
    • 9. Advanced Charts
    • 10. Pivot Tables
    • 11. Excel Dashboards
    • 12. VBA Course
    • 13. Excel Formulas with AI
  • Templates
  • Tutorials
    • Charts and Visualization
    • VBA
    • Excel Tips and Tricks
    • Excel Dashboards
    • Power Pivot & DAX
  • Power BI
  • Template Store
    • Ready to Use Templates
  • Courses
  • Academy
    • Excel + AI Mastery: 100 Formulas
    • Excel Pivot Tables & Dashboards
  • About Us
  • Contact Us

PK: An Excel Expert

Transforming Data into Decisions

Power BI

This category provides comprehensive tutorials on creating dynamic and insightful visualizations with Power BI. Whether you need to analyze complex data sets or create interactive dashboards, our tutorials will guide you through the process. Each tutorial comes with a free practice file for download and tutorial videos to help you follow along easily. Start your Power BI tutorial now and learn how to create engaging and informative reports. Impress your colleagues and boss with your data visualization and analysis skills by exploring this category today.
Dashboard Power BI

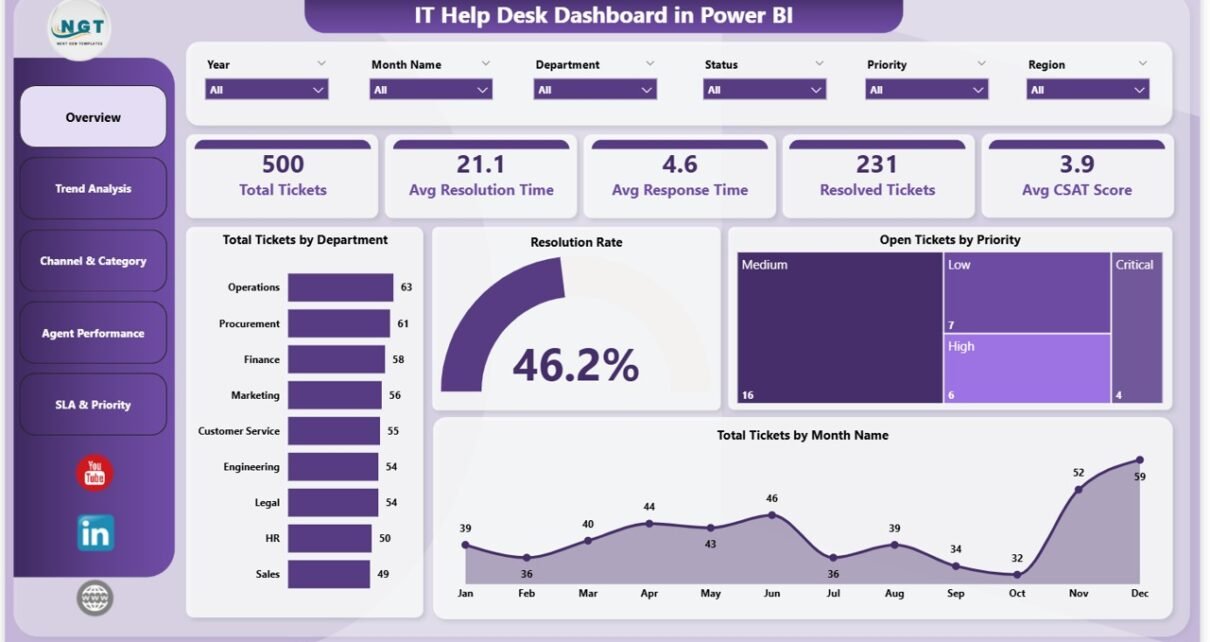
IT Help Desk Dashboard in Power BI

May 17, 2026May 17, 2026 PKComments Off on IT Help Desk Dashboard in Power BI
The IT Help Desk Dashboard in Power BI tracks 5 core KPIs across 5 fully interactive report pages, with 16 pre-built visuals and slicer-driven filtering by department, priority, channel, agent,
Read More
Dashboard Power BI

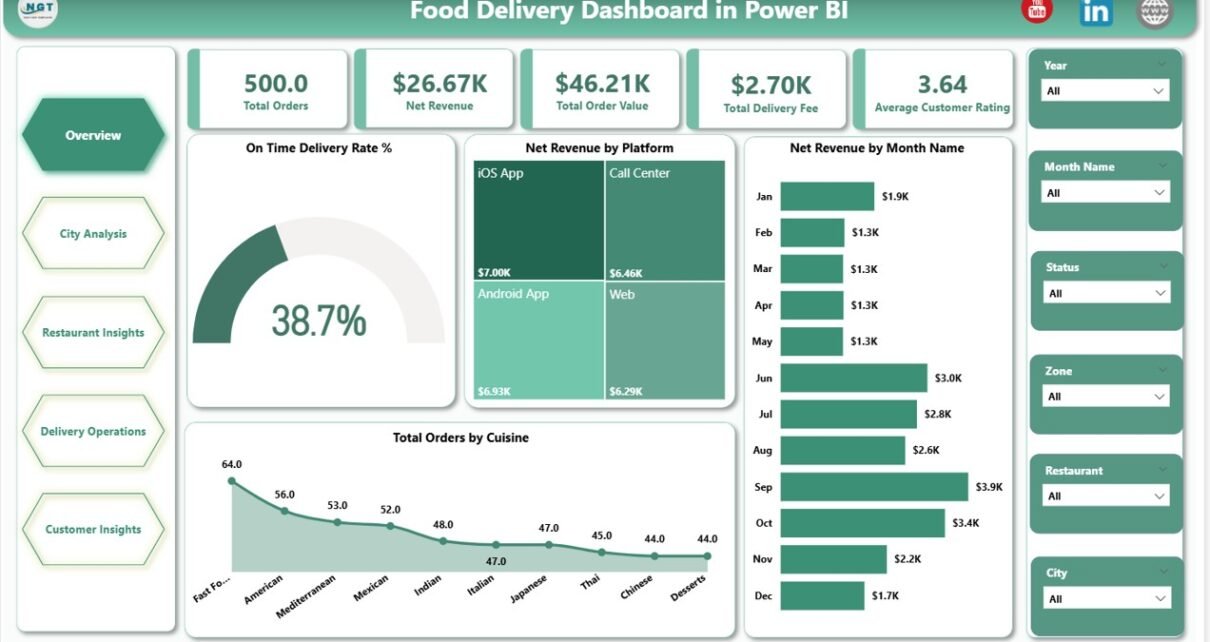
Food Delivery Dashboard in Power BI

May 16, 2026May 16, 2026 PKComments Off on Food Delivery Dashboard in Power BI
The global online food delivery market is projected to hit $1.65 trillion by 2027 (Statista, 2025), with operators running across 3-15 platforms on average and tracking 20+ KPIs per location.
Read More
Dashboard Power BI

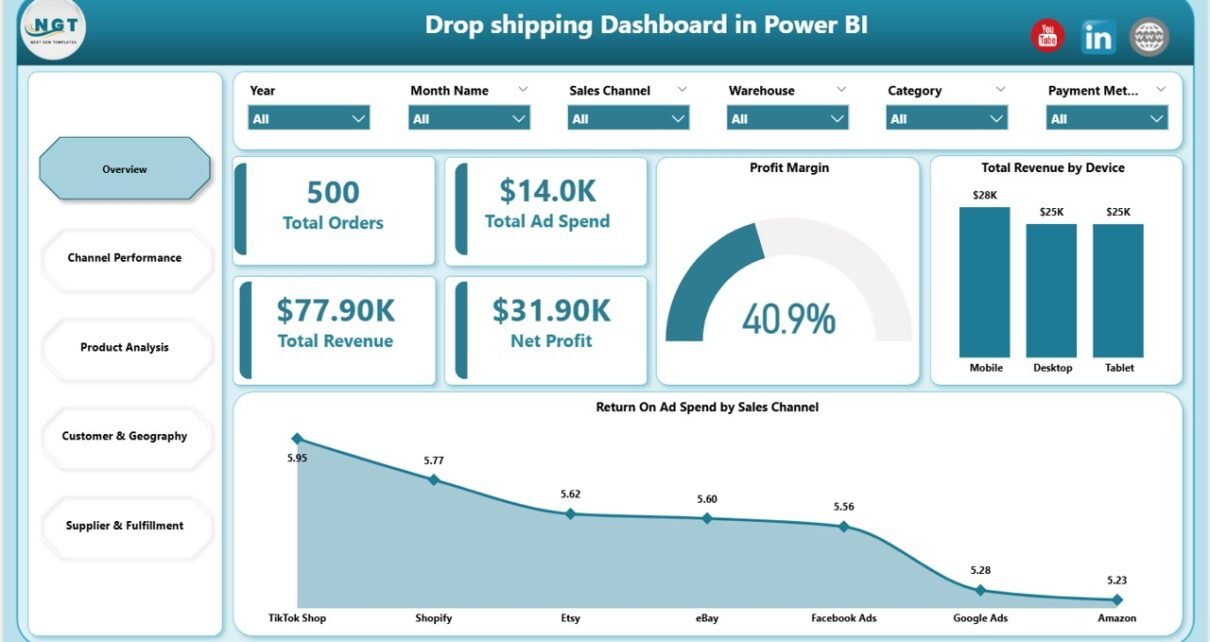
Drop Shipping Dashboard in Power BI

May 16, 2026May 16, 2026 PKComments Off on Drop Shipping Dashboard in Power BI
Dropshipping operators spend an average of $3,200 per year on analytics SaaS tools — Triple Whale alone runs $129-499/month, Polar runs $150-400/month, and dedicated marketplace analytics (Helium 10, Jungle Scout,
Read More
Dashboard Power BI

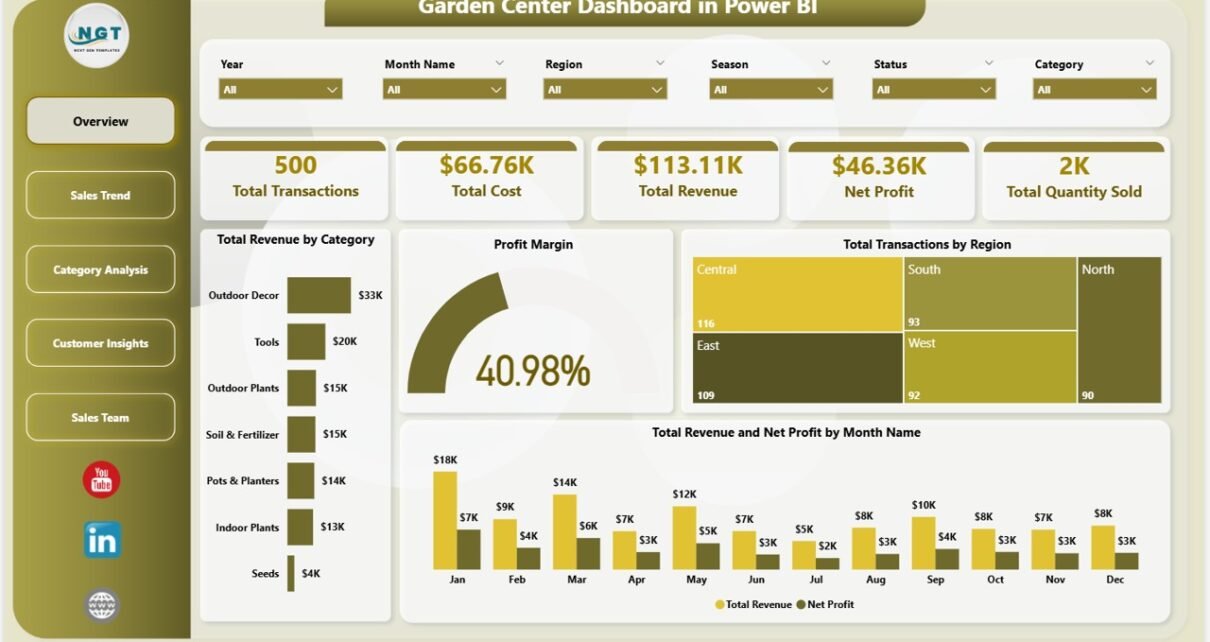
Garden Center Dashboard in Power BI

May 16, 2026May 16, 2026 PKComments Off on Garden Center Dashboard in Power BI
Garden retail is a seasonal, low-margin, staff-heavy business. A single bedding-plant category can account for 40% of spring revenue but only 18% of net profit, and most garden center owners
Read More
Dashboard Power BI

Buy-Now-Pay-Later Platforms Dashboard in Power BI

May 14, 2026May 14, 2026 PKComments Off on Buy-Now-Pay-Later Platforms Dashboard in Power BI
The Buy Now Pay Later Dashboard in Power BI tracks 5 portfolio KPIs across 5 interactive Power BI pages, with 16 visuals and native slicers covering platform performance, customer segments,
Read More
Power BI

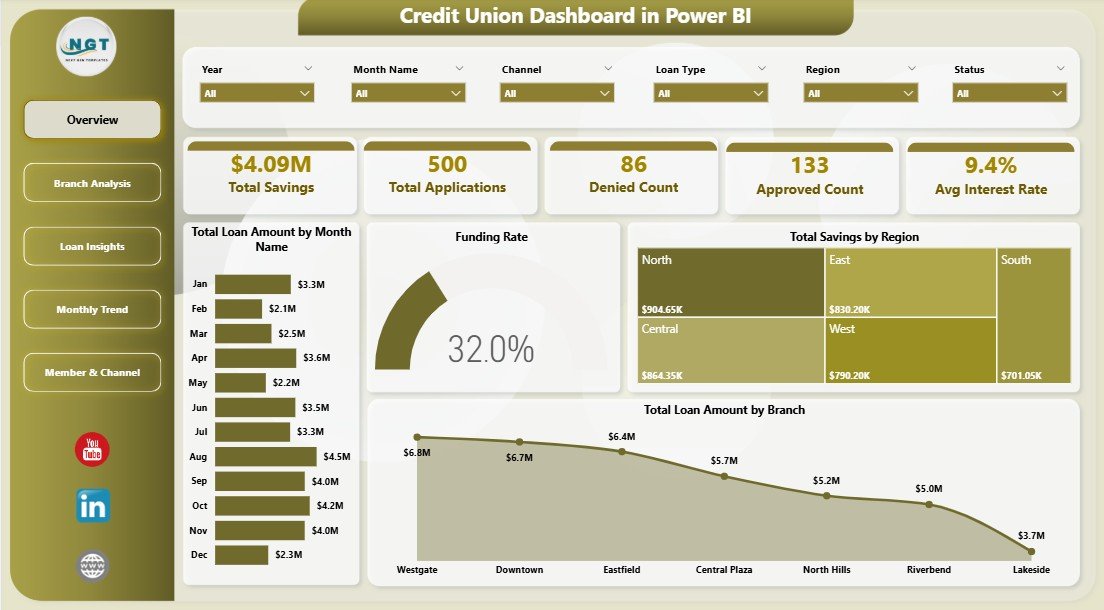
Credit Union Dashboard in Power BI

May 13, 2026May 13, 2026 PKComments Off on Credit Union Dashboard in Power BI
Credit unions in the U.S. manage over $2.3 trillion in member assets across more than 4,500 institutions, according to the National Credit Union Administration. Yet most of them still rely
Read More
Dashboard Power BI Templates

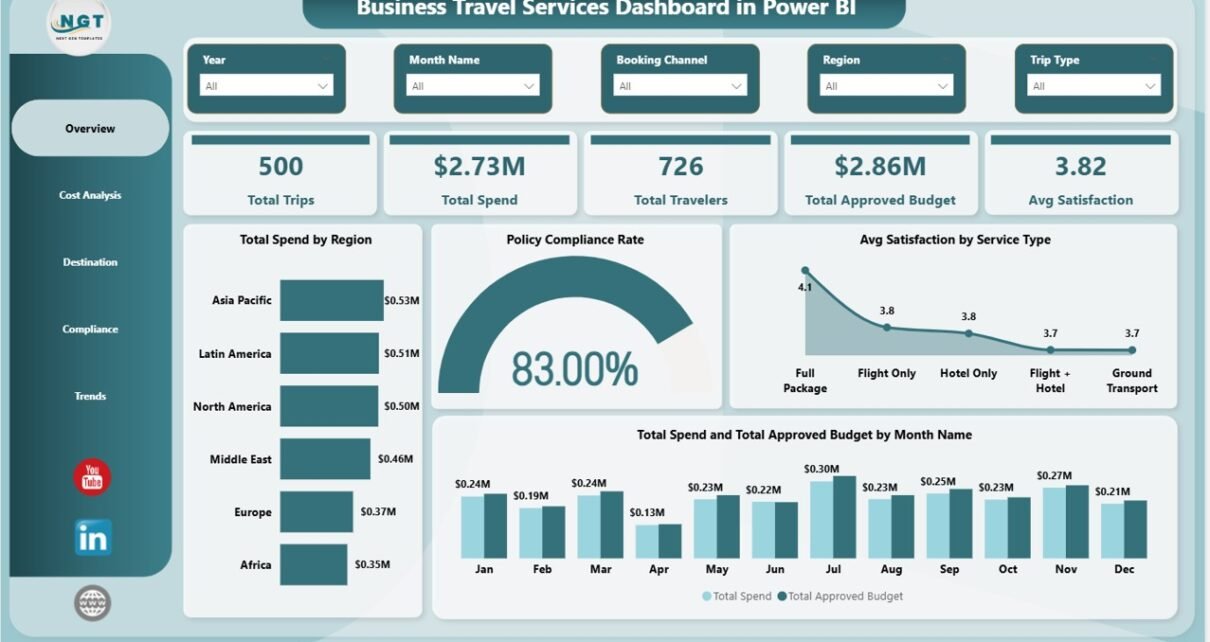
Business Travel Services Dashboard in Power BI

May 13, 2026May 13, 2026 PKComments Off on Business Travel Services Dashboard in Power BI
  Corporate travel is one of the top three controllable expense categories for mid-size organizations — yet most teams still track it with spreadsheets or rely on costly SaaS platforms
Read More
Dashboard Power BI

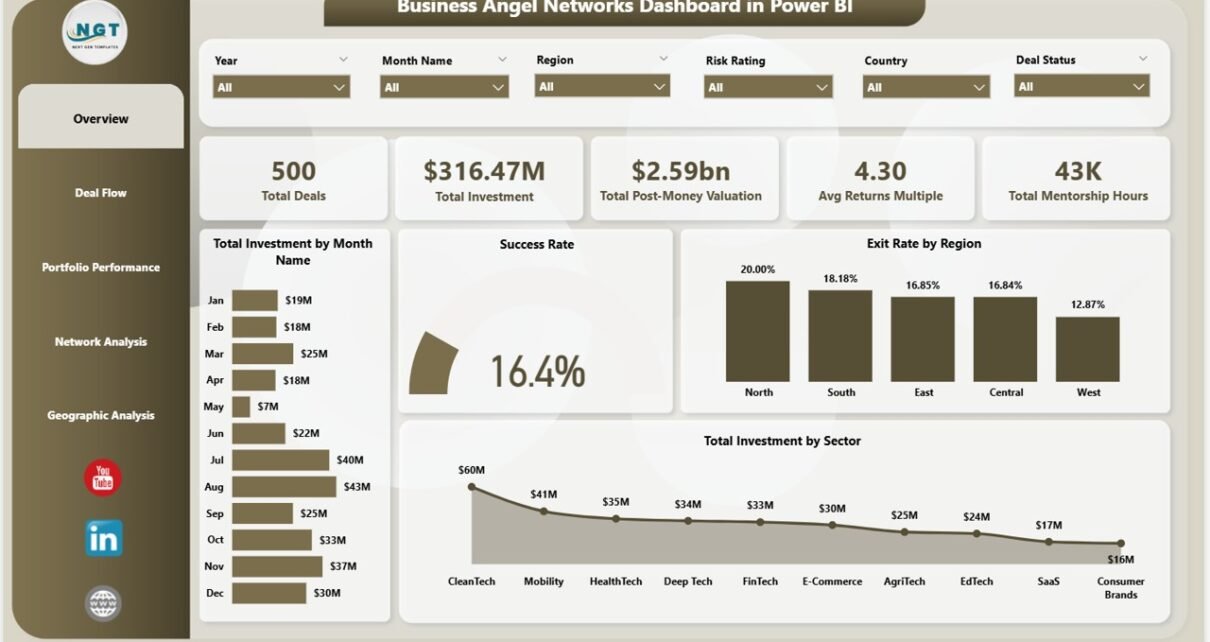
Business Angel Networks Dashboard in Power BI

May 12, 2026May 12, 2026 PKComments Off on Business Angel Networks Dashboard in Power BI
  Angel investors globally deploy over $25 billion annually across 60,000+ startup deals in the United States alone — yet the majority of angel networks still rely on disconnected spreadsheets
Read More
Dashboard Power BI

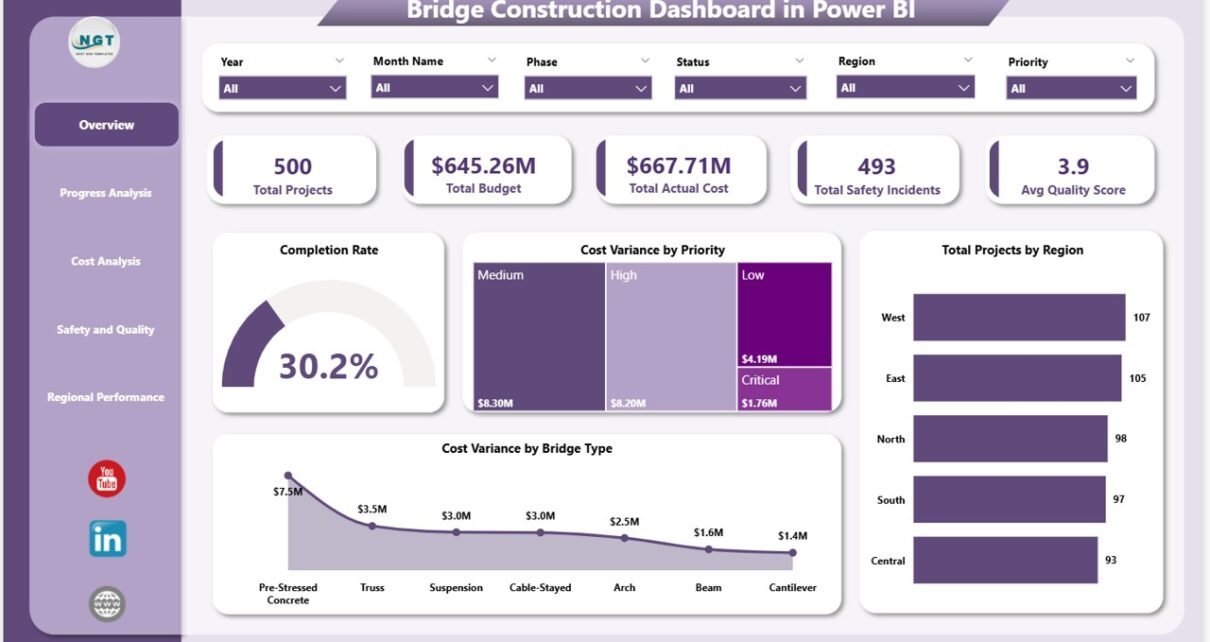
Bridge Construction Dashboard in Power BI

May 12, 2026May 12, 2026 PKComments Off on Bridge Construction Dashboard in Power BI
  Infrastructure project teams worldwide lose an estimated 20-30% of project value to poor cost controls and inadequate progress monitoring — problems that compound quickly when managing multi-region bridge portfolios
Read More
Dashboard Power BI Templates

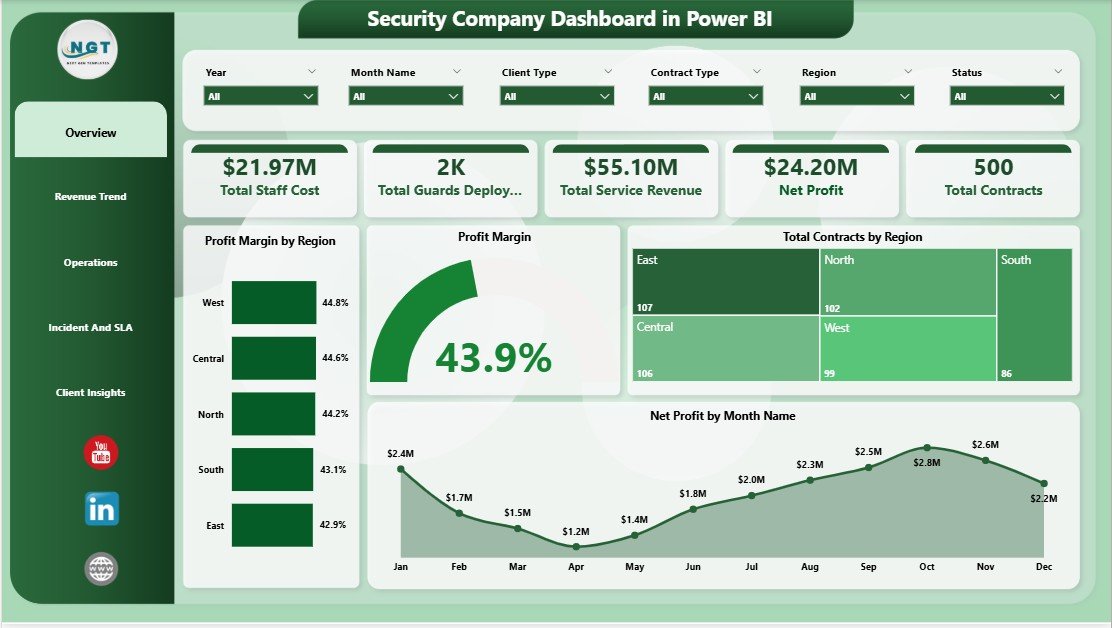
Security Company Dashboard in Power BI

May 12, 2026May 12, 2026 PKComments Off on Security Company Dashboard in Power BI
Security companies that rely on manual spreadsheets spend an estimated 6–10 hours per month building reports that a connected Power BI dashboard can generate in under 15 minutes. The Security
Read More

Posts pagination

Previous 1 … 28 29 30 … 155 Next
  • Learn Excel (Free Course)
    • 1. Shortcut Keys
    • 2. Fill & Flash Fill
    • 3. Find & Replace
    • 4. Sort & Filter
    • 5. Formulas & Functions
    • 6. Data Validation
    • 7. Conditional Formatting
    • 8. Basic Charts
    • 9. Advanced Charts
    • 10. Pivot Tables
    • 11. Excel Dashboards
    • 12. VBA Course
    • 13. Excel Formulas with AI
  • Templates
  • Tutorials
    • Charts and Visualization
    • VBA
    • Excel Tips and Tricks
    • Excel Dashboards
    • Power Pivot & DAX
  • Power BI
  • Template Store
    • Ready to Use Templates
  • Courses
  • Academy
    • Excel + AI Mastery: 100 Formulas
    • Excel Pivot Tables & Dashboards
  • About Us
  • Contact Us
Copyright © 2023 PK-AnExcelExpert.com - Privacy Policy
This website uses cookies to improve your user experience, analyze site traffic and serve targeted ads in accordance with our Privacy Policy ACCEPT
Privacy & Cookies Policy

Privacy Overview

This website uses cookies to improve your experience while you navigate through the website. Out of these cookies, the cookies that are categorized as necessary are stored on your browser as they are essential for the working of basic functionalities of the website. We also use third-party cookies that help us analyze and understand how you use this website. These cookies will be stored in your browser only with your consent. You also have the option to opt-out of these cookies. But opting out of some of these cookies may have an effect on your browsing experience.
Necessary
Always Enabled
Necessary cookies are absolutely essential for the website to function properly. This category only includes cookies that ensures basic functionalities and security features of the website. These cookies do not store any personal information.
Non-necessary
Any cookies that may not be particularly necessary for the website to function and is used specifically to collect user personal data via analytics, ads, other embedded contents are termed as non-necessary cookies. It is mandatory to procure user consent prior to running these cookies on your website.
SAVE & ACCEPT