Monitoring key performance indicators (KPIs) is essential for managing construction projects effectively. The Construction KPI Scorecard in Excel provides a ready-to-use template to evaluate multiple KPIs, track progress, and make data-driven decisions. This scorecard helps project managers, site engineers, and executives visualize performance trends and take corrective actions promptly.
In this article, we will explain the features, advantages, and best practices of using this Construction KPI Scorecard in Excel.
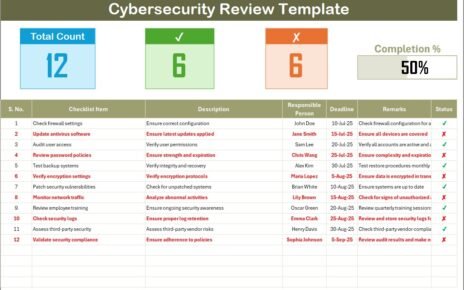
What Is a Construction KPI Scorecard?
A Construction KPI Scorecard is a digital tool that tracks and reports on critical performance metrics for construction projects. It consolidates key project KPIs in a single template, allowing stakeholders to monitor timelines, budgets, quality, safety, and operational efficiency.
Using Excel, this scorecard allows organizations to:
-
Track monthly and yearly performance
-
Compare actual metrics against targets
-
Identify areas of improvement quickly
-
Make informed decisions to optimize project outcomes
Key Features of the Construction KPI Scorecard
This Excel scorecard is designed for ease of use and includes multiple features:
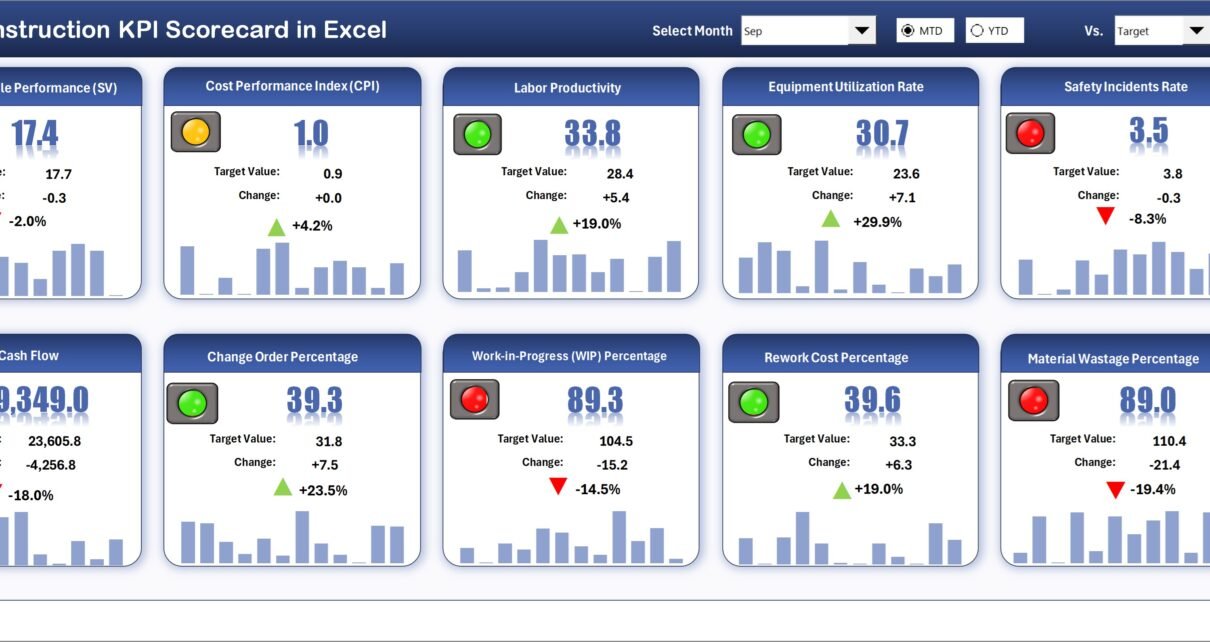
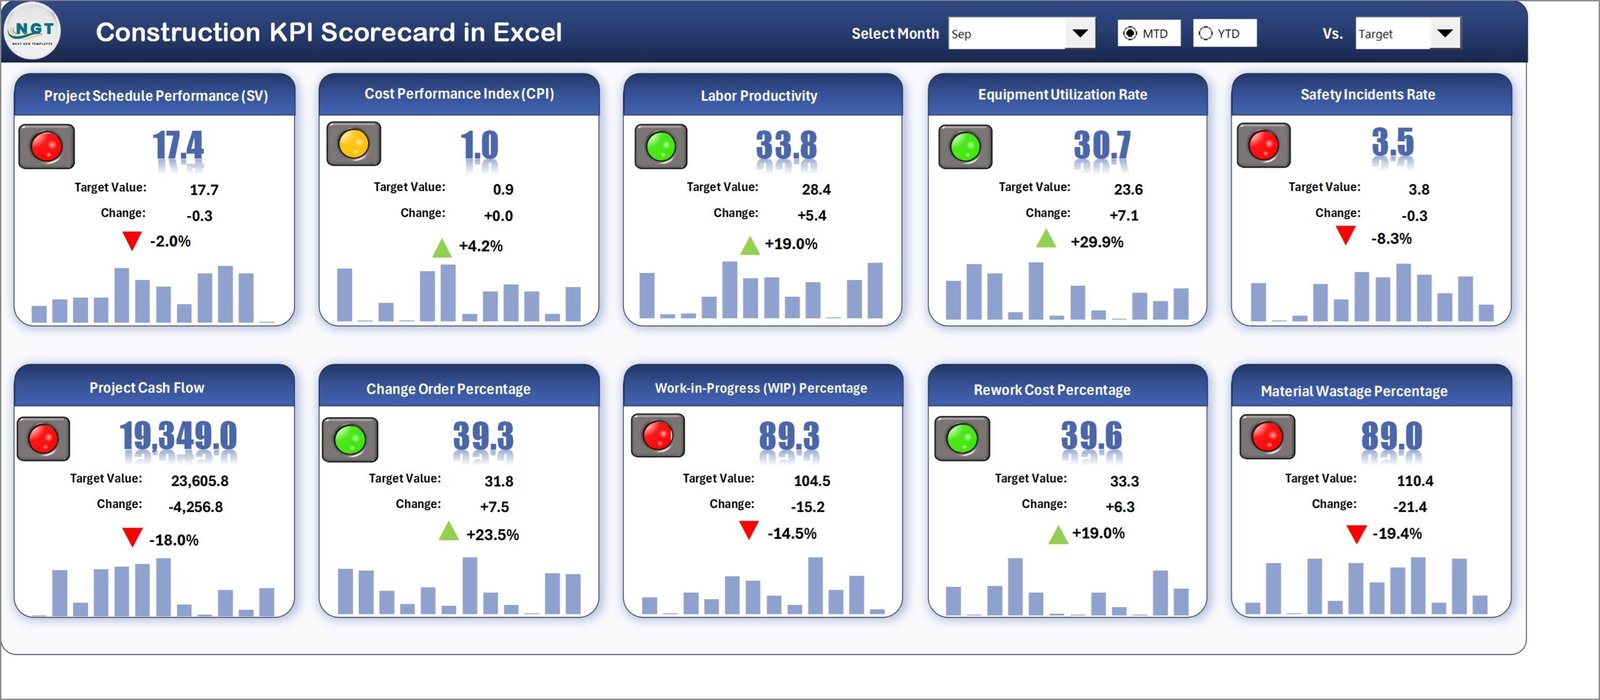
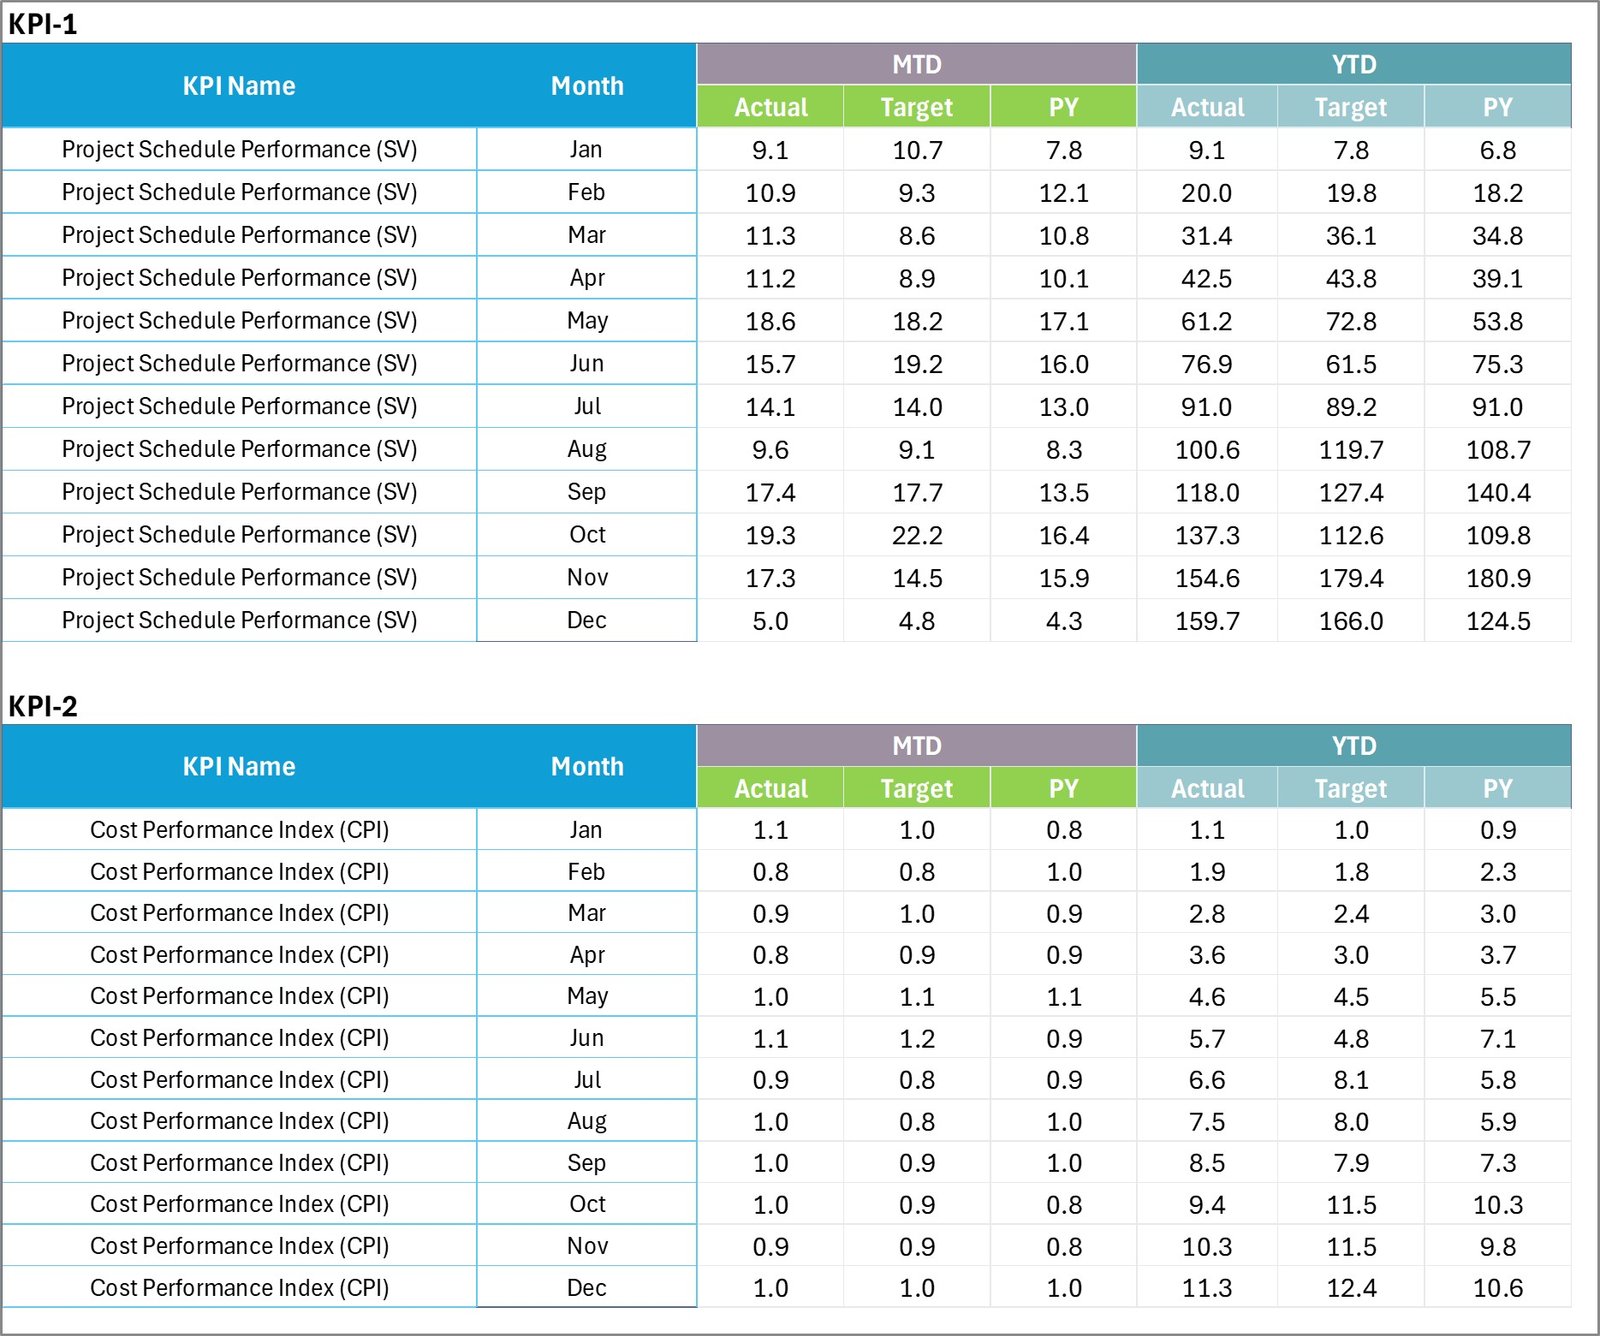
1. Monthly and Yearly Scorecard
-
Month Dropdown: Select any month to display monthly (MTD) data
-
MTD and YTD Metrics: View performance for the selected month or cumulative yearly data
-
Traffic Lights & Conditional Formatting: Quickly identify KPIs that are performing well (green) or need attention (red)
-
Up and Down Arrows: Visualize percentage changes in KPI performance
This setup allows managers to monitor both current and long-term performance efficiently.
Click to Buy Construction KPI Scorecard in Excel
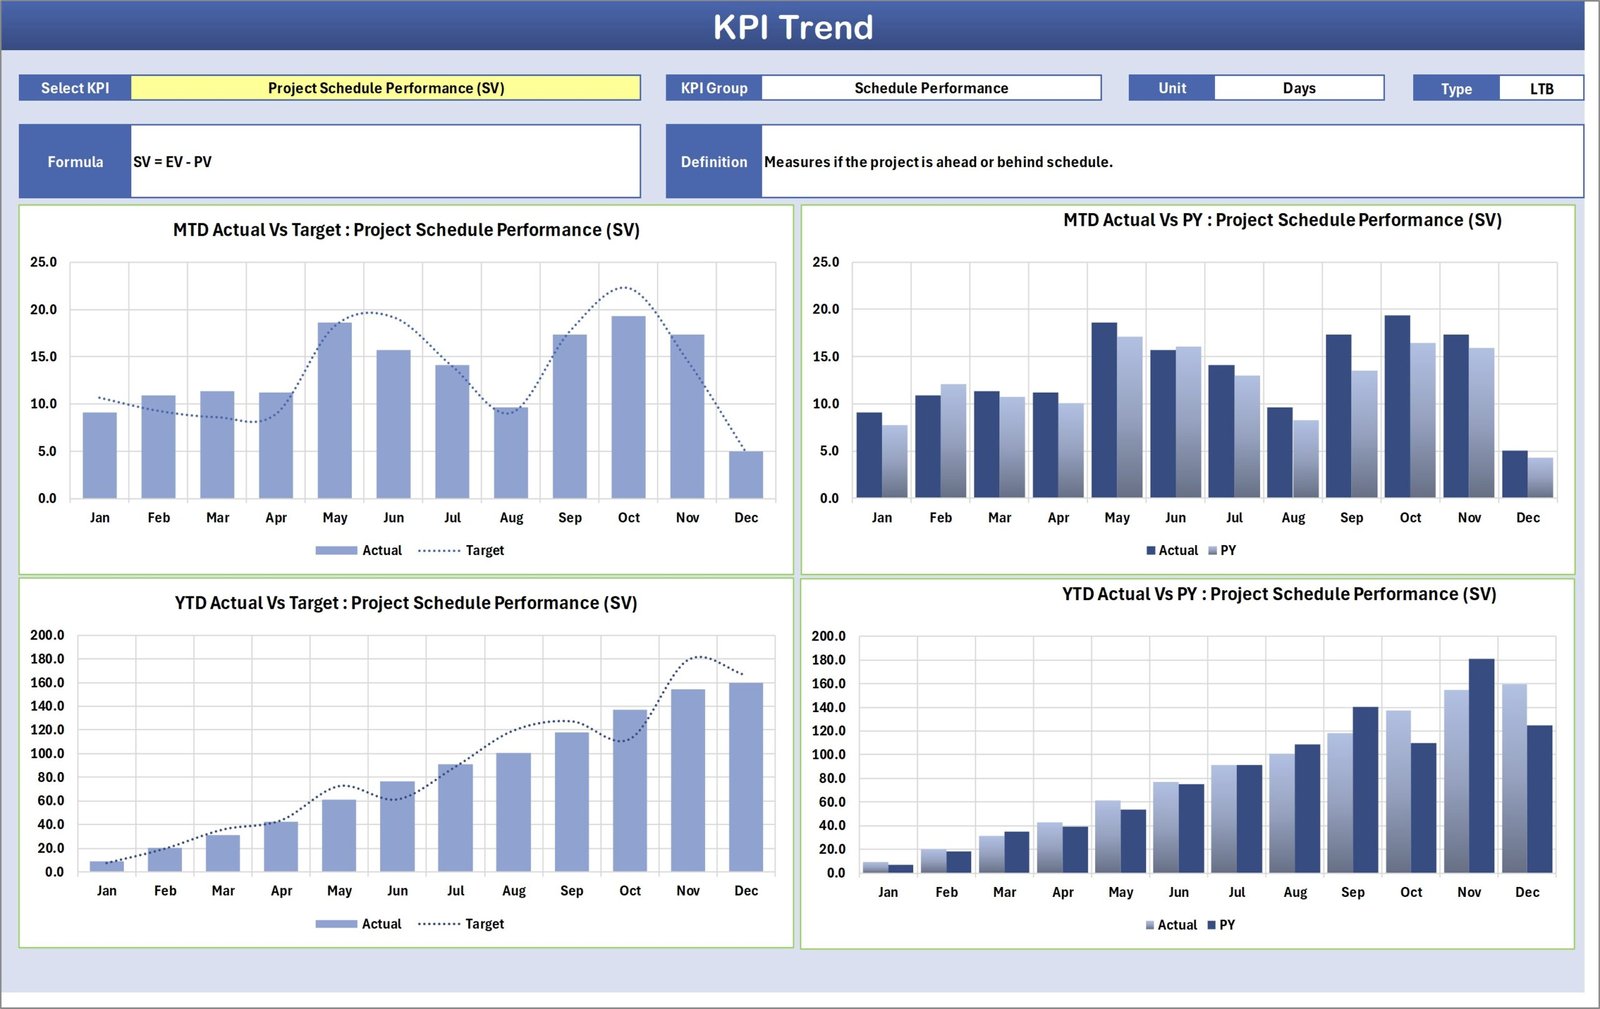
2. Trend Sheet Tab
The Trend Sheet provides detailed insights for individual KPIs:
-
Select a KPI from the dropdown in Range C3
-
Displays KPI Group, Unit, and Type (Lower-the-Better or Upper-the-Better)
-
Shows the KPI formula and definition for reference
-
Allows trend analysis over multiple months to evaluate performance patterns
This sheet helps stakeholders understand the performance trajectory of each KPI and make proactive adjustments.
Click to Buy Construction KPI Scorecard in Excel
Input Data Sheet – The Foundation of the Scorecard
The Input Data sheet is where all raw performance data is entered.
Features include:
✍️ Data Entry: Record actual values, targets, and metrics for each KPI.
🔄 Flexibility: Update new results anytime to refresh the Scorecard and Trend sheets automatically.
⚙️ Automation: Formulas and linked references ensure accuracy across all sheets.
This sheet functions like the engine that powers the dashboard. Without accurate input, the scorecard cannot deliver reliable insights.
Click to Buy Construction KPI Scorecard in Excel
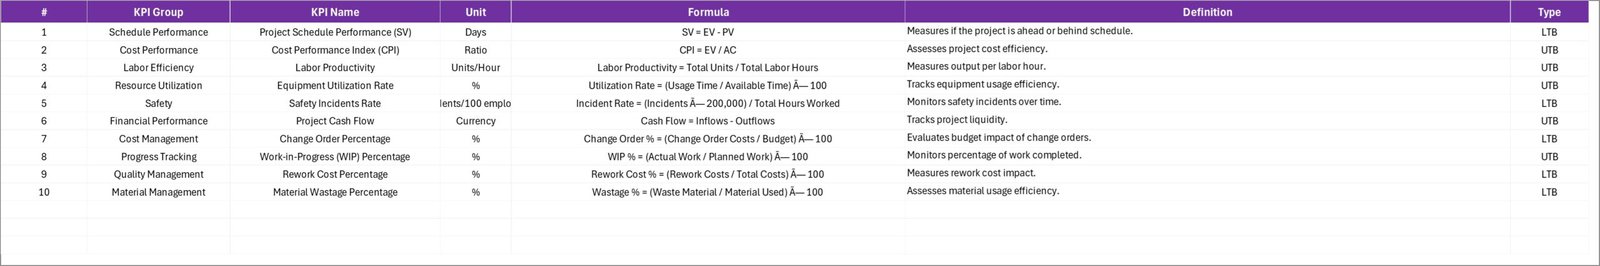
3. KPI Definition Sheet Tab
The KPI Definition Sheet documents all KPI-related information:
-
KPI Name
-
KPI Group
-
Unit of Measurement
-
Formula for calculation
-
Definition
-
Type: Lower-the-Better (LTB) or Upper-the-Better (UTB)
This sheet ensures consistency in tracking and provides clarity on what each KPI represents.
Examples of KPIs in a Construction Scorecard
Common KPIs that can be tracked using this scorecard include:
-
Project Completion %: Measures progress against project timelines (UTB)
-
Safety Incidents: Number of incidents reported (LTB)
-
Cost Variance %: Difference between actual and planned costs (LTB)
-
Equipment Utilization: Measures efficiency of machinery (UTB)
-
Labor Productivity: Output per worker (UTB)
-
Material Usage Variance: Difference between planned and actual material consumption (LTB)
-
Schedule Adherence %: Tracks on-time task completion (UTB)
-
Quality Compliance %: Compliance with quality standards (UTB)
-
Customer Satisfaction Score: Feedback from clients (UTB)
-
Change Orders Count: Number of project change orders (LTB)
Each KPI includes a unit, formula, and target, helping managers measure performance effectively.
Advantages of Using the Construction KPI Scorecard
Click to Buy Construction KPI Scorecard in Excel
-
Centralized Tracking: Consolidates multiple KPIs in one Excel template
-
Visual Insights: Traffic lights and arrows highlight performance status instantly
-
Trend Analysis: Track monthly and yearly changes to identify patterns
-
Informed Decision-Making: Use KPI insights to improve project performance
-
Customizable: Add or remove KPIs based on project needs
-
Time-Saving: Automated calculations and formatting reduce manual effort
Best Practices for Using the Scorecard
-
Update Data Regularly: Ensure actual and target values are entered on time
-
Focus on Critical KPIs: Prioritize KPIs that directly impact project success
-
Analyze Trends: Use the Trend Sheet to spot consistent underperformance or improvement
-
Communicate Results: Share scorecard results with project teams and stakeholders
-
Use Traffic Lights Effectively: Set thresholds for red, yellow, and green to easily identify risks
How This Scorecard Helps Construction Teams
Click to Buy Construction KPI Scorecard in Excel
-
Monitor Project Performance: Track progress across multiple KPIs
-
Ensure Safety and Quality Compliance: Highlight areas needing attention
-
Optimize Resource Allocation: Identify underperforming teams or equipment
-
Control Costs: Monitor cost variance and take corrective action
-
Improve Client Satisfaction: Track quality and project timelines effectively
Frequently Asked Questions (FAQs)
Q1: Can I add more KPIs to this scorecard?
Yes, the template is fully customizable. You can add new KPIs and define formulas in the KPI Definition Sheet.
Q2: How do I track monthly vs yearly performance?
Use the month dropdown to view MTD metrics or click on the YTD option to see cumulative yearly performance.
Q3: Can I track both LTB and UTB KPIs?
Yes, each KPI includes a type indicator (Lower-the-Better or Upper-the-Better) for accurate interpretation.
Q4: Is this template suitable for multiple projects?
Absolutely. You can replicate the sheets for different projects and track KPIs separately.
Q5: Does it include visual indicators for quick analysis?
Yes, the scorecard uses traffic lights and up/down arrows to show performance changes and trends.
Conclusion
Click to Buy Construction KPI Scorecard in Excel
The Construction KPI Scorecard in Excel is a comprehensive tool for tracking and analyzing project performance. By monitoring multiple KPIs, visualizing trends, and using traffic lights and conditional formatting, construction managers can ensure projects stay on track, resources are optimized, and overall performance improves.
Visit our YouTube channel to learn step-by-step video tutorials
Watch the step-by-step video Demo:
Click to Buy Construction KPI Scorecard in Excel