Managing a dermatology clinic today requires much more than offering quality skin treatments. Clinics must track patient flow, doctor performance, revenue, treatment outcomes, operational efficiency, and growth trends continuously. However, when data remains scattered across registers, billing software, or multiple Excel files, decision-making becomes slow and inaccurate.
That is exactly where a Dermatology Clinics KPI Dashboard in Excel becomes a powerful and practical solution.
In this detailed guide, you will learn what a Dermatology Clinics KPI Dashboard in Excel is, why it matters, how it works, its sheet-wise structure, advantages, best practices, and frequently asked questions. Moreover, the language remains simple, direct, and easy to understand so that clinic owners, administrators, dermatologists, and analysts can implement it without technical difficulty.
Click to buy Dermatology Clinics KPI Dashboard in Excel
What Is a Dermatology Clinics KPI Dashboard in Excel?
A Dermatology Clinics KPI Dashboard in Excel is a structured, ready-to-use analytical tool that helps dermatology clinics track, monitor, and analyze key performance indicators (KPIs) from a single centralized Excel file.
Instead of manually reviewing daily registers or billing reports, this dashboard transforms raw clinic data into clear metrics, comparisons, and trends. As a result, decision-makers gain instant visibility into clinic performance.
Because the dashboard runs entirely in Microsoft Excel, it remains:
- Cost-effective
- Easy to customize
- Scalable for single or multi-location clinics
- Familiar for most users
Most importantly, it allows dermatology clinics to make data-driven decisions without investing in expensive BI tools.
Why Do Dermatology Clinics Need a KPI Dashboard in Excel?
Dermatology clinics deal with multiple operational and financial challenges every day. Therefore, tracking KPIs becomes essential.
Common Challenges Without a KPI Dashboard
- Difficulty tracking patient volume and appointment utilization
- Limited visibility into revenue and service-wise performance
- No structured comparison between Actual, Target, and Previous Year data
- Time-consuming manual reporting
- Delayed business decisions
However, when clinics use a Dermatology Clinics KPI Dashboard in Excel, these problems reduce significantly.
Key Benefits of Using a KPI Dashboard
- Faster performance analysis
- Clear visibility into growth and gaps
- Better financial planning
- Improved operational efficiency
- Stronger accountability across teams
As a result, clinics operate more efficiently while improving profitability and patient satisfaction.
How Does a Dermatology Clinics KPI Dashboard in Excel Work?
The dashboard works on a simple yet powerful Excel-based structure.
First, users enter data into structured input sheets. Then, Excel formulas, pivot logic, and charts automatically process that data. Finally, the dashboard visually displays performance metrics in a single view.
Because of this flow:
- Data entry stays simple
- Analysis stays automated
- Reports stay consistent
Moreover, users can update monthly data in minutes and instantly see updated results.
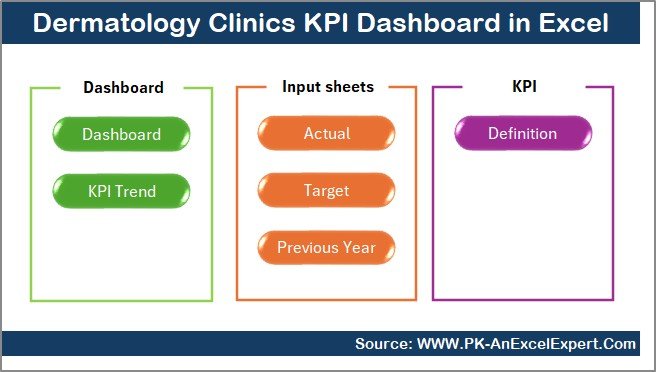
What Are the Key Features of a Dermatology Clinics KPI Dashboard in Excel?
This Dermatology Clinics KPI Dashboard in Excel includes 7 well-structured worksheets, each serving a specific purpose.
Let us understand each sheet in detail.
Summary Page
The Summary Page acts as the index and navigation hub of the dashboard.
Key Highlights of the Summary Page
- Clean and professional layout
- 6 interactive buttons
- Quick navigation to all major sheets
- User-friendly design
Because of this structure, users do not waste time searching for sheets. Instead, they jump directly to the required analysis page.
Click to buy Dermatology Clinics KPI Dashboard in Excel
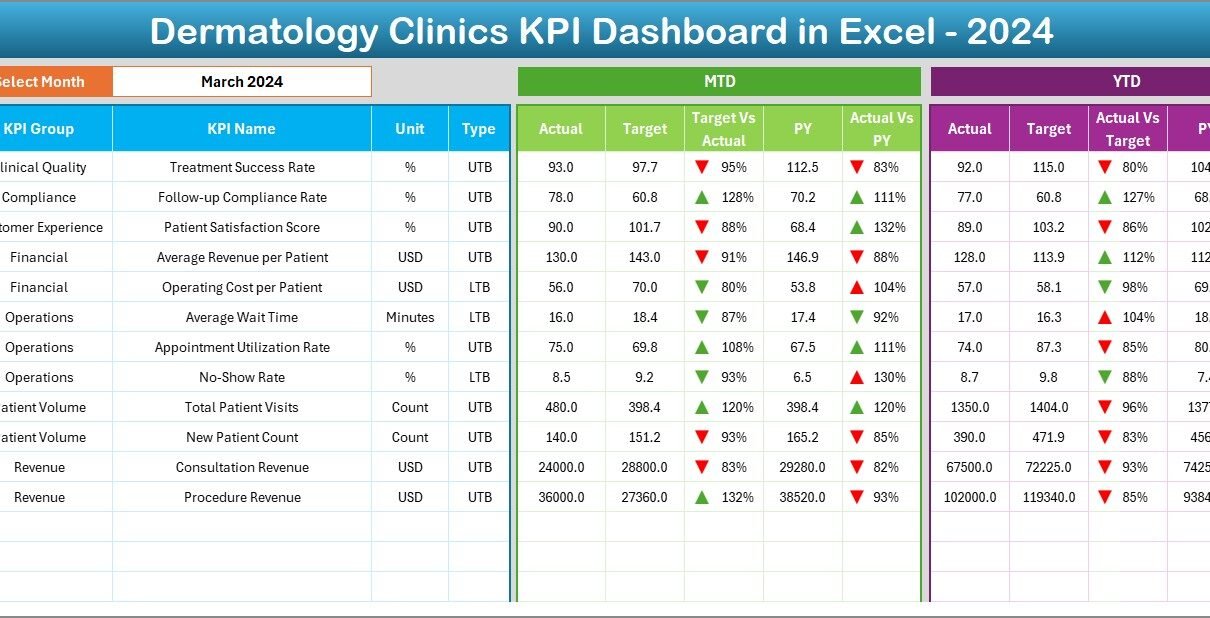
Dashboard Sheet
The Dashboard Sheet serves as the main performance view.
Key Functionalities of the Dashboard Sheet
- Month selection drop-down at cell D3
- Dynamic refresh of all KPI values based on selected month
- Display of MTD and YTD metrics
KPIs Displayed on This Sheet
- MTD Actual
- MTD Target
- MTD Previous Year
- Target vs Actual comparison
- Previous Year vs Actual comparison
Visual Enhancements
- Conditional formatting arrows (up/down indicators)
- Color-coded performance signals
- Easy-to-read KPI layout
As a result, clinic managers instantly identify:
- KPIs meeting targets
- KPIs missing targets
- Positive or negative growth trends

Click to buy Dermatology Clinics KPI Dashboard in Excel
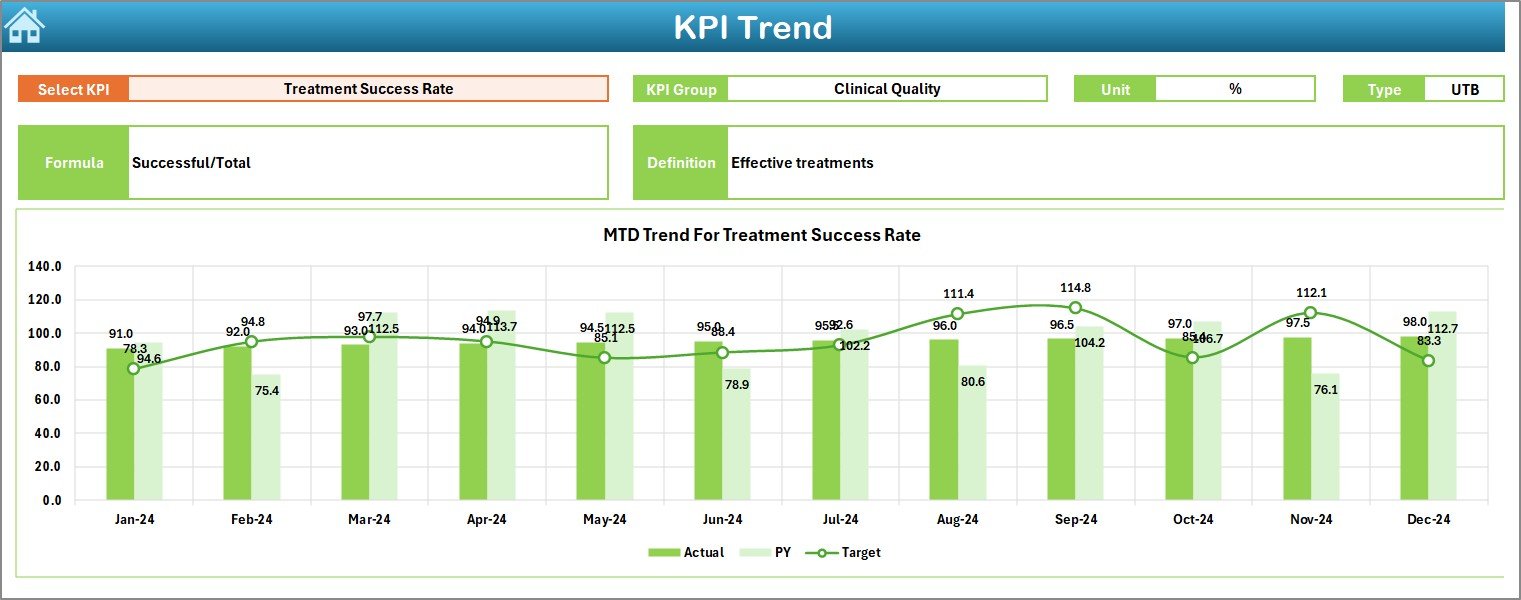
Trend Sheet
The Trend Sheet focuses on performance movement over time.
User Interaction
- KPI Name selection drop-down at cell C3
KPI Information Displayed
- KPI Group
- KPI Unit
- KPI Type (Lower the Better or Upper the Better)
- KPI Formula
- KPI Definition
Trend Analysis Features
- MTD trend chart for Actual, Target, and Previous Year
- YTD trend chart for Actual, Target, and Previous Year
Because of this design, clinics analyze not just current performance but also performance direction.
Click to buy Dermatology Clinics KPI Dashboard in Excel
Actual Numbers
The Actual Numbers Input Sheet stores real operational and financial data.
Data Entry Process
- Enter monthly Actual values
- Enter both MTD and YTD numbers
- Change the starting month from cell E1
Benefits of This Sheet
- Structured data entry
- No formula tampering
- Consistent data flow to dashboard
Therefore, even non-technical users can update data confidently.

Click to buy Dermatology Clinics KPI Dashboard in Excel
Target Sheet
The Target Sheet captures planned or expected performance values.
Data Captured
- Monthly MTD Targets
- Monthly YTD Targets
- KPI-wise targets
Why Target Tracking Matters
- Helps clinics set performance benchmarks
- Enables Target vs Actual comparison
- Improves planning and accountability
As a result, management stays proactive instead of reactive.

Click to buy Dermatology Clinics KPI Dashboard in Excel
Previous Year Number Sheet
The Previous Year Number Sheet allows clinics to perform year-over-year analysis.
Data Entry Details
- Enter previous year MTD values
- Enter previous year YTD values
- Match KPI structure with current year
Benefits of Previous Year Comparison
- Identify growth trends
- Measure long-term performance
- Spot seasonal patterns
Therefore, clinics gain deeper strategic insights.

Click to buy Dermatology Clinics KPI Dashboard in Excel
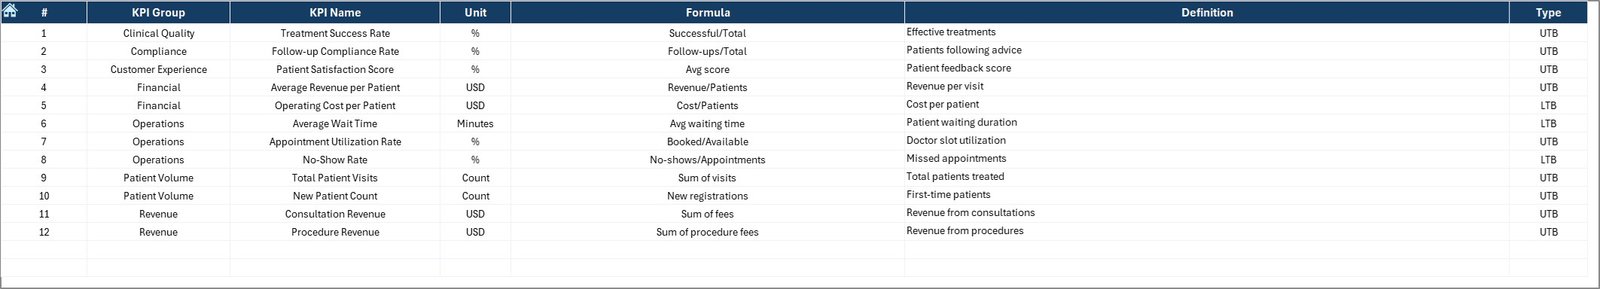
the KPI Definition Sheet
The KPI Definition Sheet acts as the foundation of the dashboard.
Information Captured
- KPI Name
- KPI Group
- Unit of Measurement
- KPI Formula
- KPI Definition
Why This Sheet Is Critical
- Maintains KPI clarity
- Ensures consistent interpretation
- Helps new users understand metrics
As a result, reporting remains accurate and standardized.
Click to buy Dermatology Clinics KPI Dashboard in Excel
What KPIs Can a Dermatology Clinics KPI Dashboard Track?
A Dermatology Clinics KPI Dashboard in Excel can track a wide range of clinical, operational, and financial KPIs.
Clinical KPIs
- Patient Visits
- Treatment Success Rate
- Follow-Up Compliance
- Procedure Volume
Operational KPIs
- Appointment Utilization Rate
- Average Waiting Time
- Doctor Productivity
- Staff Efficiency
Financial KPIs
- Revenue per Patient
- Monthly Revenue
- Cost per Treatment
- Profit Margin
Because the dashboard remains flexible, clinics can add or modify KPIs easily.
Advantages of Dermatology Clinics KPI Dashboard in Excel
Using a Dermatology Clinics KPI Dashboard in Excel offers several business and operational advantages.
Key Advantages
- Centralized Performance Monitoring
- MTD and YTD Performance Visibility
- Target vs Actual Tracking
- Previous Year Comparison
- Improved Decision-Making Speed
- No Dependency on Expensive BI Tools
- Fully Customizable Excel Structure
Moreover, Excel-based dashboards reduce training effort because most teams already know Excel.
How Does This Dashboard Improve Decision-Making?
The dashboard converts numbers into insights.
Because of real-time visibility:
- Managers identify weak areas quickly
- Doctors monitor performance objectively
- Finance teams track revenue accurately
- Operations teams improve efficiency
As a result, clinics make faster and better decisions every month.
Best Practices for the Dermatology Clinics KPI Dashboard in Excel
To get maximum value, clinics should follow these best practices.
Best Practices
- Define KPIs clearly before implementation
- Keep KPI definitions standardized
- Update Actual data monthly without delay
- Review dashboard during monthly review meetings
- Compare MTD and YTD trends regularly
- Avoid unnecessary KPI overload
- Validate data accuracy before analysis
Following these practices ensures reliable insights and consistent performance improvement.
Who Should Use a Dermatology Clinics KPI Dashboard in Excel?
This dashboard benefits multiple stakeholders.
Ideal Users
- Dermatology Clinic Owners
- Clinic Administrators
- Practice Managers
- Finance Teams
- Operations Teams
- Business Analysts
Whether you manage a single clinic or multiple locations, this dashboard adapts easily.
How Is Excel Better Than Manual Reporting for Dermatology Clinics?
Manual reporting consumes time and increases errors.
However, Excel dashboards:
- Automate calculations
- Reduce manual effort
- Standardize reporting
- Improve accuracy
- Save time
Therefore, Excel becomes a smarter reporting solution.
Can Small Dermatology Clinics Use This Dashboard?
Yes, absolutely.
Small clinics benefit even more because:
- They avoid expensive software
- They track performance professionally
- They plan growth strategically
Excel keeps implementation simple and affordable.
Conclusion: Why Dermatology Clinics Should Use a KPI Dashboard in Excel
A Dermatology Clinics KPI Dashboard in Excel transforms how clinics monitor and manage performance. Instead of relying on guesswork, clinics use real data to drive decisions.
Because the dashboard offers structured sheets, automated analysis, trend tracking, and clear KPI definitions, it becomes an essential management tool. Moreover, its Excel-based design keeps it flexible, affordable, and easy to maintain.
Ultimately, clinics that adopt KPI dashboards gain clarity, control, and confidence in their operations.
Frequently Asked Questions (FAQs)
What is a Dermatology Clinics KPI Dashboard in Excel?
A Dermatology Clinics KPI Dashboard in Excel is a centralized Excel tool that tracks clinical, operational, and financial KPIs using structured sheets and automated visuals.
Can I customize KPIs in this dashboard?
Yes, you can easily add, remove, or modify KPIs using the KPI Definition Sheet.
Does this dashboard require advanced Excel knowledge?
No, basic Excel knowledge is sufficient for data entry and dashboard usage.
How often should clinics update the dashboard?
Clinics should update the dashboard monthly to maintain accurate insights.
Can this dashboard support multiple clinic locations?
Yes, with minor customization, the dashboard can support multi-location analysis.
Is this dashboard suitable for non-technical users?
Yes, the dashboard uses simple layouts, drop-downs, and structured input sheets.
Visit our YouTube channel to learn step-by-step video tutorials
Watch the step-by-step video tutorial:
Click to buy Dermatology Clinics KPI Dashboard in Excel