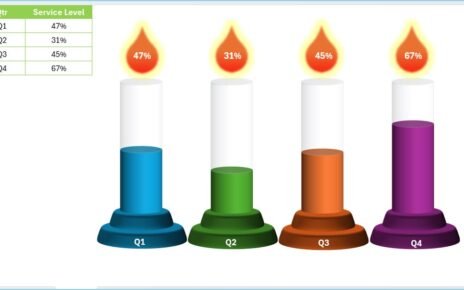
Elevate your data visualization with the Quick 3D Container Chart in Excel. This chart allows you to present KPI metrics such as Service Level, Quality Score, or Gross Margin in an engaging and visually striking way using 3D stacked columns. With two stunning versions—Cylinder and Box—you can choose the style that best fits your data storytelling needs.

Key Features:
- Two versions: Cylinder and Box 3D container charts.
- Ideal for showcasing KPI metrics like Service Level, Quality Score, and Gross Margin.
- Compatible with Microsoft Excel for easy integration into your reports.
Read the detailed blog post


