In today’s competitive entertainment industry, edutainment parks must balance fun, learning, and profitability. However, managing operations, tracking visitor performance, and analyzing revenue can quickly become overwhelming.
So, how can you monitor KPIs, track targets, and improve performance in one place?
The answer is simple — Edutainment Parks KPI Dashboard in Power BI.
In this complete guide, you will learn everything about this powerful dashboard. Moreover, you will understand its structure, features, benefits, and best practices. By the end, you will be ready to use this dashboard to make better and faster decisions.
What is an Edutainment Parks KPI Dashboard in Power BI?
An Edutainment Parks KPI Dashboard in Power BI is an interactive reporting tool that helps park operators track and analyze key performance indicators (KPIs).
Instead of using multiple spreadsheets, this dashboard allows you to:
- Monitor visitor trends
- Track revenue and operational KPIs
- Compare actual vs target performance
- Analyze year-over-year growth
Moreover, it transforms complex data into simple visuals.
Why is KPI Tracking Important for Edutainment Parks?
Click to Buy Edutainment Parks KPI Dashboard in Power BI
Before diving deeper, let’s understand why KPI tracking matters.
How Does KPI Tracking Improve Park Performance?
KPI tracking helps edutainment parks:
- Improve visitor experience
- Increase revenue and profitability
- Optimize operations
- Identify underperforming areas
As a result, park management can make smarter decisions.
What Does This Dashboard Include?
This dashboard is built in Power BI and uses Excel as a data source. It includes three main pages that provide complete insights.
Let’s explore each one in detail.
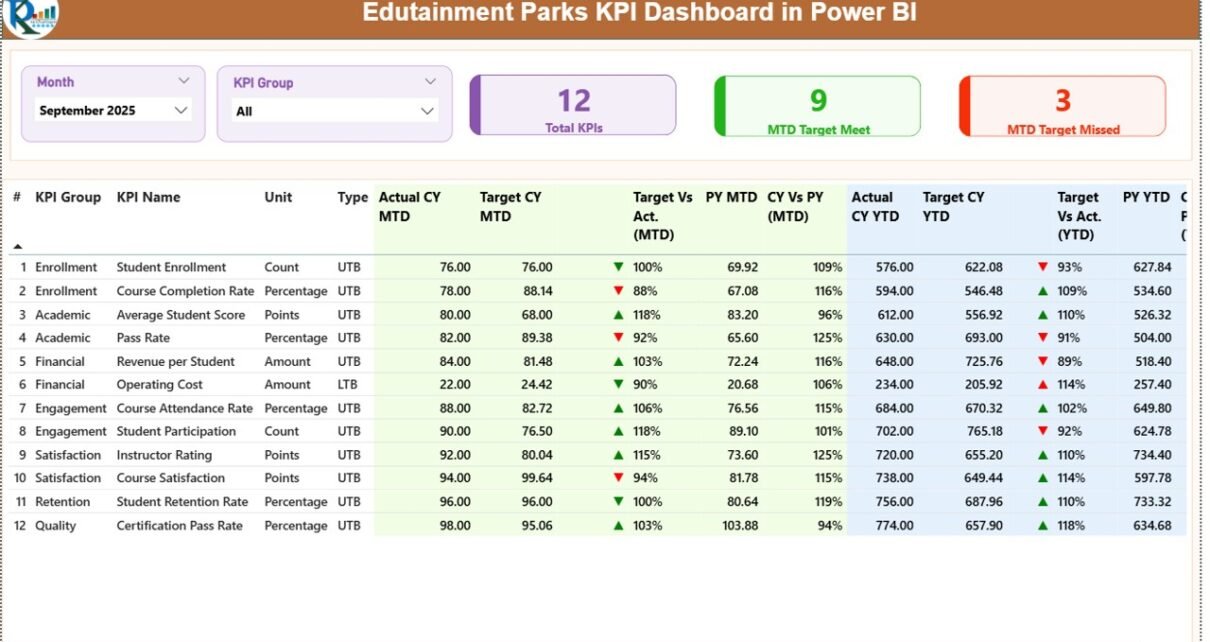
📊 Summary Page: How Can You Monitor KPIs Easily?
The Summary Page is the main page of the dashboard. It provides a complete overview of performance.
🔹 Top Filters
- Month Slicer → Filter data by selected month
- KPI Group Slicer → Filter KPIs by category
These filters allow dynamic and interactive analysis.
📌 Key KPI Cards
At the top, you will find three important cards:
- Total KPIs Count
- MTD Target Met Count
- MTD Target Missed Count
Detailed KPI Table
The dashboard displays a detailed table with key KPI metrics.
KPI Details
- KPI Number → Unique identifier
- KPI Group → KPI category
- KPI Name → KPI title
- Unit → Measurement unit
- Type (LTB/UTB)
- LTB = Lower the Better
- UTB = Upper the Better
📅 MTD (Month-to-Date) Metrics
- Actual CY MTD → Current performance
- Target CY MTD → Expected performance
- MTD Icon (▲ ▼) → Visual indicator
- Target vs Actual (MTD) → Performance %
- PY MTD → Previous year data
- CY vs PY (MTD) → Growth comparison
📆 YTD (Year-to-Date) Metrics
- Actual CY YTD → Current year performance
- Target CY YTD → Target values
- YTD Icon (▲ ▼) → Status indicator
- Target vs Actual (YTD) → Performance %
- PY YTD → Previous year YTD
- CY vs PY (YTD) → Growth comparison

Click to Buy Edutainment Parks KPI Dashboard in Power BI
KPI Trend Page: How Do KPIs Perform Over Time?
The KPI Trend Page helps you analyze trends and patterns.
Key Features
- Two combo charts
- Compare:
- Current Year Actual
- Previous Year Actual
- Targets
Types of Analysis
- MTD Trends
- YTD Trends
Interactive Slicer
- KPI selection slicer on the left

Click to Buy Edutainment Parks KPI Dashboard in Power BI
KPI Definition Page: What Do Your KPIs Mean?
The KPI Definition Page is a hidden drill-through page.
What Does It Show?
- KPI Formula
- KPI Definition
- KPI Type

How to Access It?
- Drill through from the Summary Page
- Use the back button to return
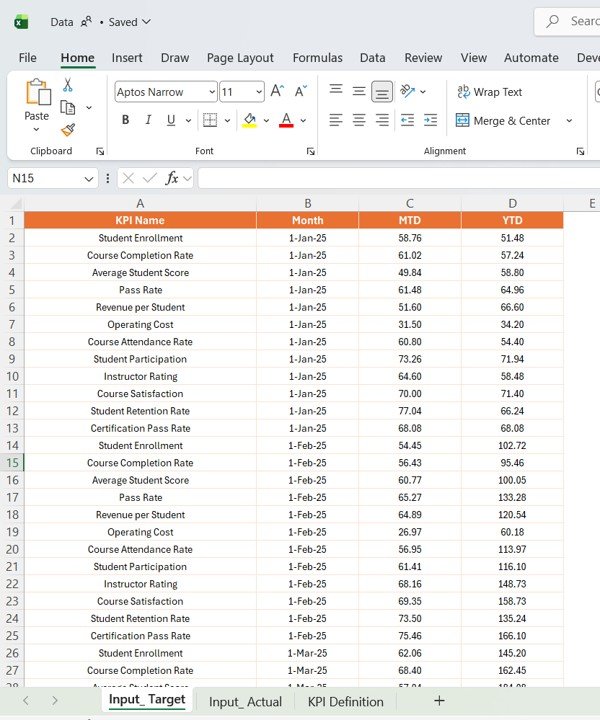
Excel Data Source: How Does the Backend Work?
This dashboard uses an Excel file as its data source. It contains three worksheets.
1️⃣ Input_Actual Sheet
You need to enter:
- KPI Name
- Month (First date of month)
- MTD values
- YTD values

Click to Buy Edutainment Parks KPI Dashboard in Power BI
2️⃣ Input_Target Sheet
Here, you enter:
- KPI Name
- Month
- Target MTD values
- Target YTD values
3️⃣ KPI Definition Sheet
This sheet includes:
- KPI Number
- KPI Group
- KPI Name
- Unit
- Formula
- Definition
- Type (LTB/UTB)

Click to Buy Edutainment Parks KPI Dashboard in Power BI
Advantages of Edutainment Parks KPI Dashboard in Power BI
🚀 Key Advantages
- Centralized Data View → All KPIs in one place
- Interactive Filters → Easy analysis
- MTD & YTD Tracking → Monitor performance
- Target Comparison → Identify gaps
- Visual Indicators → Quick insights
- Drill-Through Analysis → Deep insights
Opportunities for Improvement in KPI Tracking
Even though the dashboard is powerful, improvements can enhance its value.
🔧 Areas to Improve
- Automate data updates
- Integrate real-time systems
- Add predictive analytics
- Improve data quality
- Expand KPI categories
Best Practices for the Edutainment Parks KPI Dashboard in Power BI
Click to Buy Edutainment Parks KPI Dashboard in Power BI
To get the best results, follow these best practices.
✅ Best Practices
- Keep Data Clean → Ensure accuracy
- Update Data Regularly → Maintain relevance
- Focus on Key KPIs → Avoid clutter
- Use Clear KPI Definitions → Avoid confusion
- Train Users → Improve adoption
- Validate Data Frequently → Maintain reliability
Conclusion: Why This Dashboard is a Must-Have?
To sum up, the Edutainment Parks KPI Dashboard in Power BI is a powerful solution for tracking and improving performance.
It helps you monitor KPIs, compare targets, and make smarter decisions. Moreover, it simplifies complex data into actionable insights.
Therefore, if you want to improve efficiency, increase revenue, and enhance visitor experience, this dashboard is essential.
Visit our YouTube channel to learn step-by-step video tutorials
Click to Buy Edutainment Parks KPI Dashboard in Power BI