Employee benefits are a vital part of any organization’s human resources strategy. They contribute significantly to employee satisfaction and retention. Understanding how well employees are utilizing the benefits offered by an organization can provide insights into the effectiveness of those programs. A well-structured Employee Benefits Utilization KPI Dashboard in Excel helps businesses track and analyze key metrics related to employee benefits usage, ensuring that benefits are being effectively utilized, and areas for improvement are identified.
In this article, we will explore how to create a dynamic Employee Benefits Utilization KPI Dashboard in Excel. This dashboard will allow HR managers, executives, and other stakeholders to visualize the utilization of employee benefits across different departments, track trends, and make informed decisions.
What is an Employee Benefits Utilization KPI Dashboard in Excel?
An Employee Benefits Utilization KPI Dashboard in Excel is a tool designed to track and analyze the usage of various employee benefits, such as health insurance, retirement plans, and paid time off (PTO). It offers valuable insights into how employees are engaging with these benefits, helping HR teams evaluate the effectiveness of their offerings.
This dashboard consolidates critical data into easy-to-read visuals and key performance indicators (KPIs), allowing organizations to track utilization rates, compare them against targets, and analyze trends over time.
Key Features of the Employee Benefits Utilization KPI Dashboard
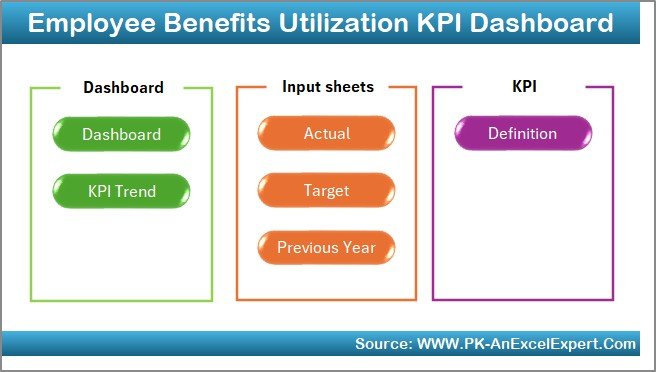
The Employee Benefits Utilization KPI Dashboard in Excel includes seven essential worksheets. Each of these worksheets plays a specific role in managing and analyzing the data related to employee benefits.
1. Home Sheet Tab
The Home Sheet acts as the central navigation hub of the dashboard. Users can quickly jump to any of the other six sheets from this main page. It serves as a dashboard overview, giving users access to all the detailed sheets in one place.
Click to buy Employee Benefits Utilization KPI Dashboard in Excel
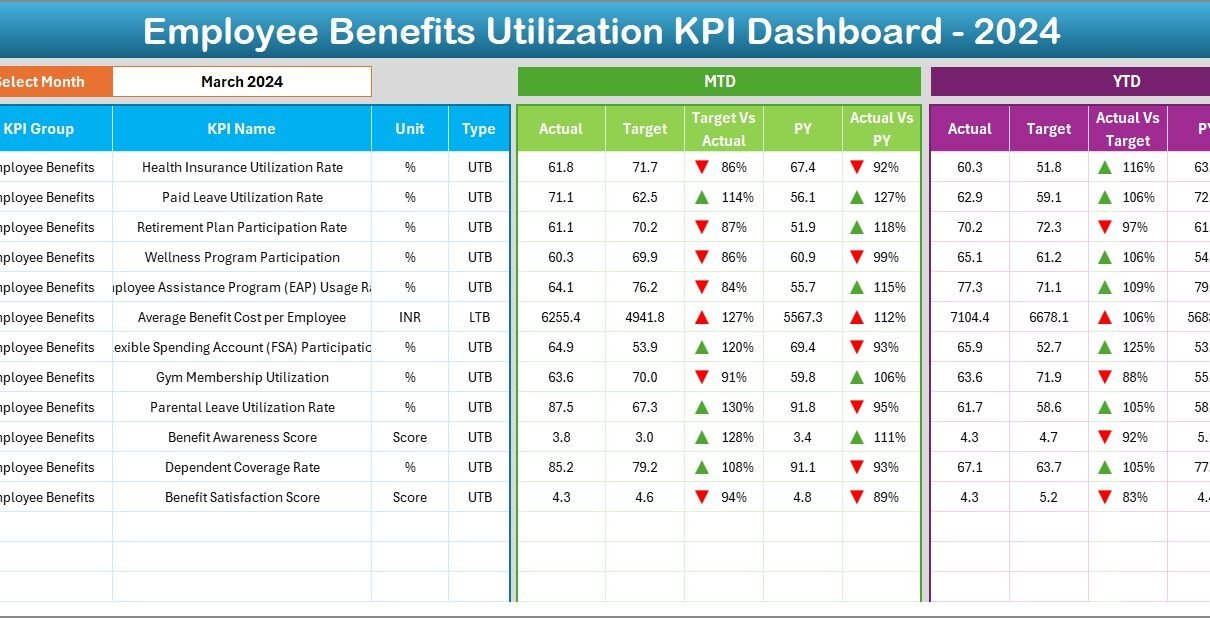
2. Dashboard Sheet Tab
The Dashboard Sheet is where the core data is visualized. It features several key metrics and KPIs that offer insights into employee benefits utilization:
-
MTD (Month-to-Date) Actual: This metric shows the actual data for employee benefits usage for the current month.
-
YTD (Year-to-Date) Actual: This displays the total employee benefits usage for the year up to the current month.
-
Target vs. Actual: This comparison helps track whether actual utilization meets the set target for each benefit.
-
Previous Year Data: A comparison of the current year’s data with the previous year’s utilization.
All the metrics on the dashboard are interactive, allowing users to select a specific month from a dropdown menu (located in Range D3), which will dynamically update the data displayed on the dashboard.
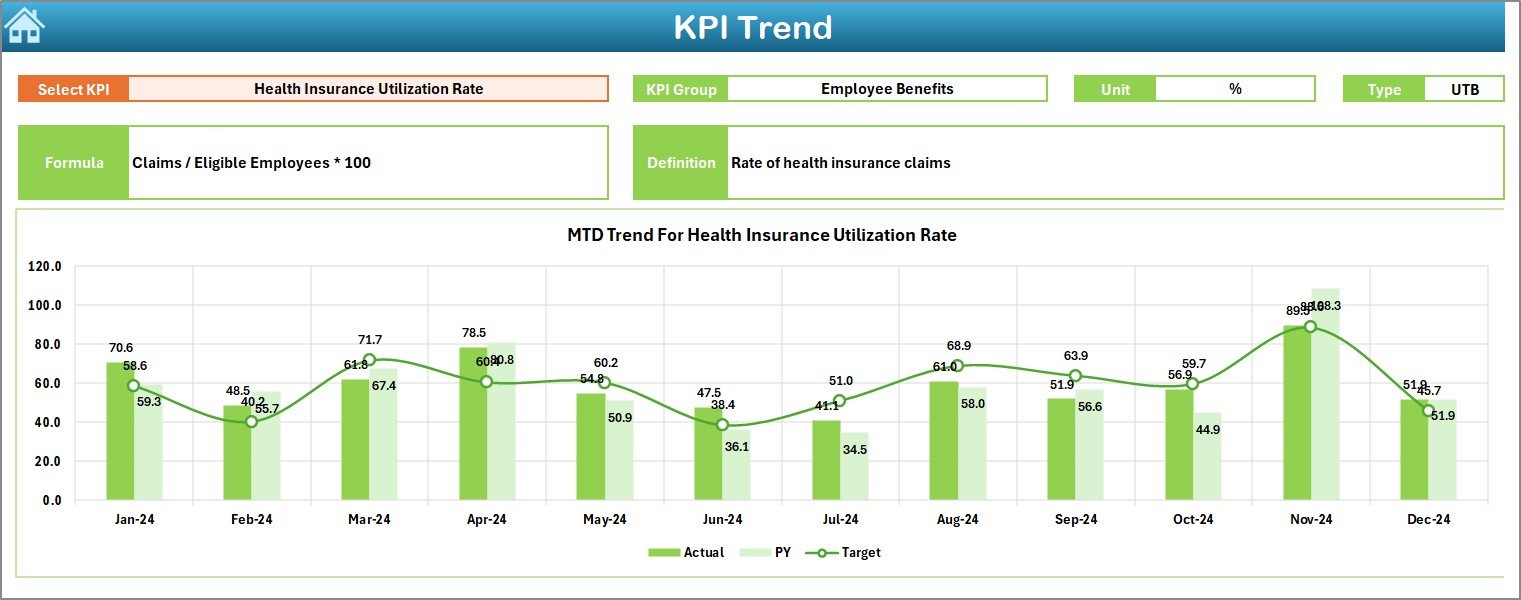
3. KPI Trend Sheet Tab
The KPI Trend Sheet is where you can select individual KPIs to analyze over time. It displays:
-
KPI Group: The category to which the KPI belongs (e.g., Health Benefits, Retirement Plans).
-
KPI Unit: The unit of measurement for the KPI (e.g., Percentage, Number of Employees).
-
KPI Type: Whether the KPI is Upper the Better or Lower the Better.
-
Formula: The calculation used to derive the KPI.
-
Definition: A description of what the KPI measures and how it is used.
This sheet helps you track the trends of specific KPIs and see how they perform over time.
Click to buy Employee Benefits Utilization KPI Dashboard in Excel
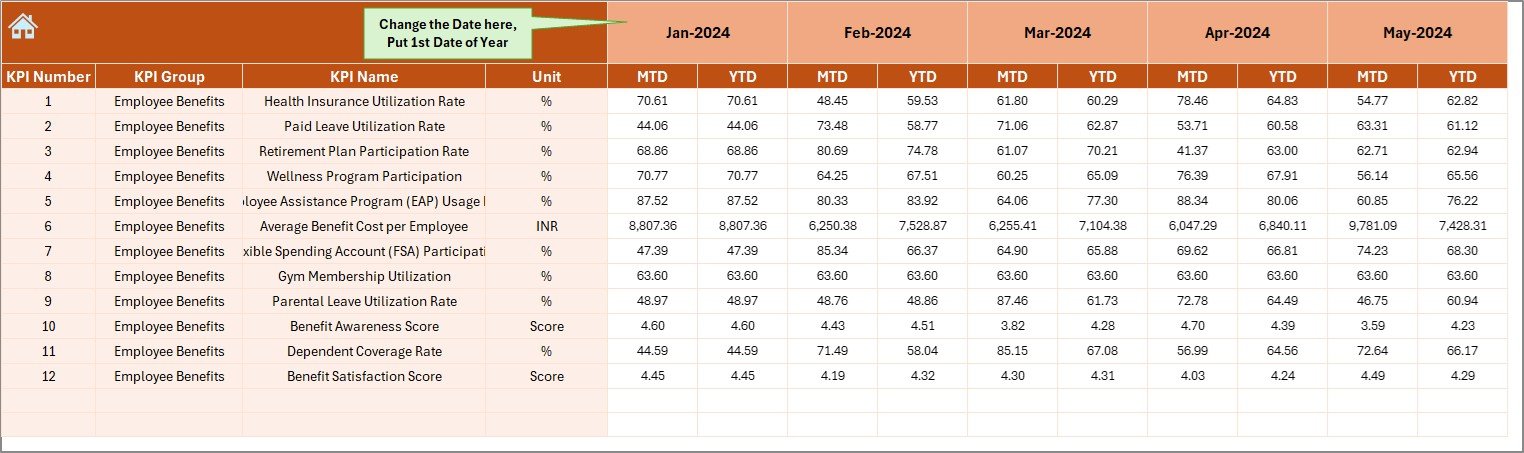
4. Actual Number Sheet Tab
The Actual Number Sheet is where the actual data for MTD and YTD is entered. This sheet requires users to input the actual numbers for each KPI, ensuring that the dashboard reflects the most up-to-date information.
Users can select the specific month from the dropdown in Range E1, which will automatically adjust the month and year for which the data is being entered.
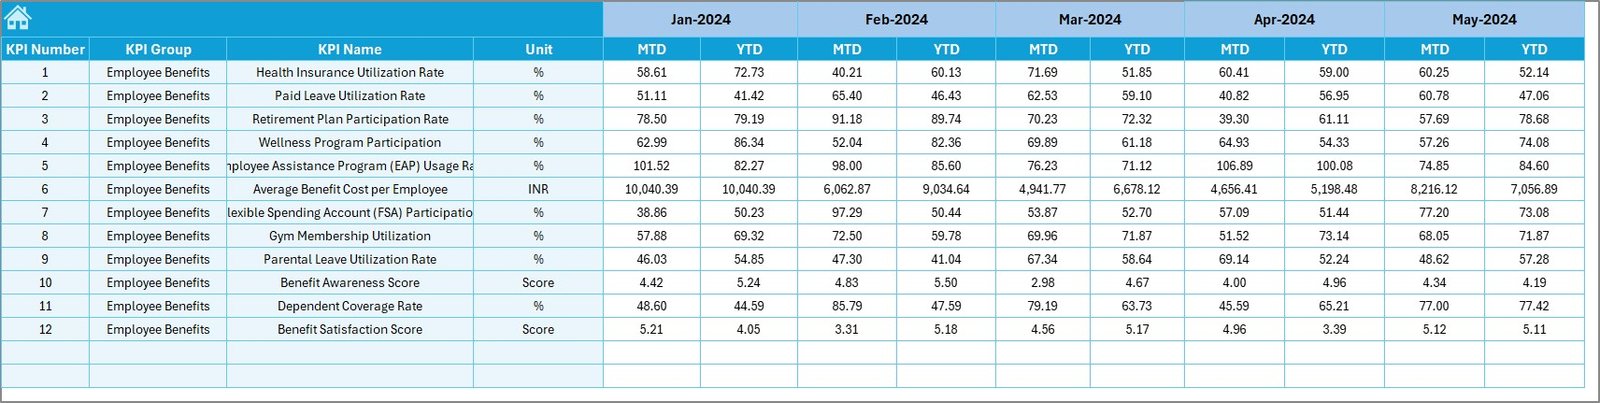
5. Target Sheet Tab
In the Target Sheet, you enter the target values for each KPI, both for MTD and YTD. These targets represent the desired or expected utilization levels for each employee benefit. Having the targets set will enable you to compare them against the actual values displayed on the dashboard, giving you clear insights into whether the benefits are being utilized as expected.
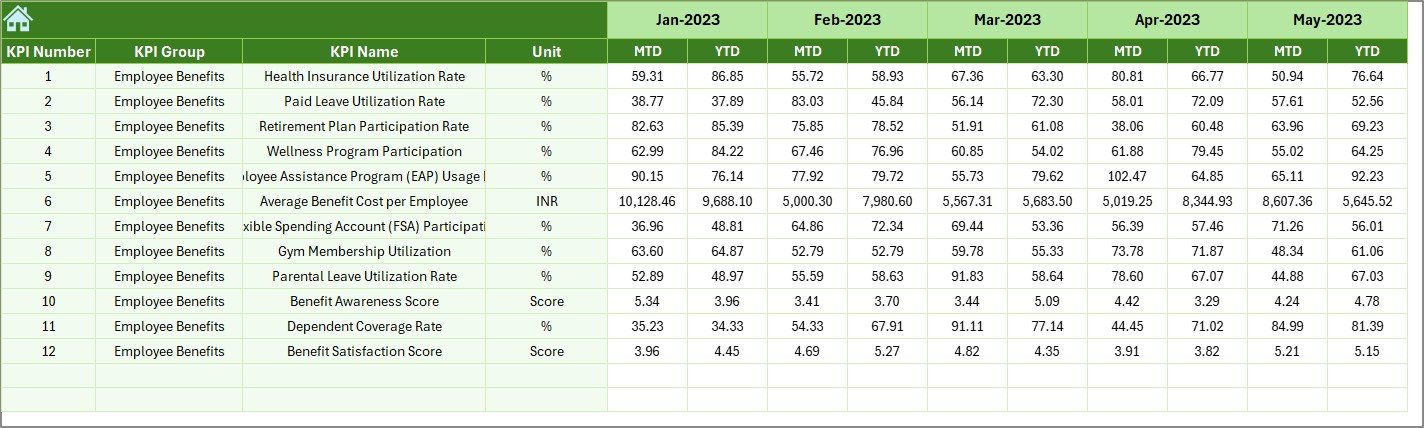
6. Previous Year Numbers Sheet Tab
This sheet allows users to input the Previous Year’s Data for comparison with the current year. It helps in analyzing trends, identifying seasonality, and comparing how the utilization of benefits has changed from the previous year to the current one.
Click to buy Employee Benefits Utilization KPI Dashboard in Excel
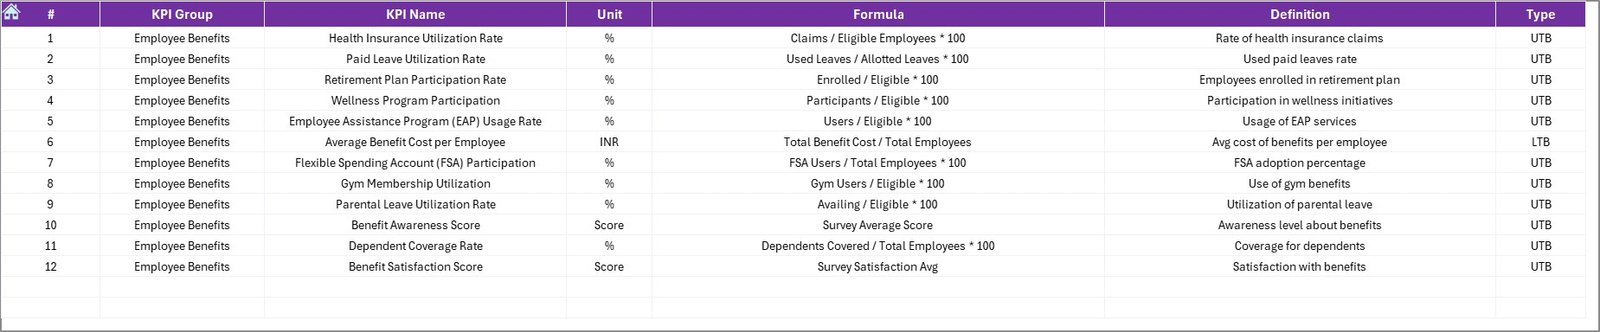
7. KPI Definition Sheet Tab
The KPI Definition Sheet contains detailed descriptions of each KPI, including:
-
KPI Name
-
KPI Group
-
Unit
-
Formula
-
Definition
This sheet helps users understand the calculations behind each KPI and provides transparency about how the data is being measured.
Advantages of the Employee Benefits Utilization KPI Dashboard in Excel
The Employee Benefits Utilization KPI Dashboard provides a comprehensive view of employee benefit usage, which can be a game-changer for HR departments and organizational leaders. Here are some of the key advantages:
-
Improved Decision Making: With real-time data and visual insights, HR teams and management can make informed decisions about employee benefits. The dashboard highlights areas where utilization is below target, enabling timely adjustments.
-
Tracking and Benchmarking: The dashboard allows you to track the utilization of employee benefits against set targets, historical data, and benchmarks. This helps in identifying performance gaps and opportunities for improvement.
-
Enhanced Reporting: The dashboard simplifies reporting by consolidating data into a visually appealing and easy-to-understand format. This reduces the time spent generating reports and increases clarity.
-
Employee Satisfaction: By understanding which benefits are being underutilized, organizations can make improvements to their offerings, potentially boosting employee satisfaction and retention.
-
Cost Optimization: By tracking benefit utilization, organizations can identify areas where resources might be better allocated, potentially leading to cost savings in employee benefit programs.
Opportunity for Improvement in Employee Benefits Utilization
Click to buy Employee Benefits Utilization KPI Dashboard in Excel
Even the most well-designed dashboards have room for improvement. Here are some areas where the Employee Benefits Utilization KPI Dashboard could be enhanced:
-
Integration with HR Management Systems: To automate data entry, the dashboard could integrate with HRMS (Human Resource Management System) or employee benefits software. This would save time and reduce errors associated with manual data entry.
-
Predictive Analytics: By incorporating machine learning algorithms, the dashboard could predict future benefits utilization trends, helping HR teams anticipate needs and make proactive adjustments.
-
Employee Segmentation: The dashboard could benefit from including employee segmentation (e.g., by department, age, or tenure) to analyze how different groups are utilizing their benefits, providing more granular insights.
-
Increased Interactivity: Adding more interactive elements, such as drill-down capabilities, could allow users to explore data in greater detail, providing a deeper understanding of utilization trends.
Best Practices for the Employee Benefits Utilization KPI Dashboard
To ensure that the Employee Benefits Utilization KPI Dashboard delivers maximum value, it’s essential to follow some best practices:
-
Regularly Update Data: To keep the dashboard relevant, make sure to update the data regularly. This can be done monthly or quarterly, depending on the frequency of the benefit program changes.
-
Set Clear Targets: Establish realistic and clear targets for each KPI. These targets should be based on historical data, industry benchmarks, and organizational goals.
-
Engage Employees: Encourage employees to provide feedback on the benefits they use. Their input can help improve the dashboard and benefit programs.
-
Automate Data Entry: Use automation tools to pull data from other systems, reducing the need for manual entry and ensuring data accuracy.
-
Customize for Your Organization: Customize the dashboard to reflect your organization’s unique benefits structure and KPIs. Tailor it to the specific needs and goals of your workforce.
Conclusion
The Employee Benefits Utilization KPI Dashboard in Excel is a powerful tool for tracking and analyzing the usage of employee benefits. It offers valuable insights that can help HR teams optimize benefit programs, enhance employee satisfaction, and make data-driven decisions. By leveraging Excel’s functionality, businesses can create a dynamic dashboard that serves as an essential resource for monitoring the effectiveness of employee benefits offerings.
With proper data entry, regular updates, and adherence to best practices, organizations can use this dashboard to ensure their employee benefits programs are being fully utilized and continuously improved.
Frequently Asked Questions (FAQs)
Click to buy Employee Benefits Utilization KPI Dashboard in Excel
1. What is an Employee Benefits Utilization KPI Dashboard?
An Employee Benefits Utilization KPI Dashboard is a tool used to track the usage of employee benefits like health insurance, retirement plans, and paid leave. It provides insights into how effectively employees are using these benefits.
2. How do I use the Employee Benefits Utilization KPI Dashboard?
To use the dashboard, input the actual data, target values, and previous year’s data into the designated sheets. The dashboard will automatically update to display relevant KPIs, trends, and comparisons.
3. What KPIs are typically included in an Employee Benefits Utilization Dashboard?
Common KPIs include the number of benefits used, satisfaction scores, participation rates, claims data, and comparison of actual vs. target utilization.
4. Can I customize the dashboard for my company’s specific needs?
Yes, the dashboard is customizable. You can adjust the KPIs, add or remove data fields, and tailor the dashboard to match your company’s benefits structure.
5. How often should I update the data in the dashboard?
It’s recommended to update the dashboard regularly, at least once a month or quarter, to keep the data current and reflective of any changes in employee benefits usage.
Visit our YouTube channel to learn step-by-step video tutorials
Watch the step-by-step video Demo:
Click to buy Employee Benefits Utilization KPI Dashboard in Excel