Managing facilities leasing without proper performance tracking often leads to revenue leakage, underutilized space, and poor decision-making. Therefore, organizations now rely heavily on Facilities Leasing KPI Dashboards in Excel to gain clear, real-time visibility into leasing performance. This article explains everything you need to know about a Facilities Leasing KPI Dashboard in Excel, including its structure, features, advantages, best practices, and frequently asked questions.
If you manage commercial properties, corporate facilities, business parks, or leased office spaces, this guide will help you understand how to track, analyze, and improve leasing performance using Excel.
Click to buy Facilities Leasing KPI Dashboard in Excel
What Is a Facilities Leasing KPI Dashboard in Excel?
A Facilities Leasing KPI Dashboard in Excel is a structured, ready-to-use analytical tool that tracks key performance indicators related to leasing operations. It consolidates leasing data such as occupancy, revenue, lease duration, renewal rates, and cost efficiency into a single interactive Excel dashboard.
Instead of working with multiple spreadsheets, emails, and reports, this dashboard transforms raw leasing data into clear visuals, performance comparisons, and trends. As a result, decision-makers quickly identify gaps, risks, and opportunities.
Moreover, because it runs entirely in Excel, this dashboard remains cost-effective, flexible, and easy to customize for different facilities and lease models.
Why Do Facilities Teams Need a Leasing KPI Dashboard?
Facilities leasing involves multiple moving parts. Therefore, without proper monitoring, performance issues often go unnoticed. A Facilities Leasing KPI Dashboard in Excel solves this challenge by offering structured visibility.
Here is why facilities teams increasingly rely on it:
- It centralizes leasing performance data
- It tracks targets versus actual performance
- It compares current results with previous years
- It highlights underperforming KPIs instantly
- It supports data-driven leasing decisions
As a result, organizations improve space utilization, optimize lease revenue, and reduce operational inefficiencies.
What Are the Key KPIs in a Facilities Leasing Dashboard?
Facilities leasing KPIs vary by organization. However, most dashboards include KPIs from the following groups:
Common Facilities Leasing KPI Groups
- Occupancy & Utilization KPIs
- Financial & Revenue KPIs
- Lease Management KPIs
- Cost & Efficiency KPIs
- Compliance & Risk KPIs
Examples of Facilities Leasing KPIs
- Occupancy Rate %
- Lease Revenue per Sq. Ft.
- Vacancy Rate %
- Lease Renewal Rate %
- Average Lease Duration
- Maintenance Cost per Sq. Ft.
- Target vs Actual Lease Revenue
- Year-over-Year Revenue Growth %
Because each KPI includes units, formulas, definitions, and performance type, users clearly understand what each metric represents.
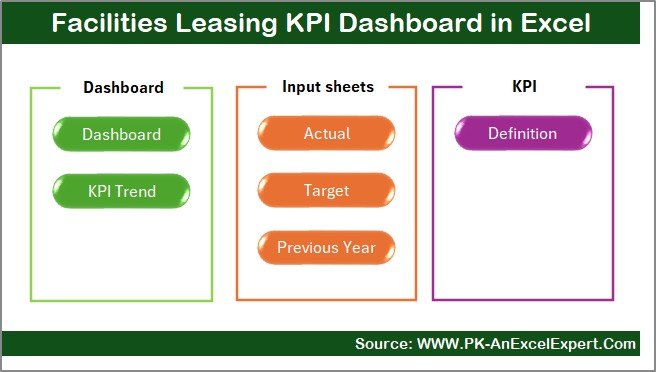
How Is the Facilities Leasing KPI Dashboard Structured in Excel?
This Facilities Leasing KPI Dashboard in Excel includes 7 professionally designed worksheets, each serving a specific purpose. Together, these sheets create a complete performance monitoring system.
Summary Page: How Does the Index Sheet Work?
The Summary Page acts as the index or navigation hub of the dashboard.
Key Features of the Summary Page
- Clean and user-friendly layout
- Six interactive buttons
- One-click navigation to all key sheets
- Ideal for senior management and quick access
Because of this design, users save time and navigate the dashboard effortlessly.
Click to buy Facilities Leasing KPI Dashboard in Excel
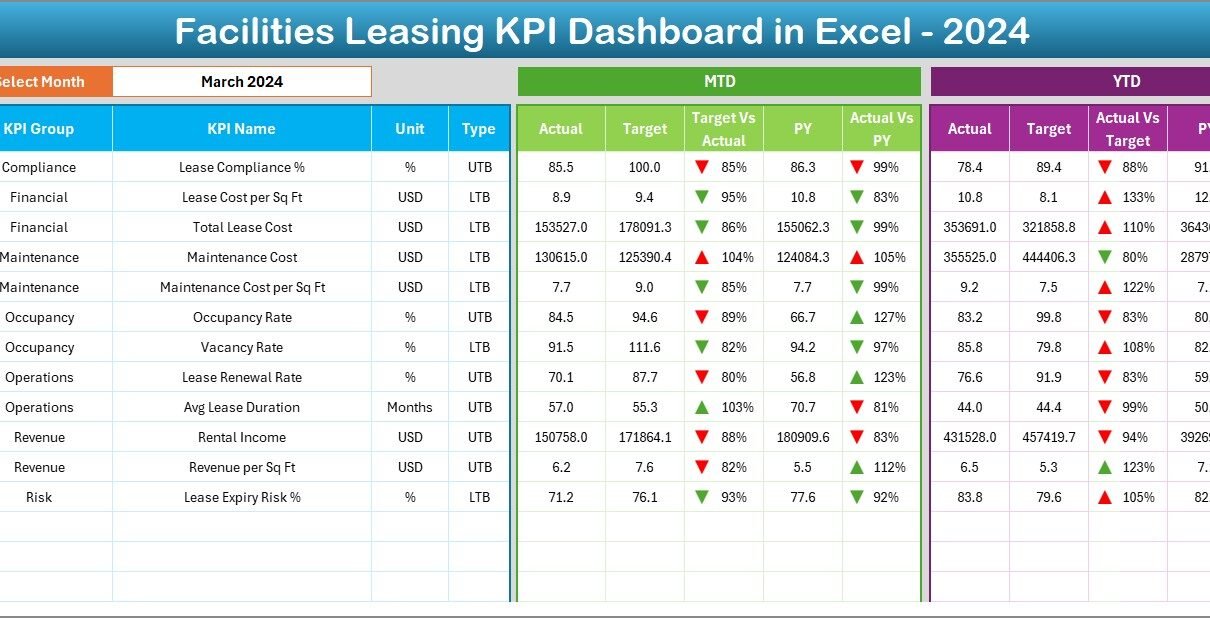
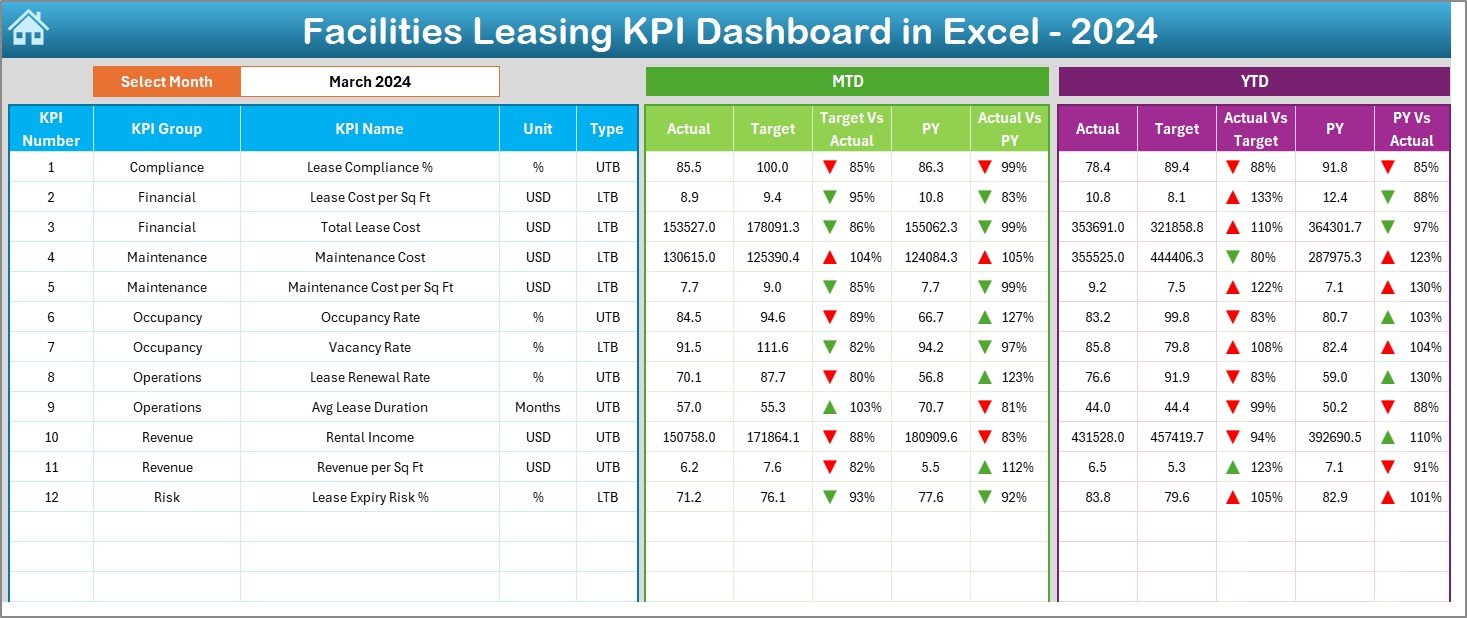
Dashboard Sheet: What Insights Does the Main Dashboard Provide?
The Dashboard Sheet serves as the core of the Facilities Leasing KPI Dashboard in Excel. It displays all KPI performance in a visually engaging format.
Key Features of the Dashboard Sheet
- Month selection drop-down in cell D3
- Automatic update of all KPIs based on selected month
- Clear separation between MTD and YTD analysis
- Conditional formatting with up and down arrows
MTD (Month-to-Date) Analysis
- MTD Actual
- MTD Target
- MTD Previous Year
- Target vs Actual comparison
- Previous Year vs Actual comparison
YTD (Year-to-Date) Analysis
- YTD Actual
- YTD Target
- YTD Previous Year
- Variance indicators with conditional formatting
Because of this structure, stakeholders instantly understand monthly and cumulative leasing performance.
Click to buy Facilities Leasing KPI Dashboard in Excel
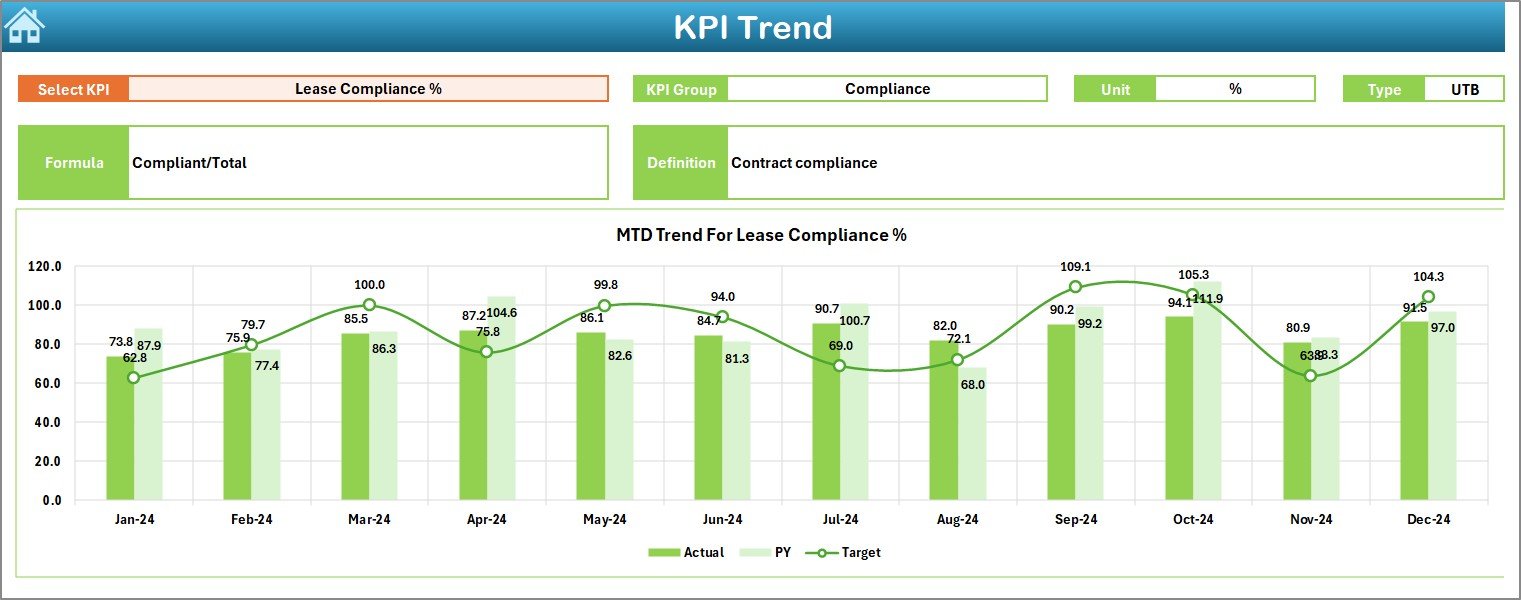
Trend Sheet: How Do You Analyze KPI Trends Over Time?
The Trend Sheet focuses on deep KPI-level analysis. It allows users to study performance movement across months.
How the Trend Sheet Works
- KPI selection drop-down in cell C3
- Automatic display of:
- KPI Group
- KPI Unit
- KPI Type (LTB or UTB)
- KPI Formula
- KPI Definition
Charts Included in the Trend Sheet
- MTD trend chart (Actual, Target, Previous Year)
- YTD trend chart (Actual, Target, Previous Year)
As a result, users identify patterns, seasonality, and recurring performance issues quickly.
Click to buy Facilities Leasing KPI Dashboard in Excel
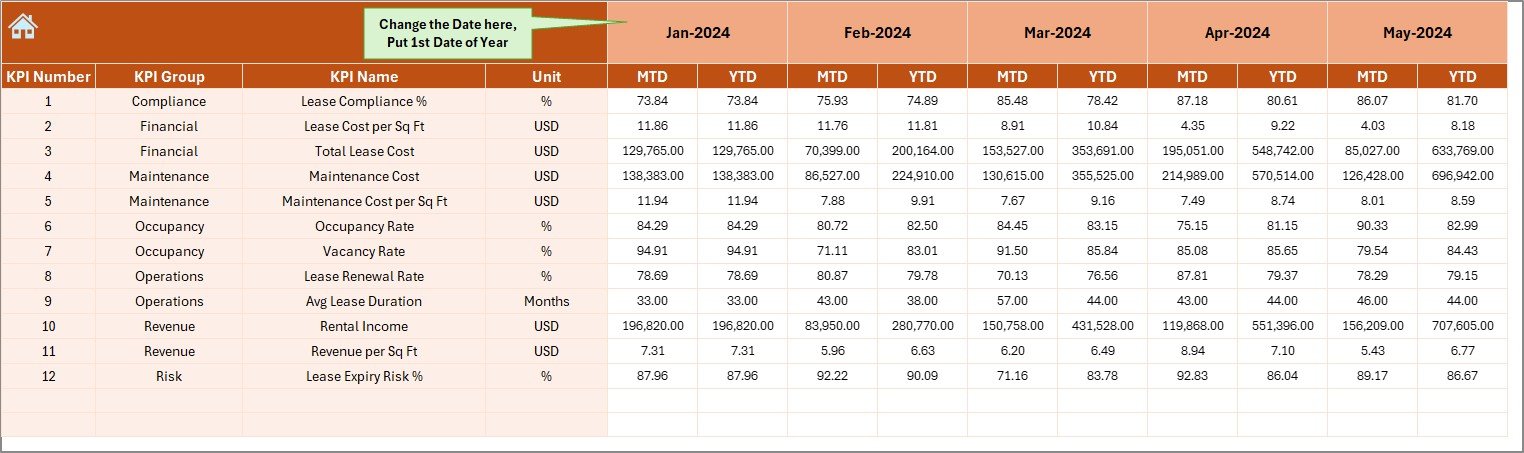
Actual Numbers Input Sheet: Where Do You Enter Actual Data?
The Actual Numbers Input Sheet allows structured entry of real leasing data.
Key Highlights
- Input fields for MTD and YTD actual values
- Month selection in cell E1
- Simple data-entry layout
- Supports full-year tracking by setting the first month
Because of this design, data entry remains easy and consistent for all users.
Click to buy Facilities Leasing KPI Dashboard in Excel
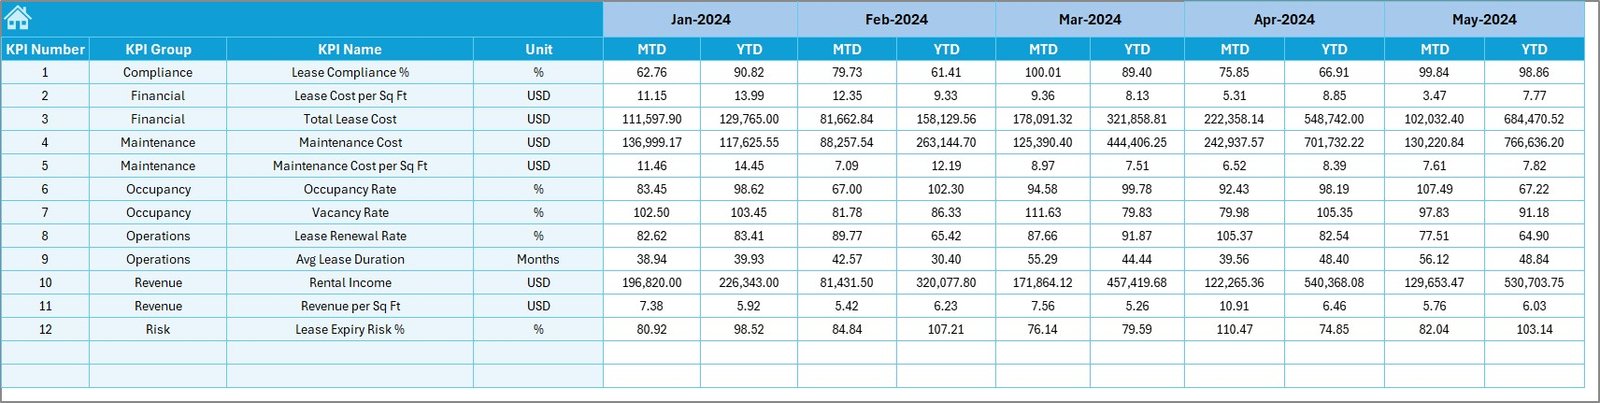
Target Sheet: How Do You Set Performance Goals?
The Target Sheet stores planned or benchmark values for each KPI.
Why the Target Sheet Matters
- Defines monthly and yearly leasing goals
- Enables Target vs Actual analysis
- Supports performance accountability
Moreover, this sheet ensures that all comparisons remain accurate and structured.
Click to buy Facilities Leasing KPI Dashboard in Excel
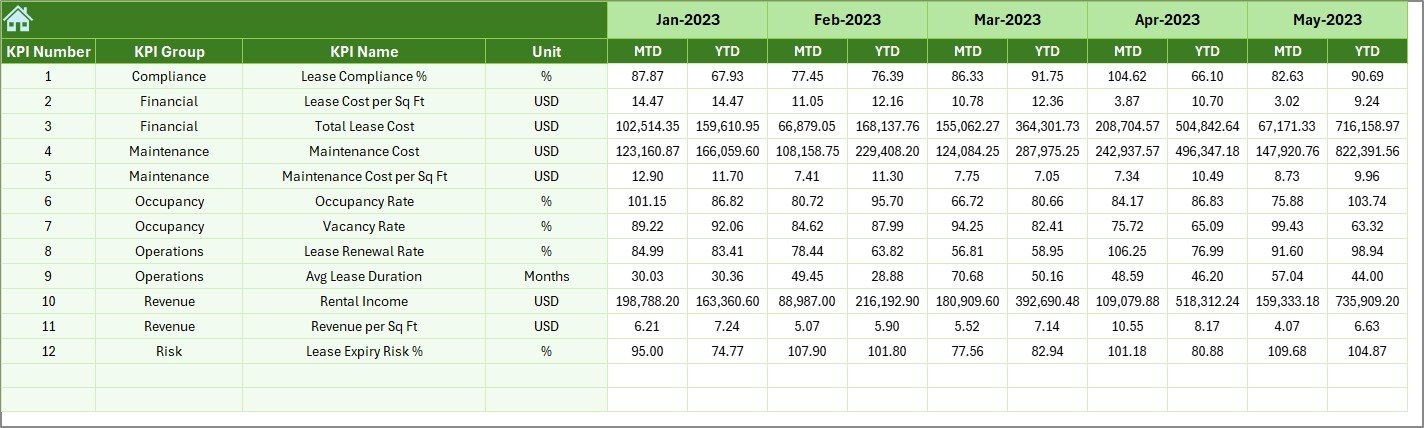
Previous Year Numbers Sheet: Why Compare Historical Data?
The Previous Year Numbers Sheet captures last year’s MTD and YTD values for each KPI.
Benefits of Previous Year Comparison
- Measures year-over-year growth
- Identifies long-term leasing trends
- Highlights improvement or decline clearly
Therefore, leadership teams gain historical context while reviewing current performance.
Click to buy Facilities Leasing KPI Dashboard in Excel
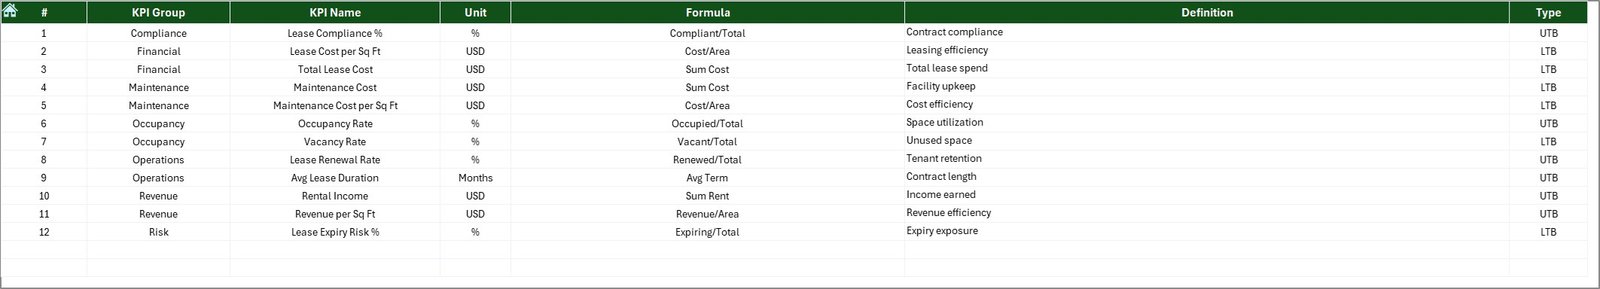
KPI Definition Sheet: Why Is KPI Documentation Important?
The KPI Definition Sheet acts as the backbone of the dashboard.
Information Stored in KPI Definition Sheet
- KPI Name
- KPI Group
- KPI Unit
- KPI Formula
- KPI Definition
- KPI Type (LTB or UTB)
Because of this sheet, users across departments interpret KPIs consistently without confusion.
Advantages of Facilities Leasing KPI Dashboard in Excel
Using a Facilities Leasing KPI Dashboard in Excel offers multiple business advantages.
Key Advantages
- Centralized leasing performance tracking
- Clear visibility into MTD and YTD metrics
- Easy comparison with targets and previous years
- No dependency on expensive BI tools
- Fully customizable Excel-based solution
- Suitable for organizations of all sizes
- Faster and more informed decision-making
As a result, facilities teams operate more efficiently and strategically.
How Does This Dashboard Improve Decision-Making?
The dashboard converts raw leasing data into actionable insights.
Decision-Making Benefits
- Identifies underperforming facilities quickly
- Highlights revenue gaps and occupancy risks
- Supports renegotiation and renewal strategies
- Improves space utilization planning
- Enables proactive corrective actions
Therefore, leadership teams no longer rely on assumptions or manual reports.
Who Should Use a Facilities Leasing KPI Dashboard?
This dashboard suits a wide range of professionals.
Ideal Users
- Facilities Managers
- Real Estate Managers
- Corporate Admin Teams
- Leasing and Property Teams
- Finance and Planning Teams
- Senior Management
Because it uses Excel, even non-technical users adopt it easily.
Best Practices for the Facilities Leasing KPI Dashboard in Excel
To maximize value, follow these best practices.
- Define KPIs Clearly
Always document KPI definitions, units, and formulas clearly. This practice avoids misinterpretation.
- Update Data Regularly
Enter actual numbers monthly to keep insights accurate and relevant.
- Set Realistic Targets
Align targets with historical data and business strategy to ensure meaningful comparisons.
- Review Trends Frequently
Analyze trend charts to detect performance shifts early.
- Use Conditional Formatting Wisely
Visual indicators like arrows and colors highlight issues instantly.
- Maintain Data Consistency
Use standardized formats across actual, target, and previous year sheets.
Limit Manual Changes on Dashboard Sheet
Restrict manual edits to prevent formula or visualization errors.
How Is Excel Better Than Complex BI Tools for Leasing KPIs?
While BI tools offer advanced analytics, Excel still delivers strong value.
Why Excel Works Best
- Lower implementation cost
- No licensing dependency
- Faster customization
- Offline accessibility
- Familiar interface for most users
Therefore, Excel remains a practical and scalable choice for facilities leasing analysis.
Can This Dashboard Scale with Business Growth?
Yes, the Facilities Leasing KPI Dashboard in Excel scales easily.
Scalability Features
- Add new KPIs without redesign
- Extend months and years easily
- Duplicate for multiple facilities or locations
- Integrate with Power BI later if needed
As a result, organizations future-proof their reporting structure.
Conclusion
A Facilities Leasing KPI Dashboard in Excel transforms leasing data into structured, actionable insights. By combining MTD and YTD analysis, target comparisons, trend visualization, and clear KPI documentation, this dashboard empowers facilities teams to manage leases proactively.
Because it runs entirely in Excel, it remains flexible, affordable, and easy to maintain. When used consistently and strategically, this dashboard improves occupancy planning, revenue optimization, and long-term leasing performance.
- Frequently Asked Questions (FAQs)
- What is a Facilities Leasing KPI Dashboard in Excel?
- It is an Excel-based analytical tool that tracks and visualizes leasing performance KPIs such as occupancy, revenue, and lease efficiency.
- Can beginners use this dashboard?
- Yes, because it uses Excel and simple input sheets, even non-technical users can use it easily.
- How often should I update the dashboard?
- You should update it monthly to ensure accurate MTD and YTD analysis.
- Can I add more KPIs to the dashboard?
- Yes, you can add new KPIs through the KPI Definition, Actual, Target, and Previous Year sheets.
- Does this dashboard support multiple facilities?
- Yes, you can duplicate the file or add facility identifiers for multi-location analysis.
- Is this dashboard suitable for small organizations?
- Absolutely. It works well for both small teams and large enterprises.
- Can I integrate this Excel dashboard with Power BI later?
- Yes, you can easily connect the structured data to Power BI for advanced analytics.
- Visit our YouTube channel to learn step-by-step video tutorials
Watch the step-by-step video tutorial:
Click to buy Facilities Leasing KPI Dashboard in Excel