In today’s competitive franchise industry, monitoring performance across multiple branches or outlets is crucial. Whether you manage a global restaurant chain, a fitness brand, or a retail network, having clear visibility into your franchise operations can make the difference between growth and stagnation.
The Franchise Performance KPI Dashboard in Power BI is a modern data visualization solution that brings your franchise metrics together in one interactive platform. Built on Microsoft Power BI, it consolidates data from an Excel file and converts it into insightful visuals that help you analyze performance trends, identify improvement areas, and make data-driven business decisions.
Let’s explore how this dashboard works, its unique features, advantages, and best practices for using it effectively.
Click to buy Franchise Performance KPI Dashboard in Power BI
What Is a Franchise Performance KPI Dashboard in Power BI?
A Franchise Performance KPI Dashboard is a business intelligence tool designed to measure and visualize key performance indicators (KPIs) across franchise locations. It allows you to monitor performance by month, region, product category, or any operational dimension relevant to your network.
Using Power BI’s dynamic capabilities, this dashboard helps franchise owners and managers view both Month-to-Date (MTD) and Year-to-Date (YTD) performance in real time. Instead of manually analyzing spreadsheets, you can interact with visuals, slicers, and trend charts to instantly see where each franchise stands.
Why Every Franchise Needs a KPI Dashboard
Running a franchise involves balancing consistency, profitability, and customer satisfaction across multiple locations. However, tracking performance manually can be time-consuming and error-prone.
Here’s why a Power BI-based KPI dashboard becomes essential:
- Centralized Reporting: Consolidates performance data from all outlets in one place.
- Real-Time Monitoring: Instantly tracks KPIs like sales, costs, profit margins, and compliance rates.
- Trend Visualization: Shows historical trends to help identify performance patterns.
- Quick Decision-Making: Empowers management with actionable insights.
- Transparency and Accountability: Encourages franchisees to maintain consistent performance standards.
Key Features of the Franchise Performance KPI Dashboard in Power BI
This dashboard consists of three main pages that make analysis smooth and structured. Each page plays a unique role in helping users understand franchise performance comprehensively.
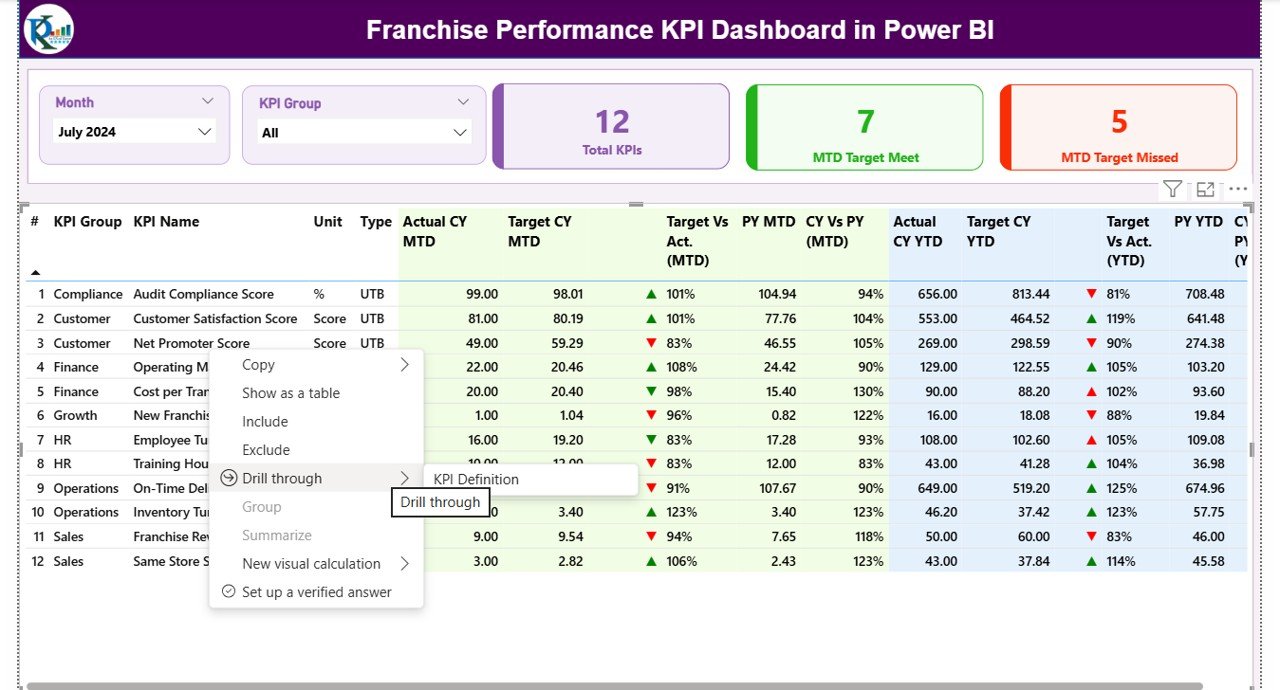
Summary Page
The Summary Page is the heart of the dashboard — where most of your decision-making begins.
Slicers and Filters
- Month Slicer: Quickly select the reporting month.
- KPI Group Slicer: Choose KPI categories like Sales, Customer Experience, or Operations.
Performance Cards
At the top, you’ll find three cards showing:
- Total KPIs Count
- MTD Target Met Count
- MTD Target Missed Count
These cards instantly summarize how your franchise is performing for the current period.
Click to buy Franchise Performance KPI Dashboard in Power BI
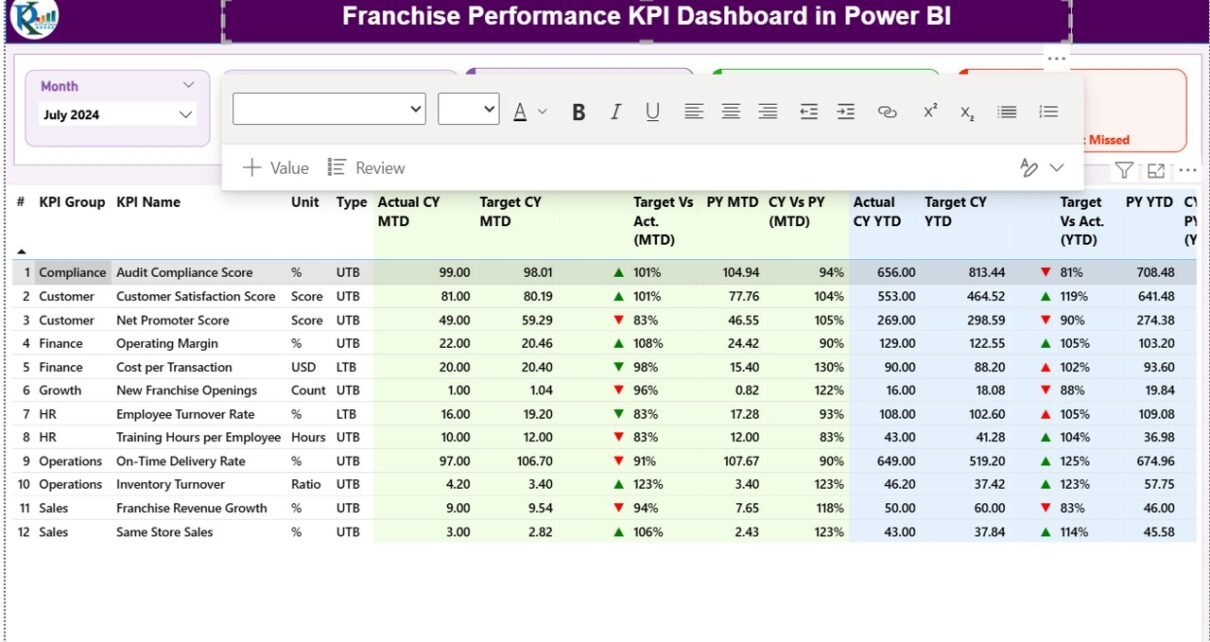
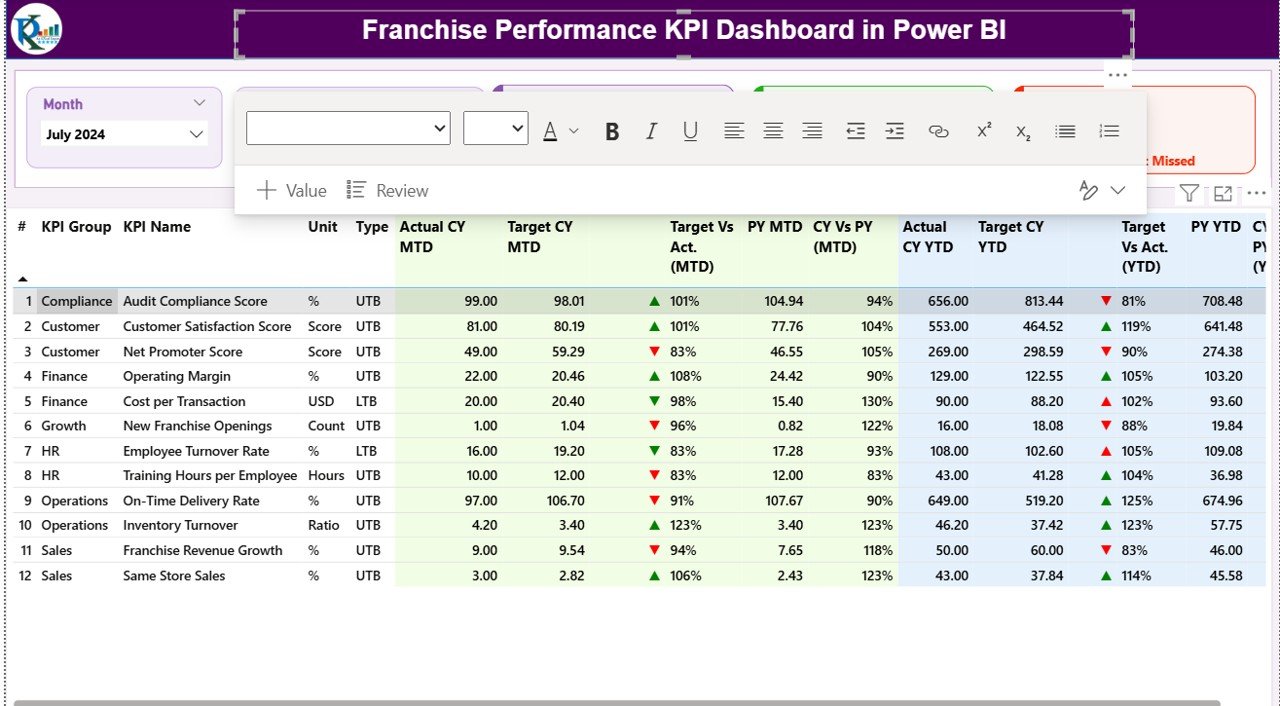
KPI Detail Table
Below the cards lies a comprehensive data table that displays:
- KPI Number: Unique identifier for each KPI.
- KPI Group & KPI Name: Categorization and title of each metric.
- Unit: Measurement unit such as %, $, or Number.
- Type: Defines whether the KPI is Lower the Better (LTB) or Upper the Better (UTB).
- Actual CY MTD / Target CY MTD: Current month’s actual vs. target performance.
- MTD Icon: Red ▼ for underperformance, Green ▲ for achieved/exceeded targets.
- Target vs. Actual (MTD): Displays MTD performance ratio in %.
- PY MTD & CY vs. PY (MTD): Compares current MTD against previous year’s MTD.
- Actual CY YTD / Target CY YTD: Displays cumulative YTD performance.
- YTD Icon and Target vs. Actual (YTD): Visual indicators for annual progress.
- PY YTD & CY vs. PY (YTD): Year-over-year comparison metrics.
This page provides a complete snapshot of both short-term and long-term performance for each KPI.
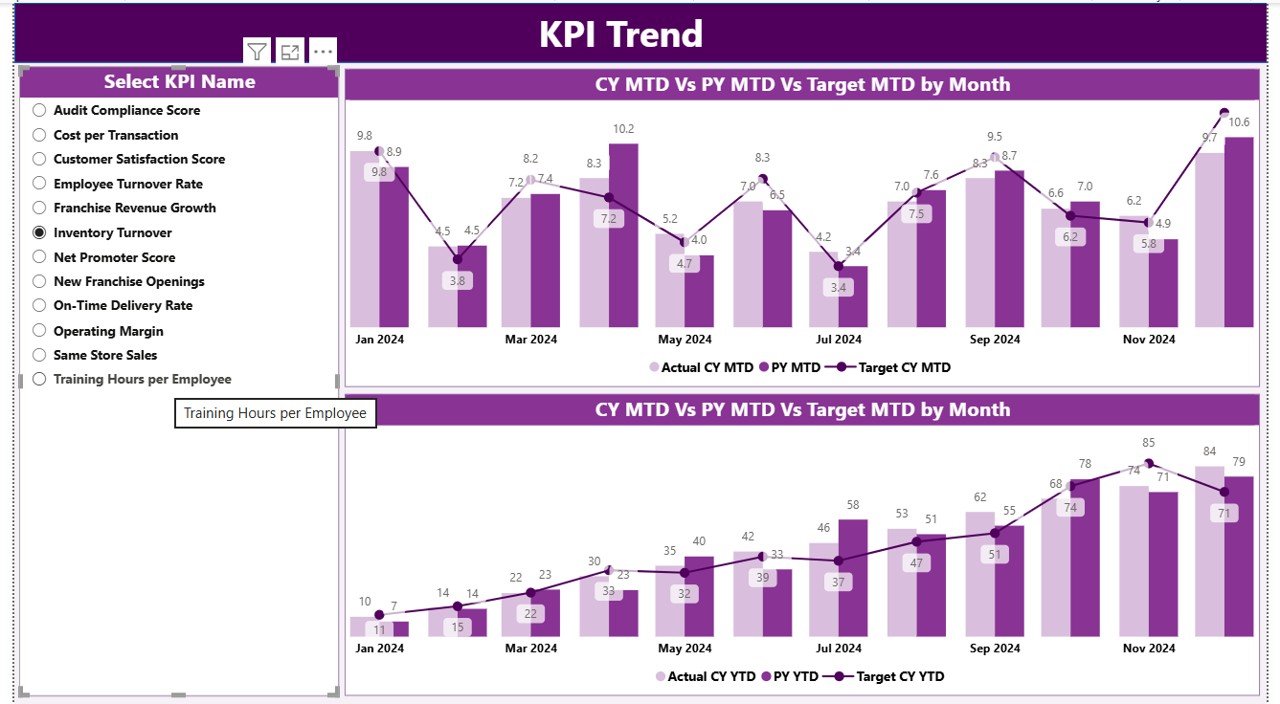
KPI Trend Page
The KPI Trend Page helps you analyze changes and progress visually.
- Displays combo charts comparing Actual (CY), Target (CY), and Previous Year (PY) values.
- Shows trends for both MTD and YTD metrics.
- Includes a slicer to select a specific KPI for deeper trend analysis.
By observing these trends, you can easily identify performance peaks, dips, and patterns — helping you plan interventions or set realistic future targets.
Click to buy Franchise Performance KPI Dashboard in Power BI
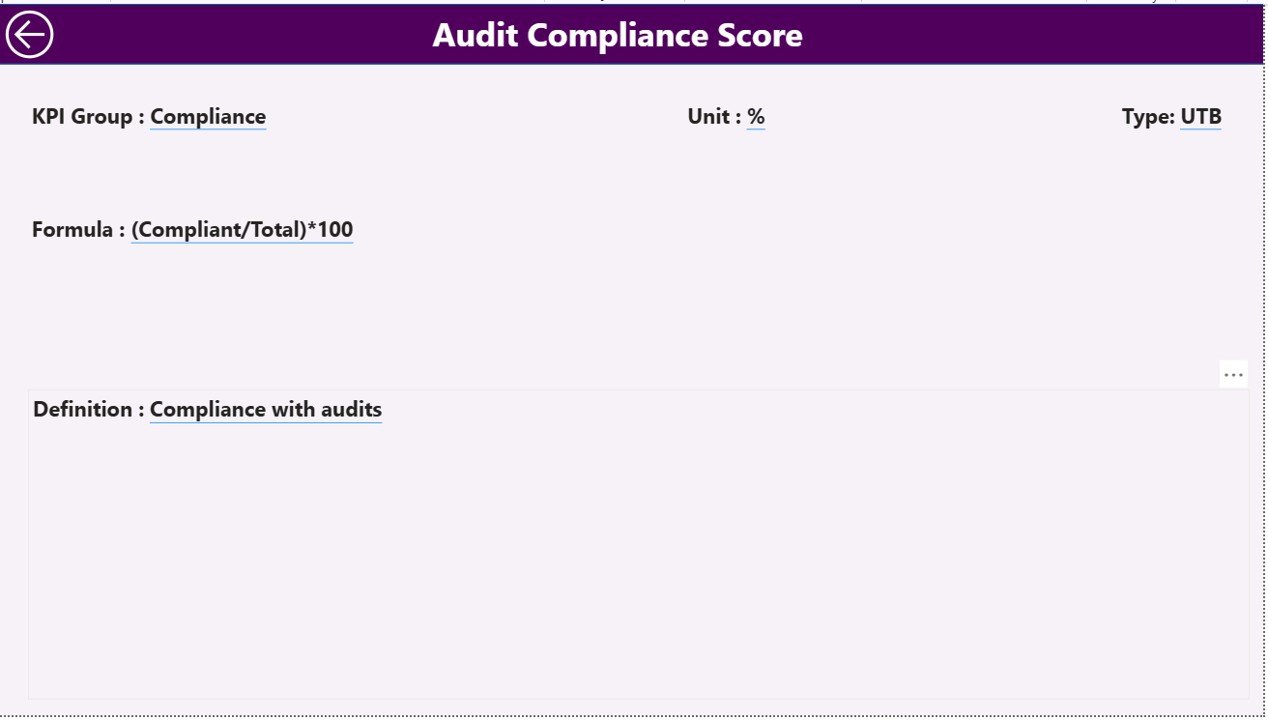
KPI Definition
This is a drill-through page, hidden by default but accessible from the Summary Page.
When you drill through any KPI, you can view:
- KPI Formula
- KPI Definition
- Measurement Unit and Type (LTB or UTB)
It ensures everyone understands exactly how each KPI is calculated — promoting consistency and transparency across all users.
A handy Back Button on the top left lets you return to the main page effortlessly.
Click to buy Franchise Performance KPI Dashboard in Power BI
Data Source: Excel Integration
The dashboard uses Excel as its data source. You only need to update three sheets, and Power BI automatically refreshes visuals:
Input_Actual Sheet
Enter:
- KPI Name
- Month (use the first date of each month)
- MTD and YTD actual values
Input_Target Sheet
Record:
- KPI Name
- Month (first date)
- MTD and YTD target values
KPI Definition Sheet
Fill in:
- KPI Number
- KPI Group
- KPI Name
- Unit
- Formula
- Definition
- Type (LTB or UTB)
Once these sheets are updated, Power BI syncs the data automatically to provide real-time insights.
How to Use the Franchise Performance KPI Dashboard
Using this dashboard is simple even for non-technical users:
- Open the Power BI file and connect it to your Excel data source.
- Select the Month and KPI Group using slicers.
- Review performance cards and tables on the Summary Page.
- Drill through KPIs to read formulas and definitions.
- Switch to KPI Trend Page to analyze monthly or yearly trends.
- Use insights to improve franchise performance and make informed decisions.
Advantages of Franchise Performance KPI Dashboard in Power BI
A well-structured dashboard brings numerous benefits to franchise owners, managers, and analysts.
1. Real-Time Visibility
Power BI updates data dynamically, letting you monitor progress instantly. No more waiting for manual reports.
2. Enhanced Decision-Making
With visual KPIs and comparisons, management can quickly spot problem areas and take corrective action.
3. Consistency Across Branches
Since all outlets use the same KPIs and definitions, performance measurement remains standardized across the entire network.
4. Improved Accountability
Visual icons (▲ ▼) and color codes make it easy to track which locations or KPIs are underperforming.
5. Time and Cost Savings
Automating data collection and reporting reduces manual work, ensuring faster analysis with fewer resources.
6. Data-Driven Culture
Teams develop a habit of reviewing KPIs regularly, leading to better alignment with organizational goals.
Best Practices for Using the Franchise Performance KPI Dashboard
To get maximum value from this dashboard, follow these best practices:
1. Maintain Clean and Consistent Data
Ensure your Excel sheets have accurate, formatted, and updated information. Avoid blank cells or inconsistent naming conventions.
2. Refresh Data Regularly
Schedule automatic refreshes in Power BI so that your dashboard always reflects current data.
3. Define Clear KPI Ownership
Assign responsibility for each KPI to a department or manager. It helps track accountability and progress.
4. Use Conditional Formatting Effectively
Visual cues like red/green arrows or icons instantly highlight performance status — making reports more intuitive.
5. Analyze Trends Before Making Decisions
Don’t rely solely on one month’s data. Study historical trends to understand performance cycles and seasonality.
6. Update KPI Definitions Periodically
As business priorities change, update your KPI definitions to align with new strategies.
7. Integrate with Other Data Sources
Expand your dashboard by connecting Power BI to CRM, ERP, or accounting systems for richer insights.
How This Dashboard Supports Business Growth
The Franchise Performance KPI Dashboard not only tracks performance but also helps businesses grow strategically.
- Identify Top-Performing Outlets: Recognize best performers and replicate their success.
- Spot Underperformers Early: Take corrective actions before issues escalate.
- Optimize Resource Allocation: Invest where returns are highest.
- Improve Customer Experience: Monitor satisfaction trends and improve service.
- Strengthen Franchise Relationships: Use transparent data to build trust with franchise partners.
By combining data accuracy with visual clarity, this dashboard transforms franchise management from reactive to proactive.
Step-by-Step Dashboard Implementation Guide
If you want to build or customize your own Franchise Performance Dashboard, follow these steps:
- Design KPI Framework: Finalize KPI definitions, formulas, and ownership.
- Prepare Excel Data: Create sheets for actuals, targets, and definitions.
- Connect Power BI to Excel: Import data into Power BI Desktop.
- Build Data Model: Define relationships between sheets (KPI Name or Number as the key).
- Create Visuals: Add cards, tables, combo charts, and slicers.
- Apply Conditional Formatting: Use colors and icons for performance indicators.
- Add Navigation Buttons: Make the dashboard interactive and user-friendly.
- Publish and Share: Publish the report to Power BI Service for secure sharing.
This approach ensures your dashboard is scalable and easy to maintain.
Conclusion
The Franchise Performance KPI Dashboard in Power BI is a powerful analytics solution that simplifies how franchises monitor, measure, and manage their performance.
By combining Excel’s flexibility with Power BI’s dynamic visualization, this dashboard offers a unified view of all your franchise KPIs — from sales and operations to customer satisfaction and finance.
It encourages data-driven decisions, improves transparency, and fosters continuous growth. Whether you manage ten franchises or a hundred, this dashboard becomes your single source of truth for performance monitoring.
Frequently Asked Questions (FAQs)
- What is the purpose of a Franchise Performance KPI Dashboard?
It helps monitor, compare, and improve franchise performance through data visualization and interactive analysis in Power BI.
- How often should the data be updated?
Ideally, update the Excel sheets monthly and set automatic refreshes in Power BI to keep the dashboard current.
- Can this dashboard be customized?
Yes, you can add or modify KPIs, change visuals, or integrate other data sources like SQL Server, CRM, or ERP systems.
- Is Power BI suitable for non-technical users?
Absolutely! Power BI provides drag-and-drop functionality and intuitive visuals that anyone can use without coding experience.
- Can I compare multiple franchise locations in this dashboard?
Yes. You can group KPIs by region, store, or franchisee to compare performance side by side.
- What are the prerequisites to use this dashboard?
You need Power BI Desktop (or Power BI Pro for cloud sharing) and an Excel file containing your KPI data.
- Does this dashboard support MTD and YTD analysis?
Yes. The dashboard includes both Month-to-Date and Year-to-Date views with visual indicators for each KPI.
- How can I share the dashboard with my team?
Publish the Power BI report to your organization’s Power BI Service and share access with specific users securely.
- What are the benefits of using Power BI over Excel dashboards?
Power BI offers better interactivity, scalability, and automation. It refreshes data instantly and handles large datasets efficiently.
- Can I use this dashboard for any industry?
Yes! Whether you run restaurants, gyms, retail stores, or educational franchises, the structure remains applicable with relevant KPIs.
Visit our YouTube channel to learn step-by-step video tutorials
Watch the step-by-step video tutorial:
Click to buy Franchise Performance KPI Dashboard in Power BI