Managing healthcare projects demands accuracy, transparency, and real-time control. However, traditional spreadsheets and manual tracking often create confusion, delays, and reporting gaps. Therefore, healthcare organizations now rely on data-driven dashboards to manage performance effectively.
That is where the Health Project Management KPI Dashboard in Power BI plays a vital role.
This powerful and ready-to-use dashboard helps healthcare organizations track project performance, measure KPIs, compare targets with actuals, and make data-backed decisions—all from a single interactive interface.
In this detailed guide, you will learn everything about the Health Project Management KPI Dashboard in Power BI, including its features, working structure, advantages, best practices, and frequently asked questions.
C lick to buy Health Project Management KPI Dashboard in Power BI
What Is a Health Project Management KPI Dashboard in Power BI?
A Health Project Management KPI Dashboard in Power BI is a visual analytics tool that helps healthcare organizations track project performance using key performance indicators (KPIs).
Instead of managing multiple Excel sheets, reports, and emails, this dashboard centralizes all project data into one structured and interactive view. As a result, project managers can easily monitor progress, compare targets, identify risks, and take timely actions.
Moreover, the dashboard connects directly with Excel, which makes data entry simple and flexible. You only need to update the Excel file, and Power BI automatically refreshes all visuals.
Why Do Healthcare Organizations Need a Project Management KPI Dashboard?
Healthcare projects involve complex workflows, multiple stakeholders, and strict timelines. Therefore, organizations need clear visibility into project health.
A Health Project Management KPI Dashboard helps because:
- It improves transparency across all projects
- It tracks performance in real time
- It highlights delays and risks early
- It supports data-driven decisions
- It reduces manual reporting efforts
- It improves accountability across teams
Most importantly, it ensures that healthcare projects stay aligned with strategic goals.
What Does the Health Project Management KPI Dashboard Contain?
This Power BI dashboard includes three powerful pages, each designed for a specific purpose. Let’s explore them in detail.
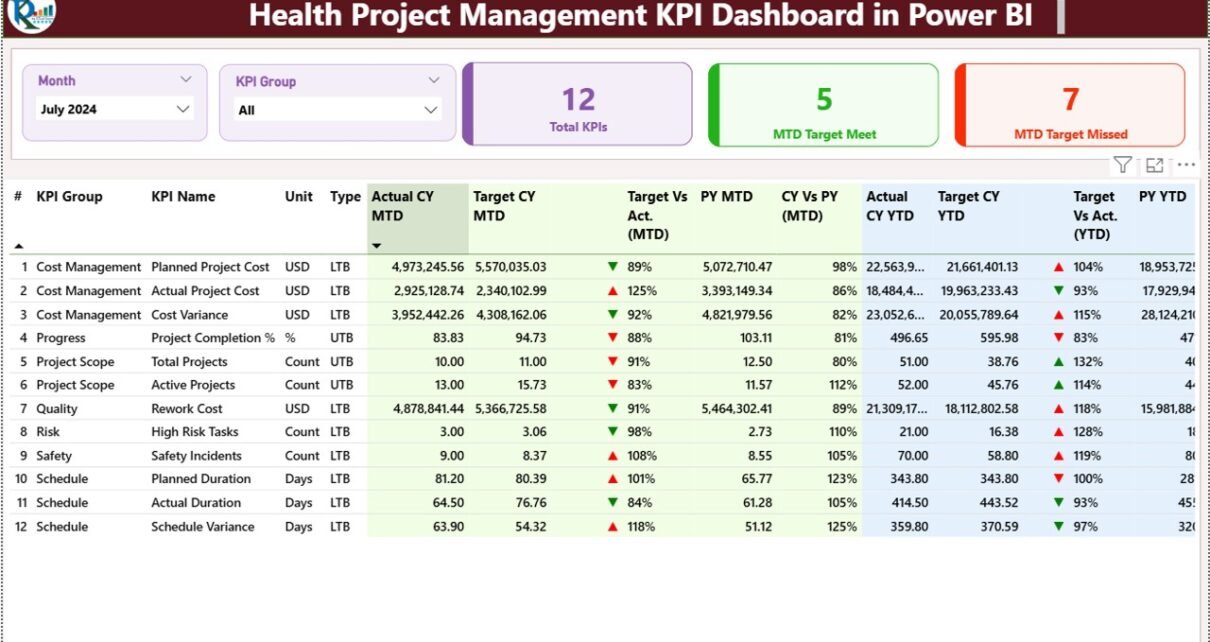
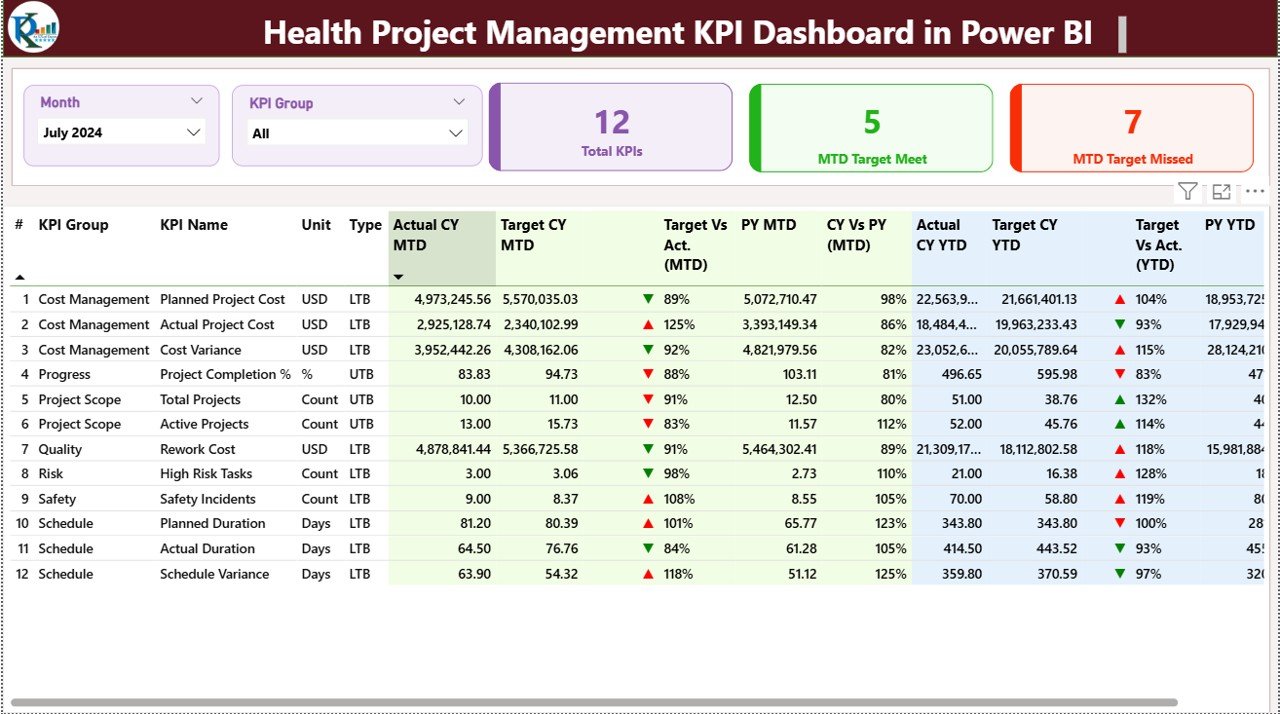
Summary Page – The Main Control Panel
The Summary Page serves as the heart of the dashboard. It provides a complete overview of all project KPIs in one place.
Filters and Slicers
At the top of the page, you will find:
- Month Slicer – Select a specific month
- KPI Group Slicer – Filter KPIs by category
These slicers allow quick and flexible analysis.
KPI Summary Cards
The dashboard displays three key cards:
- Total KPIs Count – Shows the total number of tracked KPIs
- MTD Target Met – Displays how many KPIs met the target
- MTD Target Missed – Shows KPIs that failed to meet targets
These cards provide instant performance visibility.
Detailed KPI Table
Below the cards, a detailed table shows in-depth KPI information.
KPI Fields Explained
- KPI Number – Unique identifier for each KPI
- KPI Group – Category or department of the KPI
- KPI Name – Name of the performance metric
- Unit – Measurement unit (%, Days, Count, etc.)
Type –
LTB (Lower the Better)
UTB (Upper the Better)
MTD Performance Metrics
- Actual CY MTD – Actual value for the current month
- Target CY MTD – Target value for the current month
- MTD Icon –
Green arrow → Target achieved
Red arrow → Target missed
- Target vs Actual (MTD) –
Formula:
Actual ÷ Target - PY MTD – Previous year’s month-to-date value
- CY vs PY (MTD) –
Formula:
Current Year MTD ÷ Previous Year MTD
YTD Performance Metrics
- Actual CY YTD – Current year cumulative performance
- Target CY YTD – Year-to-date target
- YTD Icon – Visual performance indicator
- Target vs Actual (YTD) –
Formula:
Actual ÷ Target - PY YTD – Previous year YTD value
- CY vs PY (YTD) –
Formula:
Current Year YTD ÷ Previous Year YTD
This structure ensures complete visibility of performance trends.
C lick to buy Health Project Management KPI Dashboard in Power BI
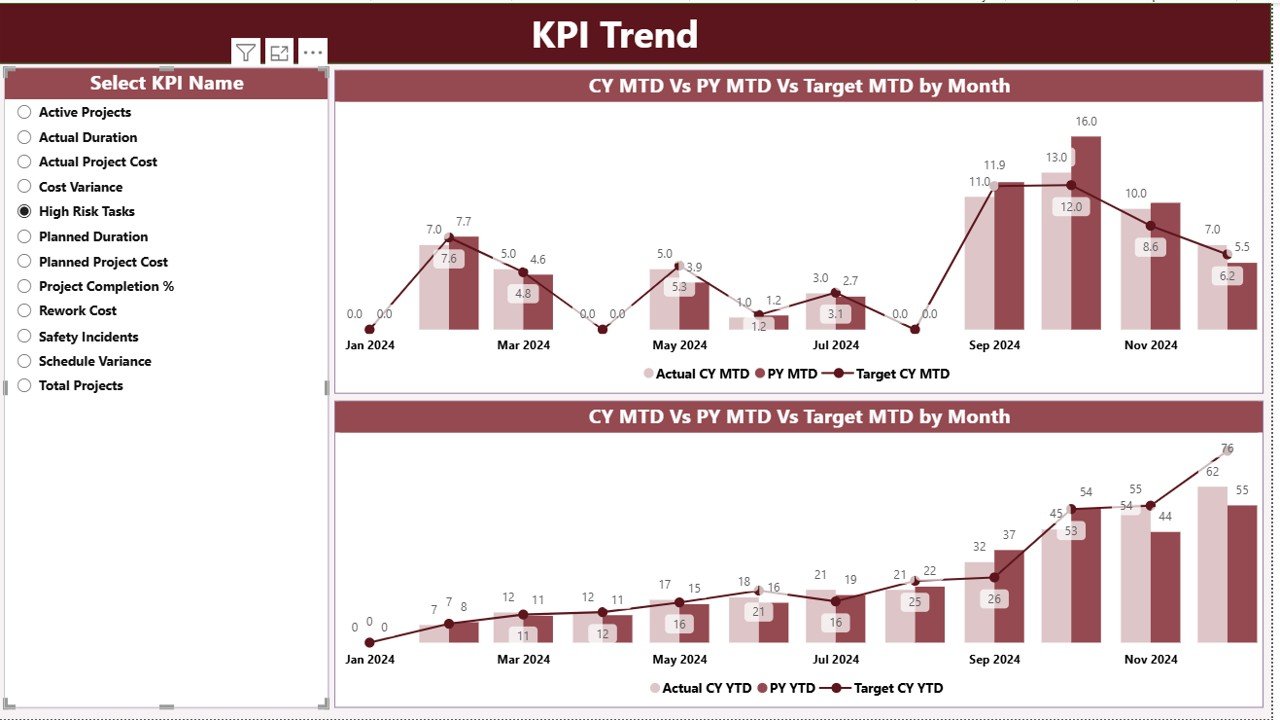
KPI Trend Page – Performance Over Time
The KPI Trend Page focuses on performance movement and trend analysis.
Key Features
Two interactive combo charts
Comparison between:
Current Year Actual
Previous Year Actual
Target Values
Separate visuals for:
MTD trends
YTD trends
KPI Selector
A slicer on the left allows users to select a specific KPI. Once selected, all charts update automatically.
This feature helps management analyze:
Performance improvement
- Seasonal trends
- Target achievement patterns
C lick to buy Health Project Management KPI Dashboard in Power BI
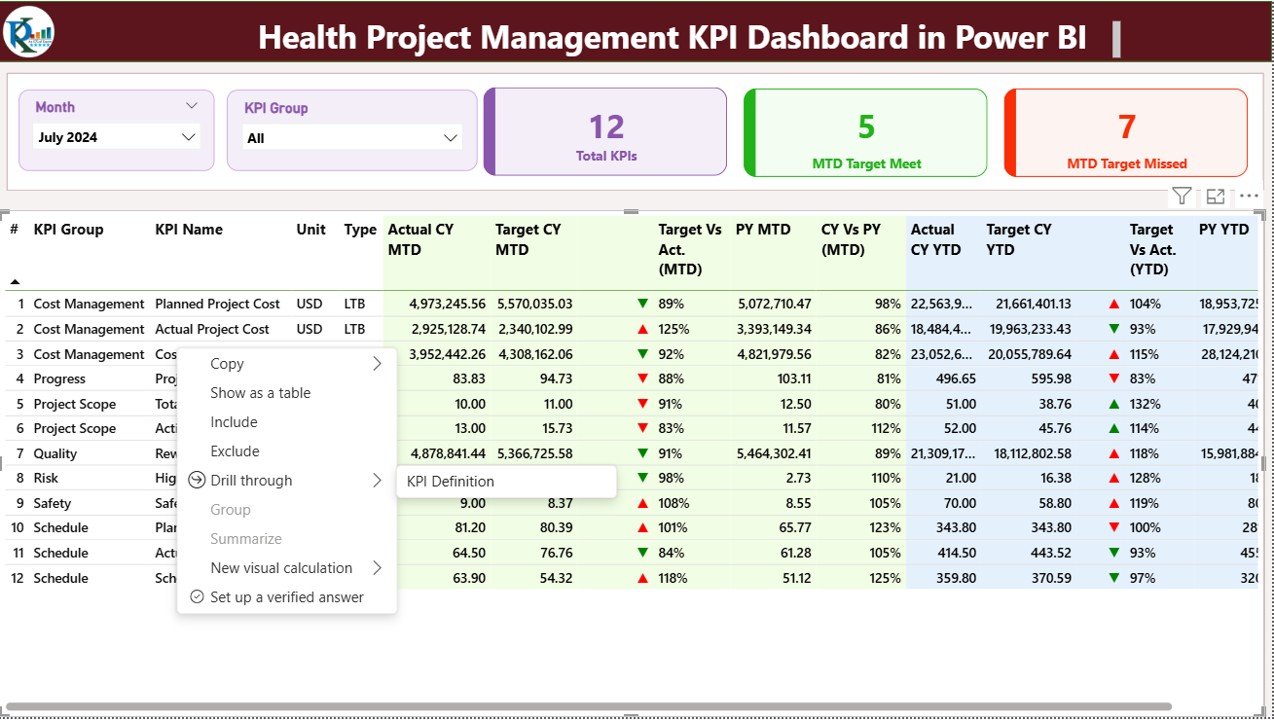
KPI Definition Page – Drill-Through Details
The KPI Definition Page acts as a reference guide.
What This Page Shows
- KPI Name
- KPI Group
- Formula
- Definition
- KPI Type (LTB or UTB)
Special Feature
This page remains hidden and opens only through drill-through from the Summary Page.
A Back Button at the top-left allows users to return easily.

C lick to buy Health Project Management KPI Dashboard in Power BI
Excel Data Structure Used in the Dashboard
The dashboard connects with an Excel file that contains three structured sheets.
Input_Actual Sheet
This sheet stores actual project performance values.
Fields include:
- KPI Name
- Month (First date of month)
- MTD Value
- YTD Value
Input_Target Sheet
This sheet stores target values.
Fields include:
- KPI Name
- Month
- Target MTD
- Target YTD
C lick to buy Health Project Management KPI Dashboard in Power BI
KPI Definition Sheet
This sheet defines KPI structure.
Fields include:
- KPI Number
- KPI Group
- KPI Name
- Unit
- Formula
- Definition
- KPI Type (LTB / UTB)
Why Use a Health Project Management KPI Dashboard?
Healthcare organizations face constant pressure to deliver projects on time and within budget. Therefore, they need a structured monitoring system.
Key Reasons to Use This Dashboard
- Improves project visibility
- Enhances accountability
- Reduces reporting time
- Improves decision-making
- Supports performance tracking
- Enables proactive risk management
Advantages of Health Project Management KPI Dashboard in Power BI
Real-Time Performance Monitoring
You can track project KPIs instantly and identify delays before they escalate.
Data-Driven Decisions
The dashboard helps leaders take actions based on facts, not assumptions.
Easy Excel Integration
Users only need to update Excel files. Power BI handles the rest.
Clear Visual Representation
Charts, icons, and color indicators simplify complex data.
Improved Accountability
Teams stay responsible because performance remains visible.
Time-Saving Reporting
No more manual reports or calculations.
Scalable for Any Healthcare Project
You can easily add more KPIs or projects.
How Does This Dashboard Improve Healthcare Project Performance?
This dashboard helps healthcare organizations:
- Track timelines effectively
- Control costs
- Monitor quality metrics
- Improve compliance
- Increase project success rates
- Enhance leadership visibility
As a result, organizations experience better control and faster decision-making.
Best Practices for Using the Health Project Management KPI Dashboard
1. Keep KPI Definitions Clear
Always define KPIs properly to avoid confusion.
2. Update Data Regularly
Update Excel sheets monthly or weekly for accurate insights.
3. Use Consistent Units
Maintain uniform measurement units across KPIs.
4. Monitor Trends, Not Just Numbers
Analyze trends to predict future performance.
5. Review KPIs with Stakeholders
Share dashboard insights during review meetings.
6. Avoid Too Many KPIs
Focus only on meaningful and actionable KPIs.
7. Use Drill-Through Features
Explore KPI definitions whenever required.
Who Can Use This Dashboard?
This dashboard suits:
- Healthcare Project Managers
- Hospital Administrators
- Healthcare Consultants
- PMO Teams
- Healthcare Analysts
- Operational Managers
- Strategy Teams
Conclusion
The Health Project Management KPI Dashboard in Power BI serves as a powerful solution for tracking, analyzing, and improving healthcare project performance.
It transforms raw Excel data into actionable insights. Moreover, it improves visibility, accountability, and decision-making across healthcare projects.
By using this dashboard, healthcare organizations can manage projects efficiently, meet targets consistently, and drive operational excellence.
Frequently Asked Questions (FAQs)
What is a Health Project Management KPI Dashboard?
It is a Power BI dashboard that tracks healthcare project performance using KPIs like MTD, YTD, targets, and trends.
Can I use Excel as a data source?
Yes. The dashboard uses Excel as its primary data source.
Does the dashboard support drill-through?
Yes. You can drill through from the summary page to the KPI definition page.
Can I customize KPIs?
Yes. You can easily add or modify KPIs using the Excel input sheets.
Is this dashboard suitable for hospitals?
Absolutely. Hospitals, clinics, and healthcare organizations can use it effectively.
Does it support year-over-year comparison?
Yes. The dashboard includes CY vs PY comparisons for both MTD and YTD.
Do I need Power BI expertise to use it?
No. Basic knowledge of Excel and Power BI is enough.
Visit our YouTube channel to learn step-by-step video tutorials
Watch the step-by-step video tutorial:
C lick to buy Health Project Management KPI Dashboard in Power BI