In the competitive world of insurance, it’s crucial for brokers to have clear visibility into their operations, track commissions, manage policies, and assess agent performance. The Insurance Brokers Dashboard in Excel is a ready-to-use solution that helps brokers monitor key metrics, visualize performance trends, and optimize their business strategies.
What is the Insurance Brokers Dashboard in Excel?
The Insurance Brokers Dashboard in Excel is a comprehensive tool designed to help insurance brokers manage their policies, premiums, commissions, and agents effectively. This dashboard consolidates essential data into one place, allowing brokers to track performance across various KPIs, such as the number of active policies, premium collections, commission payments, and policy statuses. The dashboard is fully customizable and includes charts, slicers, and cards to provide a visually appealing and user-friendly interface.
Key Features of the Insurance Brokers Dashboard
The Insurance Brokers Dashboard consists of multiple sheets, each focusing on different aspects of insurance brokerage operations. Below are the key features of each sheet:
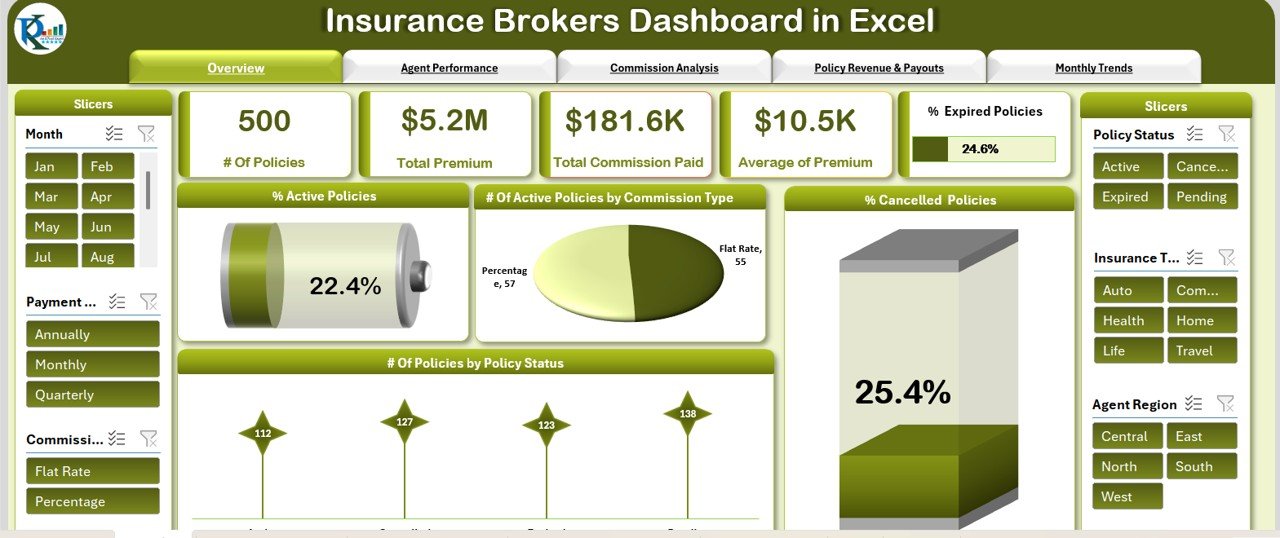
1. Overview Sheet Tab
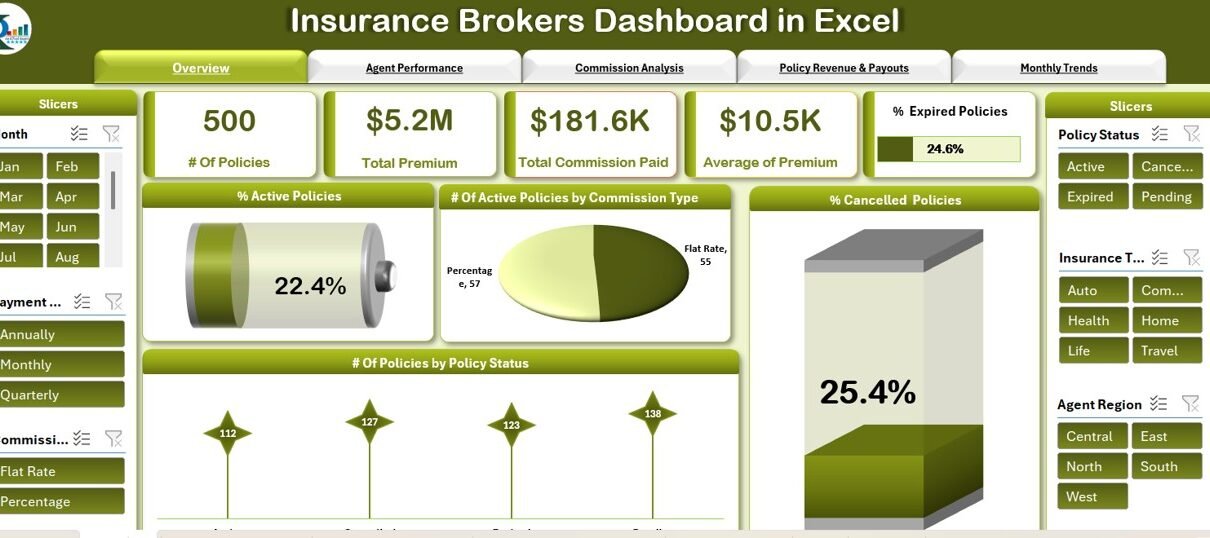
The Overview sheet serves as the main interface where brokers can quickly get a snapshot of key metrics and trends. This sheet includes:
Cards:
- # of Policies: Displays the total number of policies being managed.
- Total Premium Collected ($): Tracks the total premium collected from clients.
- Total Commission Paid ($): Displays the total commission paid to agents.
- Average Premium Amount ($): Shows the average premium amount across all policies.
- % of Expired Policies: Tracks the percentage of policies that have expired.
Charts:
- % Active Policies: Shows the percentage of policies that are still active.
- # of Active Policies by Commission Type: Displays the number of active policies segmented by commission type.
- % of Cancelled Policies: Shows the percentage of policies that have been cancelled.
- # of Policies by Policy Status: Displays the total number of policies segmented by their status (active, expired, cancelled).
Click to buy Insurance Brokers Dashboard in Excel
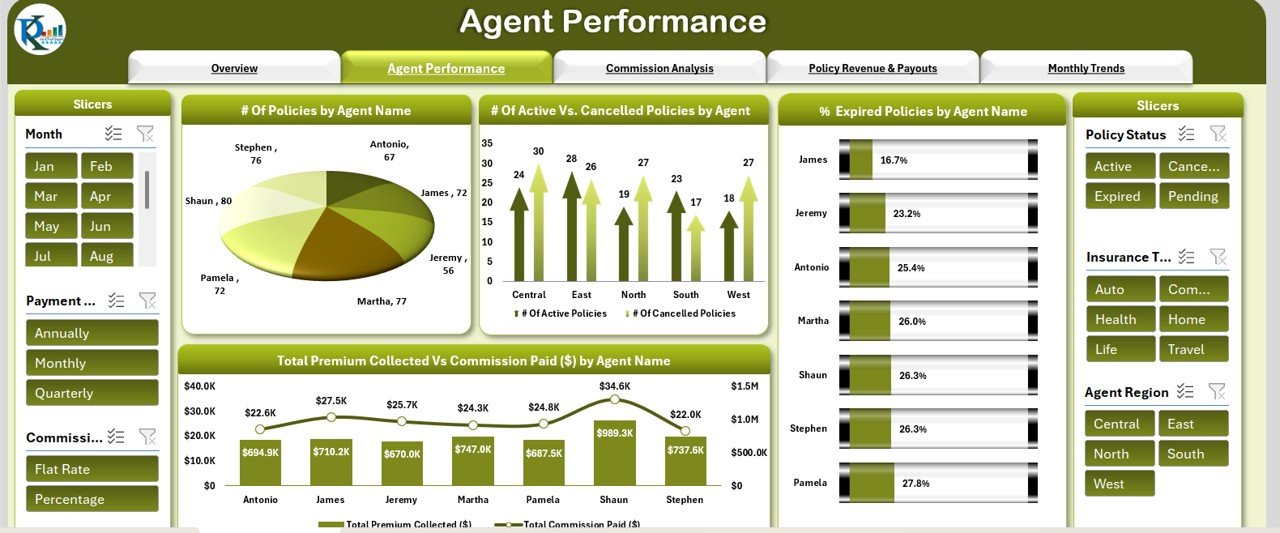
2. Agent Performance Sheet Tab
The Agent Performance sheet focuses on tracking the performance of individual agents. It includes:
Charts:
- # of Policies by Agent Name: Displays the total number of policies assigned to each agent.
- # of Active vs. Cancelled Policies by Agent Region: Tracks active and cancelled policies by region for each agent.
- % of Expired Policies by Agent Name: Shows the percentage of expired policies managed by each agent.
- Total Premium Collected vs. Commission Paid ($) by Agent Name: Compares the total premium collected and the commission paid for each agent.
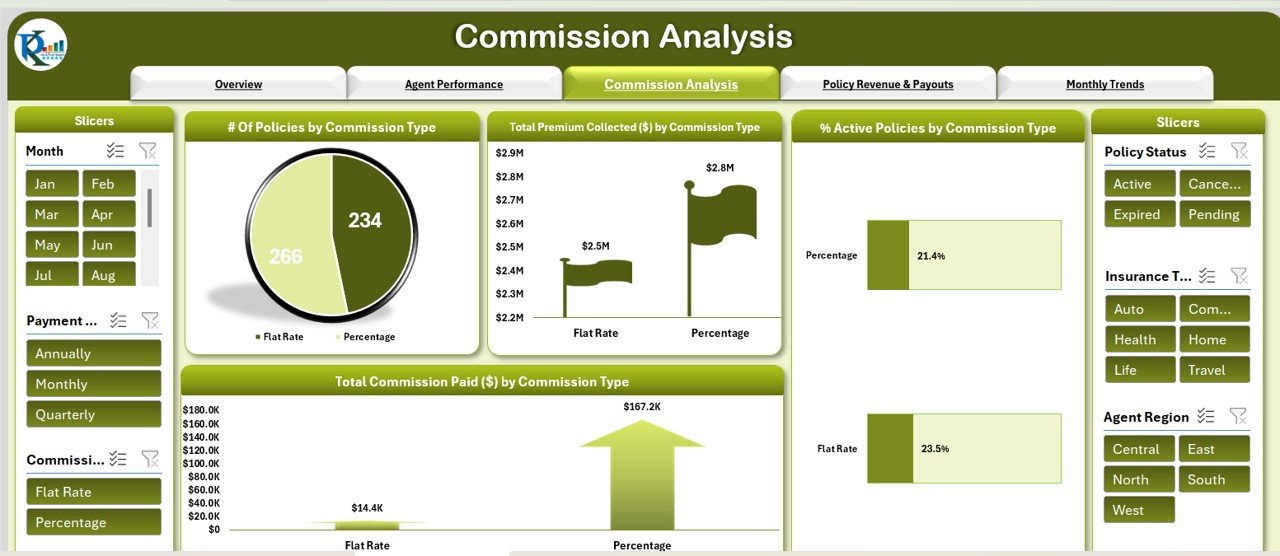
3. Commission Analysis Sheet Tab
The Commission Analysis sheet focuses on commission-related metrics. It includes:
Charts:
- # of Policies by Commission Type: Displays the number of policies segmented by the type of commission.
- Total Premium Collected ($) by Commission Type: Tracks premium collections for each commission type.
- % Active Policies by Commission Type: Shows the percentage of active policies per commission type.
- Total Commission Paid ($) by Commission Type: Displays the total commission paid for each commission type.
Click to buy Insurance Brokers Dashboard in Excel
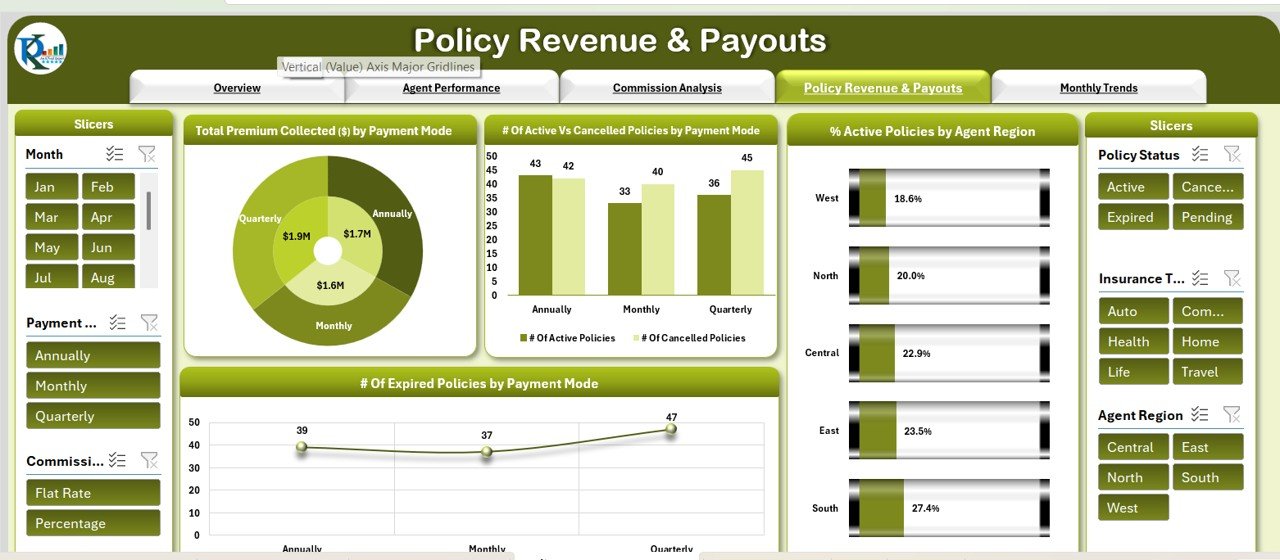
4. Policy Revenue & Payouts Sheet Tab
The Policy Revenue & Payouts sheet tracks revenue and payouts for policies. It includes:
Charts:
- Total Premium Collected ($) by Payment Mode: Displays the total premium collected, segmented by payment mode (e.g., online, bank transfer).
- # of Active vs. Cancelled Policies by Payment Mode: Compares active and cancelled policies based on payment mode.
- % Active Policies by Agent Region: Shows the percentage of active policies by agent region.
- # of Expired Policies by Payment Mode: Displays the number of expired policies segmented by payment mode.
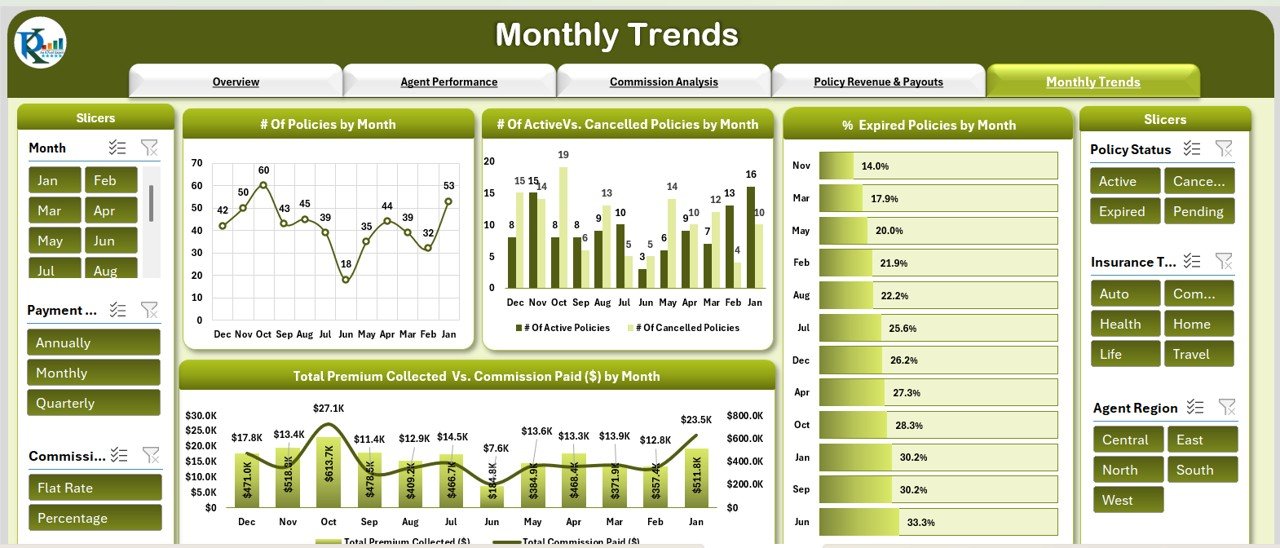
5. Monthly Trends Sheet Tab
The Monthly Trends sheet tracks performance trends over time. It includes:
Charts:
- # of Policies by Month: Displays the number of policies managed by month.
- # of Active vs. Cancelled Policies by Month: Compares the number of active versus cancelled policies over each month.
- % Expired Policies by Month: Tracks the percentage of expired policies by month.
- Total Premium Collected vs. Commission Paid ($) by Month: Compares total premium collected with commission paid each month.
Click to buy Insurance Brokers Dashboard in Excel
6. Data Sheet Tab
The Data Sheet is where all input data is entered, including policy details, premium amounts, agent information, and payment statuses. This sheet feeds all the charts and calculations used in the other sheets. It includes the following columns:
Benefits of Using the Insurance Brokers Dashboard
- Real-Time Insights: The dashboard offers real-time updates on key metrics like premiums, policies, and commissions, allowing brokers to make informed decisions.
- Agent and Vendor Performance Monitoring: Track the performance of individual agents and vendors, ensuring accountability and identifying top performers.
- Payment Tracking: Monitor payment completion and overdue policies to ensure timely payments and reduce overdue claims.
- Customizable: The dashboard is fully customizable, allowing brokers to add new KPIs, charts, and fields based on their specific needs.
- Comprehensive Analysis: The dashboard consolidates various metrics into one place, making it easy to assess policy performance, agent effectiveness, and financial outcomes.
Best Practices for Using the Insurance Brokers Dashboard
Click to buy Insurance Brokers Dashboard in Excel
- Update Data Regularly: Ensure that data in the Data Sheet is updated regularly to reflect accurate performance metrics.
- Monitor Key KPIs: Regularly review KPIs such as % Active Policies, Total Premium Collected, and Agent Performance to identify trends and optimize operations.
- Set Clear Targets: Use the dashboard to set clear performance targets for agents, departments, and overall policy management.
- Review Monthly Trends: Use the Monthly Trends page to identify seasonal trends and adjust marketing and sales strategies accordingly.
- Optimize Commission Structure: Use the Commission Analysis to evaluate how different commission types impact overall performance and profitability.
Conclusion
The Insurance Brokers Dashboard in Excel is a comprehensive tool for insurance brokers to monitor their performance, track key metrics, and optimize operations. With features like agent performance tracking, commission analysis, and policy management, the dashboard provides valuable insights that can help brokers make informed, data-driven decisions. Whether you’re managing policies for a single agent or overseeing a large team, this dashboard can help streamline operations and improve performance.
Frequently Asked Questions (FAQs)
Click to buy Insurance Brokers Dashboard in Excel
1. How do I enter data into the Insurance Brokers Dashboard?
Data is entered into the Data Sheet, including details about policies, premiums, agent information, and payment statuses.
2. Can I customize the Insurance Brokers Dashboard?
Yes, the dashboard is fully customizable. You can adjust the layout, add new fields, or modify charts to fit your specific needs.
3. How does the Agent Performance sheet help?
The Agent Performance sheet allows you to track each agent’s performance, including the number of policies managed, premiums collected, and payment statuses.
4. What is the Commission Analysis used for?
The Commission Analysis page helps you track commission payments by commission type, allowing you to evaluate and optimize your commission structure.
5. How can I track overdue policies using this dashboard?
The dashboard tracks % Expired Policies and Overdue Payment %, helping you monitor overdue policies and take necessary actions.
Visit our YouTube channel to learn step-by-step video tutorials
Click to buy Insurance Brokers Dashboard in Excel