Managing IT services effectively requires tracking key metrics such as service requests, resolution times, SLA compliance, and customer satisfaction. The IT Services Dashboard in Power BI is a powerful, ready-to-use tool designed to help IT service teams monitor and analyze these critical metrics. By consolidating data into one accessible dashboard, businesses can optimize their IT service management processes, improve performance, and deliver exceptional service to their customers.
In this article, we’ll walk you through the key features of the IT Services Dashboard in Power BI, explaining how it helps IT teams track performance, monitor SLA compliance, and improve customer satisfaction.
What is the IT Services Dashboard in Power BI?
The IT Services Dashboard in Power BI is a comprehensive tool that allows IT teams to visualize, analyze, and track their service performance in real time. It helps monitor key performance indicators (KPIs) like response and resolution times, SLA breaches, and customer satisfaction, while providing visual insights into the performance of individual technicians and departments. The dashboard is divided into multiple pages, each offering in-depth analysis of specific areas of IT service management.
The dashboard includes the following key pages:
Key Features of the IT Services Dashboard
Click to buy IT Services Dashboard in Power BI
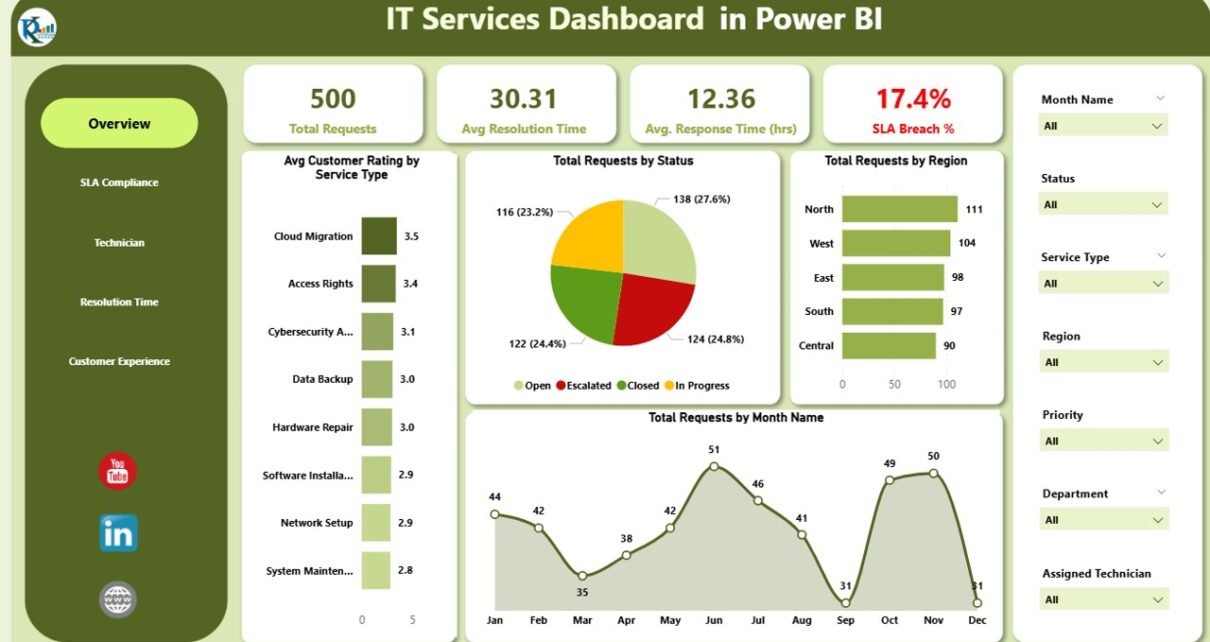
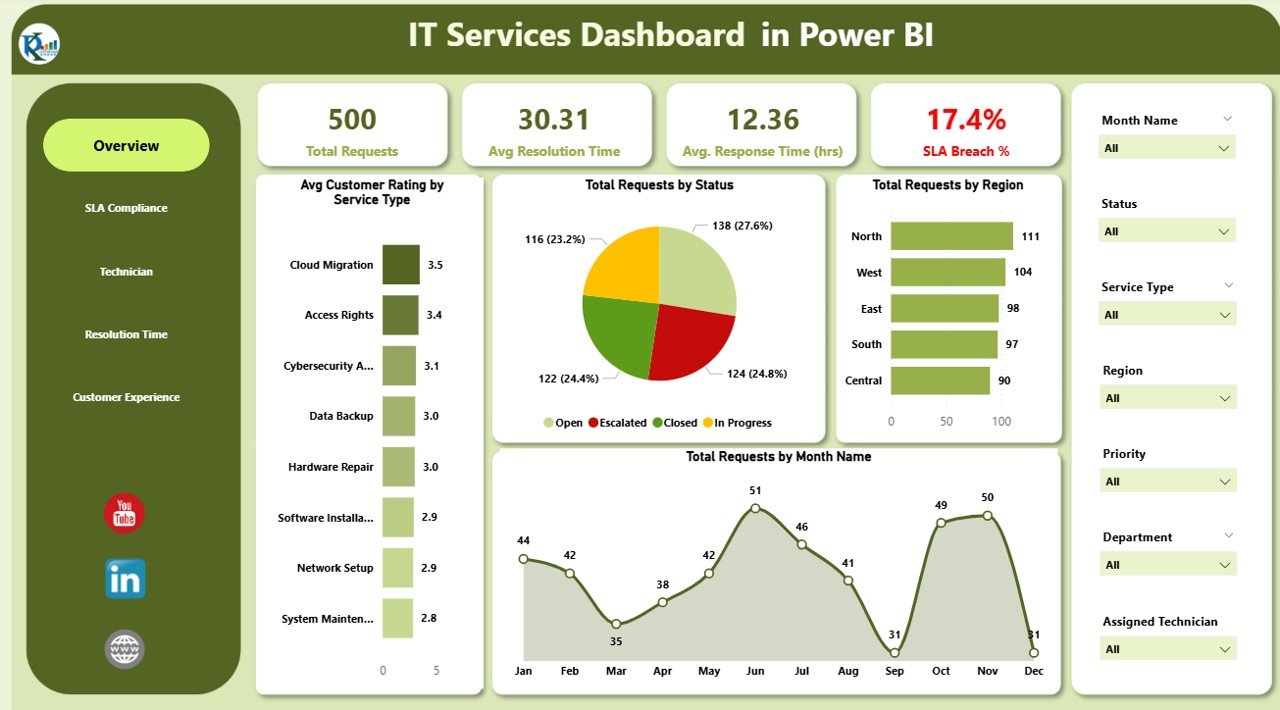
1) Overview Sheet Tab: High-Level Performance Metrics
The Overview Sheet is the central hub for key metrics and overall performance. It provides a summary of essential IT service data through various cards and charts:
Cards:
- Total Requests: Displays the total number of service requests submitted.
- Avg. Resolution Time (hrs): Shows the average time it took to resolve the service requests.
- Avg. Response Time (hrs): Displays the average response time for service requests.
- SLA Breach %: Shows the percentage of service requests that breached the Service Level Agreement (SLA).
Charts:
- Total Requests by Status: Visualizes the breakdown of requests by status (e.g., open, in progress, closed).
- Total Requests by Region: Displays the number of requests by region (e.g., North, South, East, West).
- Total Requests by Month: A chart that shows the distribution of service requests by month.
- Avg. Customer Rating by Assigned Technician: Displays the average customer satisfaction rating for each technician.
- Total Requests by Request Month: Shows the number of requests by month, allowing you to track trends over time.
These metrics provide a quick, high-level view of your IT service performance, helping you monitor key KPIs at a glance.
Click to buy IT Services Dashboard in Power BI
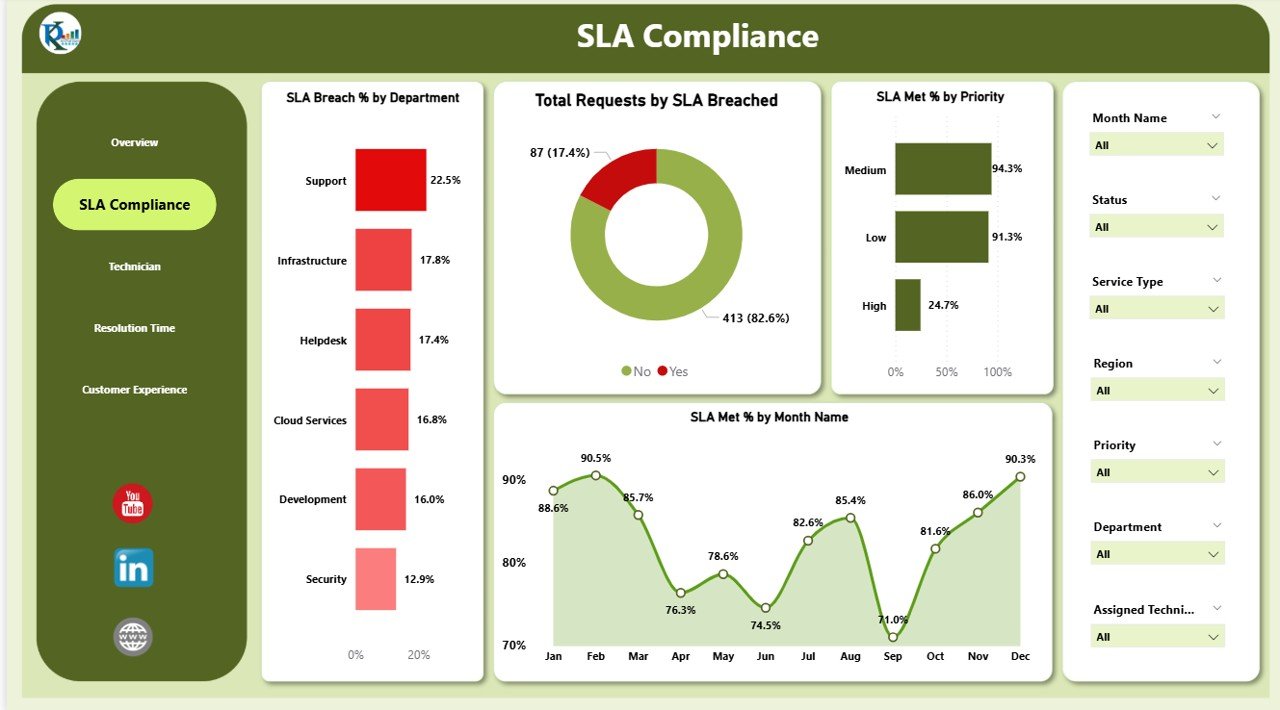
2) SLA Compliance Page: Monitor SLA Performance
The SLA Compliance Page focuses on tracking and managing SLA performance. It includes charts that give a detailed analysis of SLA compliance:
-
SLA Breach % by Department: Displays the SLA breach percentage for each department.
-
Total Requests by SLA Breached: Tracks the number of requests that have breached the SLA.
-
SLA Met % by Priority: Shows the percentage of requests that met the SLA, broken down by priority (e.g., high, medium, low).
-
SLA Met % by Month Name: Displays SLA compliance trends over time, broken down by month.
This page helps you ensure that service requests are handled within the expected timeframe, reducing the number of SLA breaches and improving service delivery.
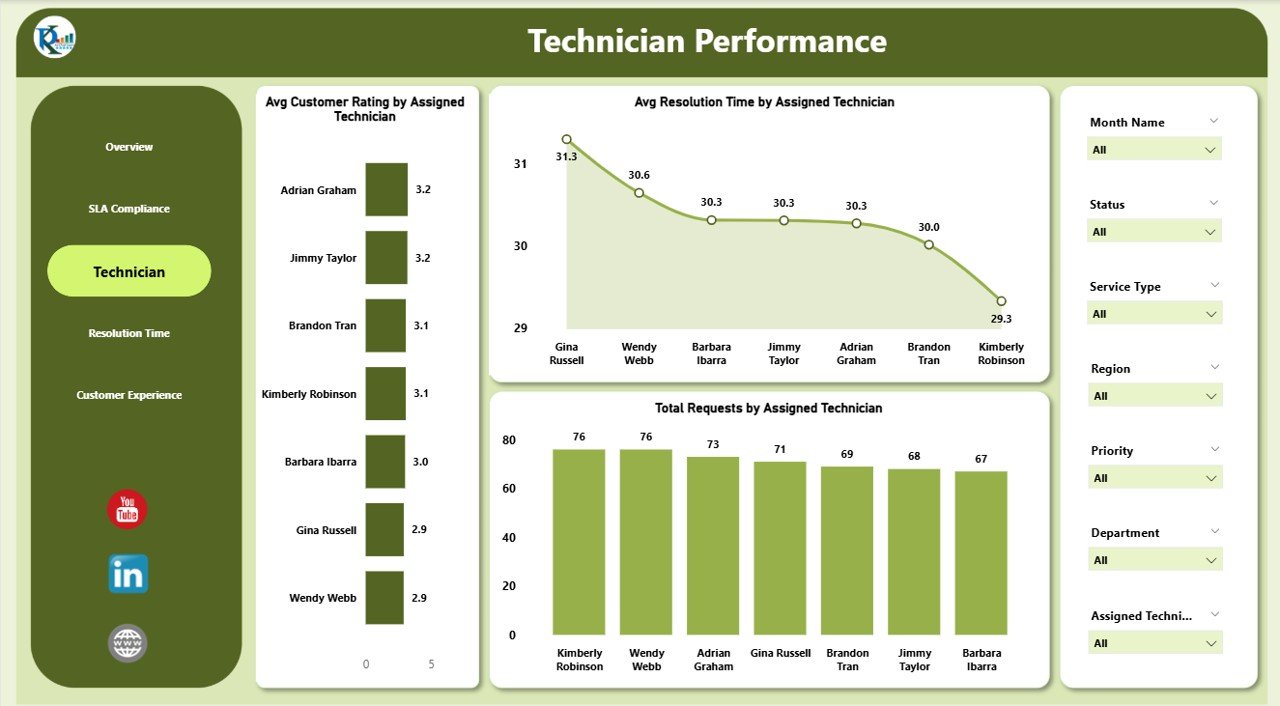
3) Technician Performance Page: Evaluate Technician Efficiency
The Technician Performance Page provides insights into the performance of individual technicians. Key charts include:
-
Avg. Customer Rating by Assigned Technician: Shows the average customer satisfaction rating for each technician.
-
Avg. Resolution Time by Assigned Technician: Tracks the average resolution time for each technician, helping you identify areas where performance can be improved.
-
Total Requests by Assigned Technician: Displays the total number of requests handled by each technician.
By evaluating technician performance, you can identify top performers and areas for improvement, ensuring that your team delivers quality service to customers.
Click to buy IT Services Dashboard in Power BI
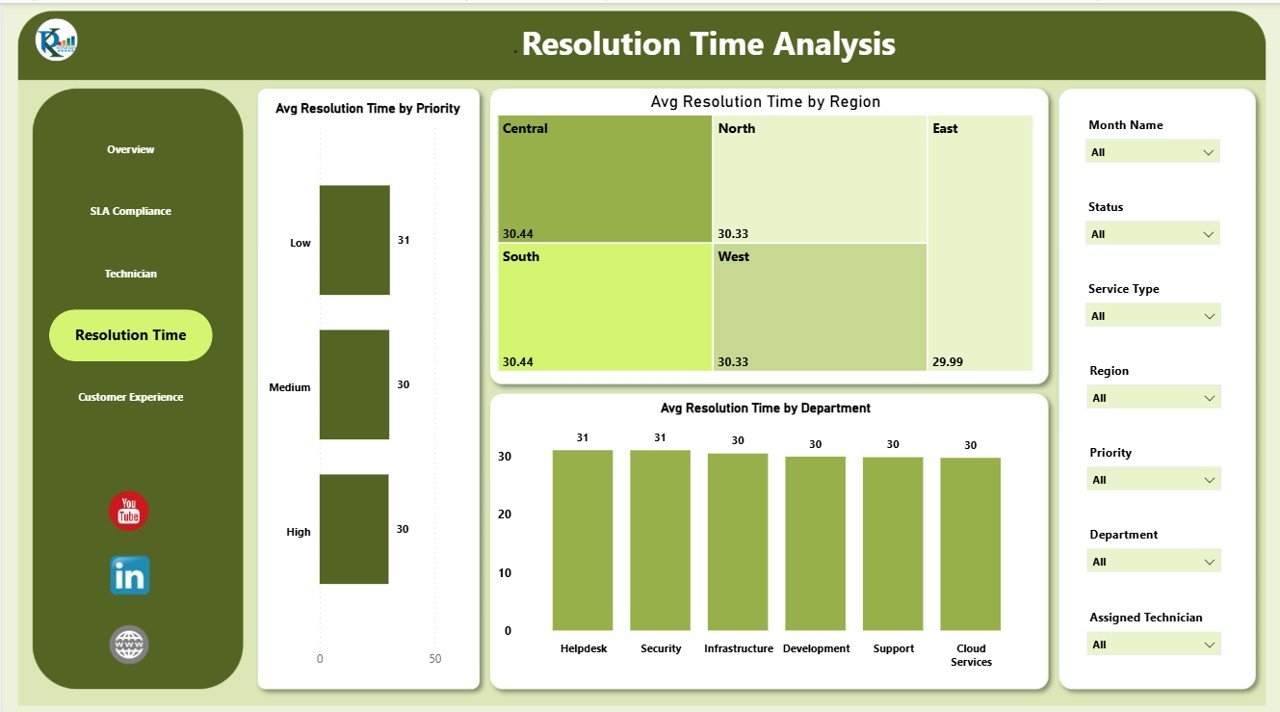
4) Resolution Time Analysis Page: Analyze Resolution Efficiency
The Resolution Time Analysis Page focuses on the efficiency of your team in resolving service requests. Key charts include:
-
Avg. Resolution Time by Priority: Displays the average resolution time for service requests based on their priority (e.g., high, medium, low).
-
Avg. Resolution Time by Region: Tracks the average resolution time for each region, helping you identify any regional discrepancies in service delivery.
-
Avg. Resolution Time by Department: Shows the average resolution time for each department, helping you assess departmental performance.
This page provides a detailed breakdown of resolution efficiency, allowing you to identify bottlenecks and improve service times.
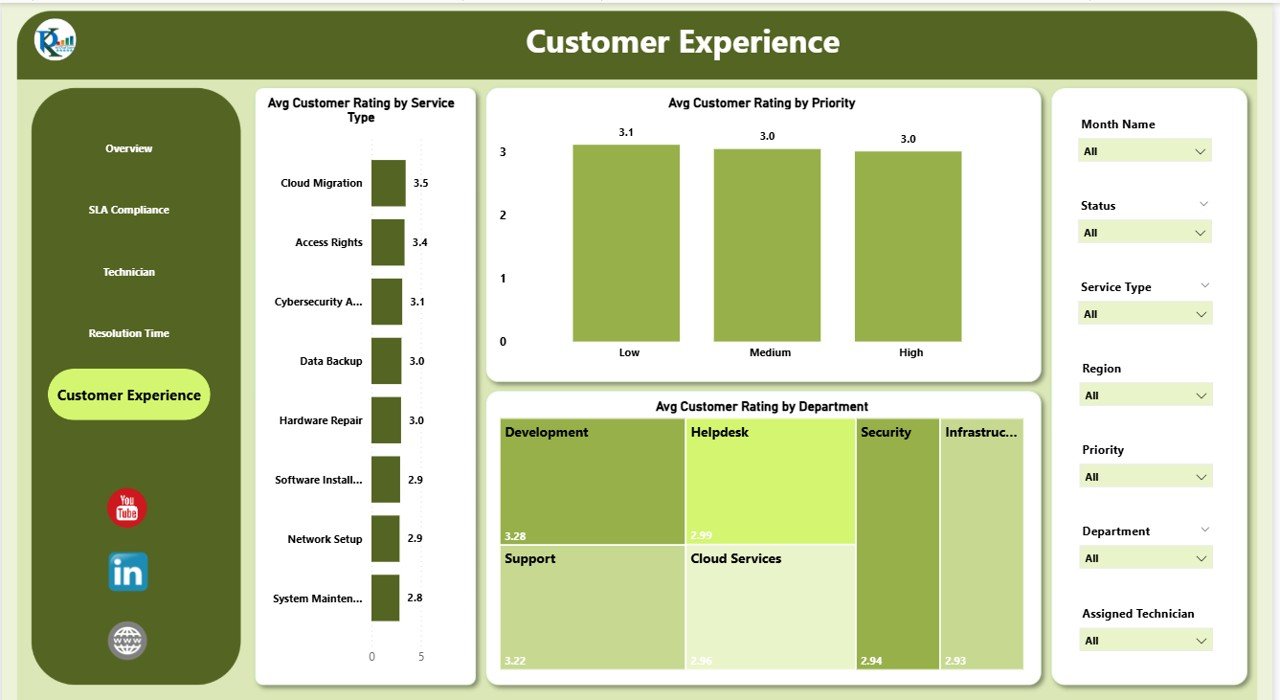
5) Customer Experience Page: Track Customer Satisfaction
The Customer Experience Page focuses on tracking customer satisfaction with the IT service provided. Key charts include:
-
Avg. Customer Rating by Service Type: Displays the average customer satisfaction rating for each service type (e.g., network setup, software installation).
-
Avg. Customer Rating by Priority: Shows the average customer satisfaction rating based on the priority of the request.
-
Avg. Customer Rating by Department: Tracks customer satisfaction ratings for each department, helping you understand which teams are performing well and which may need further training or resources.
By tracking customer satisfaction across different dimensions, this page helps you identify opportunities for improving service quality and customer experience.
Benefits of Using the IT Services Dashboard
The IT Services Dashboard in Power BI offers several advantages for IT service teams:
-
Centralized Data Tracking: The dashboard consolidates all critical service data into one platform, making it easier to monitor performance, trends, and key metrics.
-
Real-Time Insights: The dashboard provides real-time updates, ensuring that you have access to the most current data for decision-making.
-
Improved SLA Management: By tracking SLA compliance, you can take proactive steps to meet customer expectations and reduce SLA breaches.
-
Enhanced Performance Monitoring: The detailed insights into technician performance, resolution times, and customer satisfaction help you optimize your team’s effectiveness.
-
Customizable: The dashboard is fully customizable, allowing you to add new charts, KPIs, or modify the layout to meet your specific IT service management needs.
Best Practices for Using the IT Services Dashboard
Click to buy IT Services Dashboard in Power BI
To maximize the effectiveness of the IT Services Dashboard in Power BI, follow these best practices:
- Update Data Regularly: Ensure that the data is updated frequently to reflect the most current service requests, resolution times, and customer feedback.
- Focus on SLA Compliance: Monitor SLA compliance closely and take action when SLA breaches occur to avoid impacting customer satisfaction.
- Track Technician Performance: Regularly evaluate technician performance using the Technician Performance Page and offer training or support where necessary.
- Analyze Resolution Efficiency: Use the Resolution Time Analysis Page to identify areas where the resolution process can be optimized for faster response times.
- Engage with Customers: Use the Customer Experience Page to identify areas for improvement in customer satisfaction and ensure that your IT services meet or exceed customer expectations.
Conclusion
The IT Services Dashboard in Power BI is an essential tool for IT service teams looking to monitor and optimize their service management processes. By tracking key performance metrics such as service requests, resolution times, SLA compliance, and customer satisfaction, this dashboard provides valuable insights that help improve service delivery, boost efficiency, and enhance the customer experience.
With its customizable features and real-time insights, the IT Services Dashboard empowers IT service managers and teams to make data-driven decisions and continuously improve their service offerings.
Frequently Asked Questions (FAQs)
Click to buy IT Services Dashboard in Power BI
1. How often should I update the IT Services Dashboard?
It is recommended to update the dashboard regularly, ideally on a daily or weekly basis, to ensure that it reflects the most current service request data.
2. Can I track multiple departments with this dashboard?
Yes, the dashboard allows you to track performance across multiple departments, with charts that break down metrics by department.
3. How does the SLA Compliance page help manage service levels?
The SLA Compliance page tracks SLA breaches and compliance trends, helping you monitor whether service requests are being handled within the agreed-upon timeframes.
4. Can I share the dashboard with my team?
Yes, the IT Services Dashboard in Power BI can be shared with your team, enabling real-time collaboration and data updates.
5. Can I customize the dashboard for my specific IT service needs?
Yes, the dashboard is fully customizable. You can modify charts, KPIs, and data columns to suit your unique IT service management requirements.
Visit our YouTube channel to learn step-by-step video tutorials
Youtube.com/@NeotechNavigators
Watch the step-by-step video Demo:
Click to buy IT Services Dashboard in Power BI