Effective knowledge sharing within an organization is critical for fostering innovation, improving collaboration, and enhancing productivity. A Knowledge Sharing KPI Dashboard in Excel helps track the key metrics associated with knowledge sharing, providing valuable insights into how well information is being shared across teams. This dashboard offers an easy way to monitor the progress of knowledge-sharing activities, set goals, and make data-driven decisions.
In this article, we’ll explore the features of the Knowledge Sharing KPI Dashboard in Excel, explain how it works, and list the KPIs included in the template.
Introduction to Knowledge Sharing KPI Dashboard
The Knowledge Sharing KPI Dashboard in Excel is a tool designed to measure and track the effectiveness of knowledge sharing within an organization. By using this dashboard, HR teams, managers, and leadership can monitor how well knowledge is being disseminated across teams, ensuring that information is effectively communicated and utilized.
This dashboard is highly customizable, featuring multiple worksheets that allow for detailed tracking of key metrics. By analyzing KPIs, organizations can identify areas for improvement, streamline processes, and create strategies to enhance knowledge sharing across all levels.
Key Features of the Knowledge Sharing KPI Dashboard in Excel
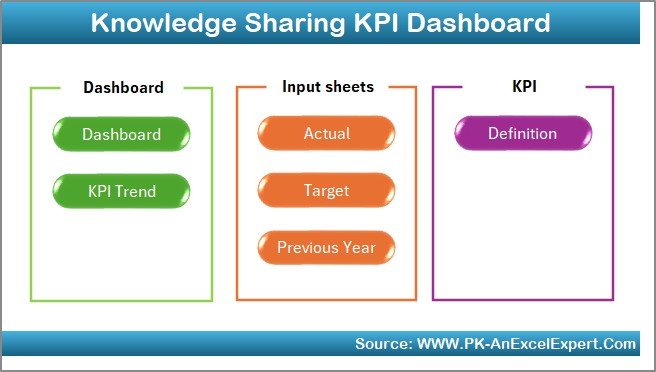
The Knowledge Sharing KPI Dashboard in Excel is built with 7 essential worksheets that help users track, analyze, and manage knowledge sharing activities.
1. Home Sheet Tab
The Home Sheet acts as the navigation hub of the dashboard. Here, users can easily jump to any other tab within the workbook, improving the user experience.
Key Features:
- Quick access buttons to navigate to different tabs, such as the Dashboard Sheet, KPI Trend Sheet, Actual Number Sheet, and others.
Click to buy Knowledge Sharing KPI Dashboard in Excel
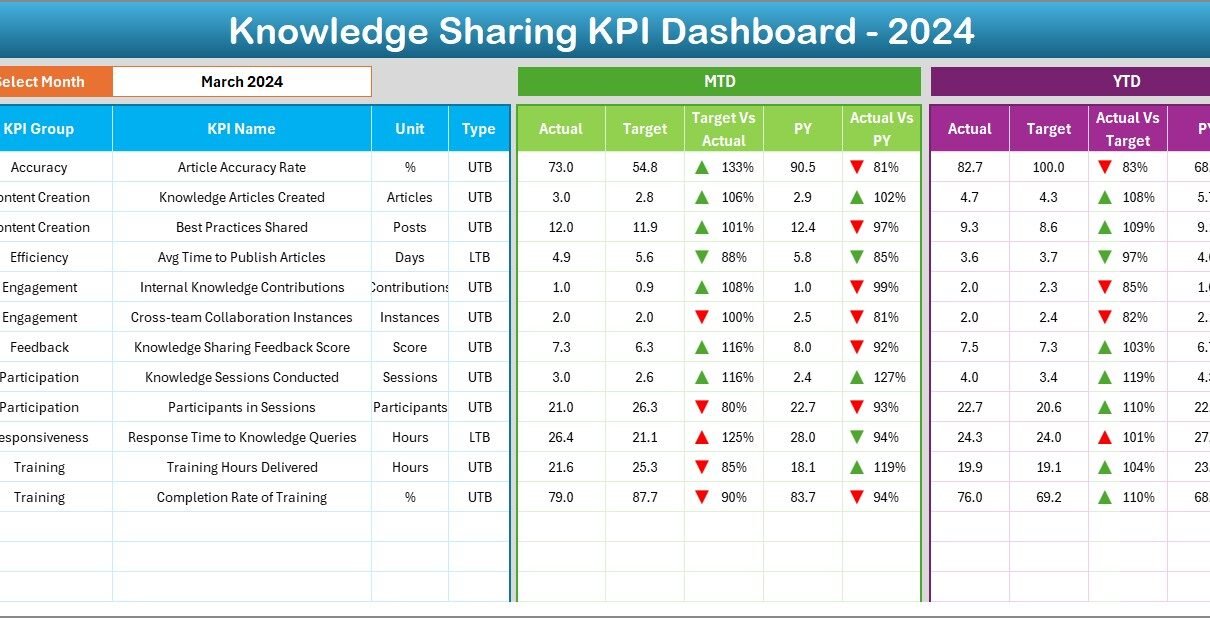
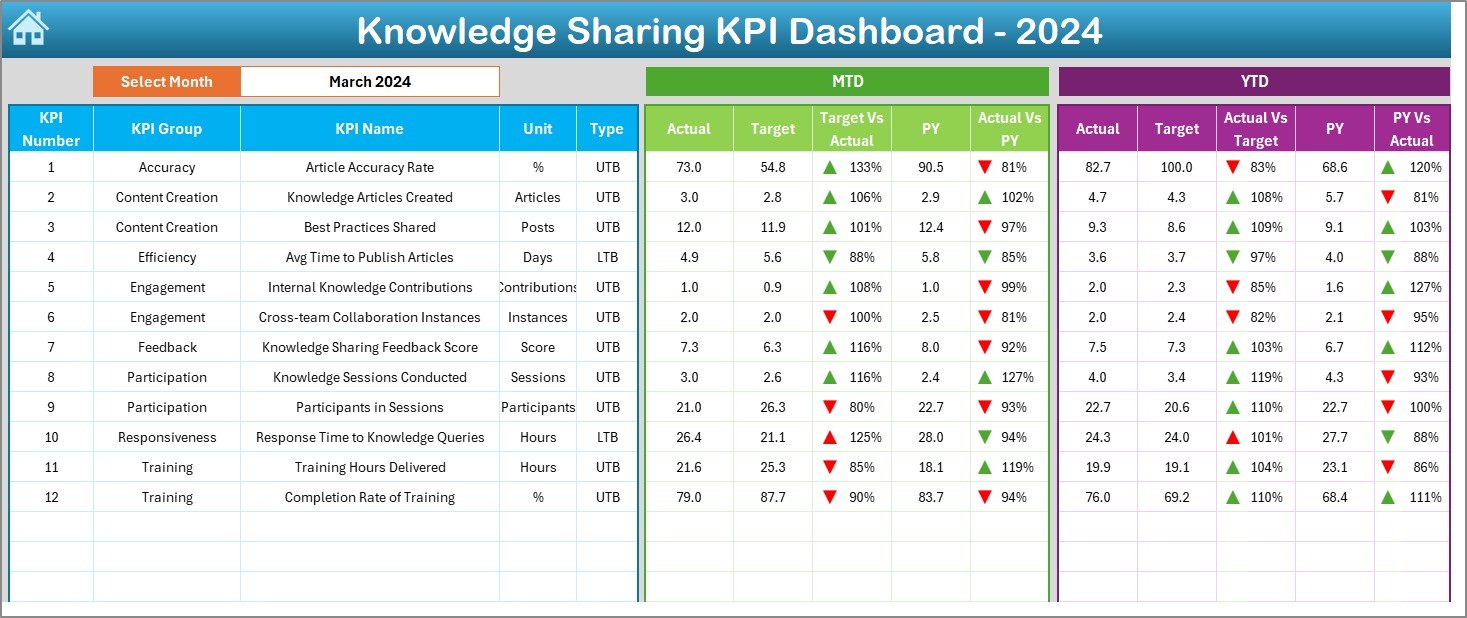
2. Dashboard Sheet Tab
The Dashboard Sheet is the main tab where all KPI data is presented visually. This is where users can track the Month-to-Date (MTD) and Year-to-Date (YTD) metrics for knowledge-sharing activities.
Key Features:
- Month Selector: Use the dropdown in Range D3 to select the month, which updates the entire dashboard.
- MTD and YTD Metrics: Shows Actual, Target, and Previous Year data for each KPI, with Target vs Actual and PY vs Actual comparisons.
- Conditional Formatting: Up and down arrows indicate positive or negative performance.
Click to buy Knowledge Sharing KPI Dashboard in Excel
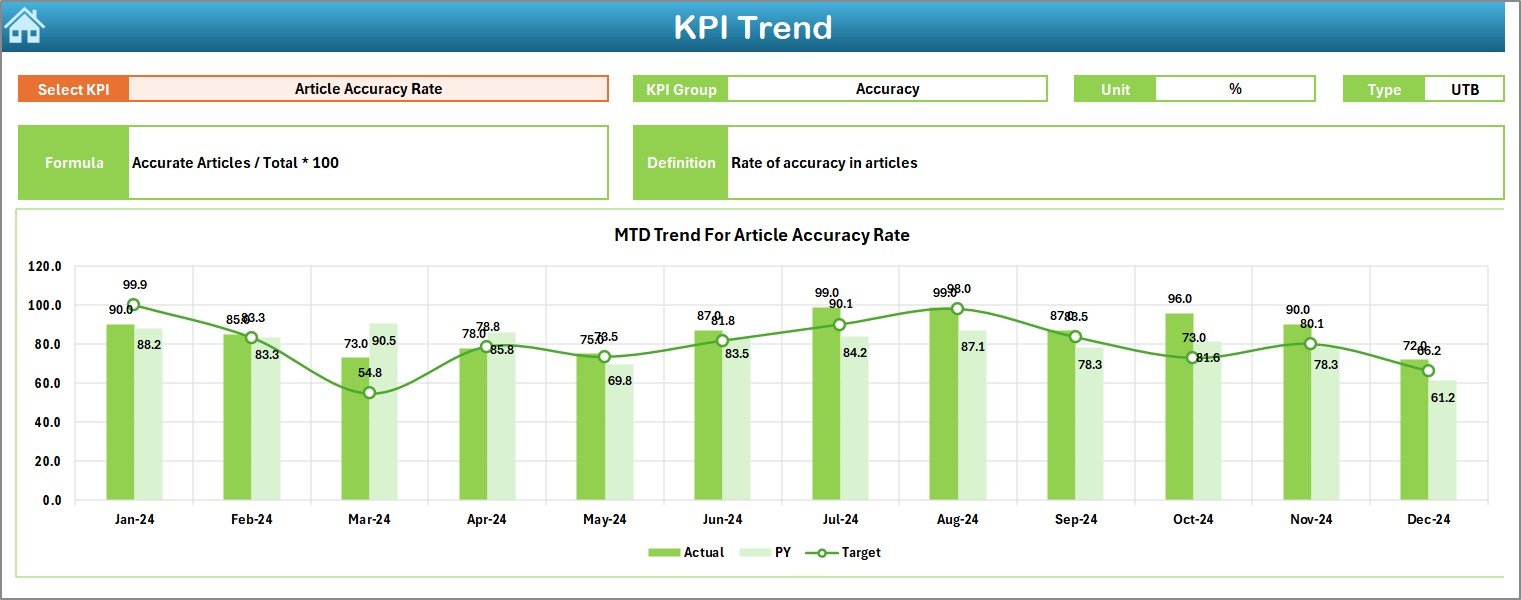
3. KPI Trend Sheet Tab
The KPI Trend Sheet allows users to track the trend of any selected KPI over time, helping organizations analyze performance across multiple periods.
Key Features:
- KPI Dropdown: Select a KPI from the dropdown in Range C3 to view the data for that specific KPI.
- KPI Group and Type: Displays the KPI group (e.g., engagement, productivity) and whether it is a Lower the Better or Upper the Better metric.
- Formula and Definition: Displays the formula for calculating the KPI and a detailed definition.
Click to buy Knowledge Sharing KPI Dashboard in Excel
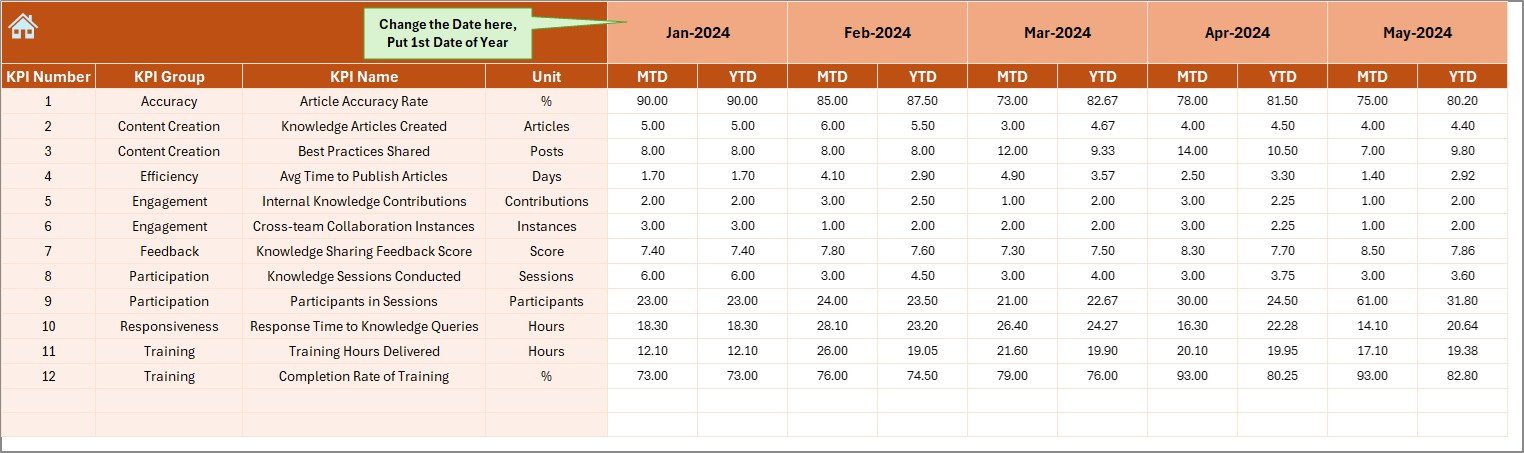
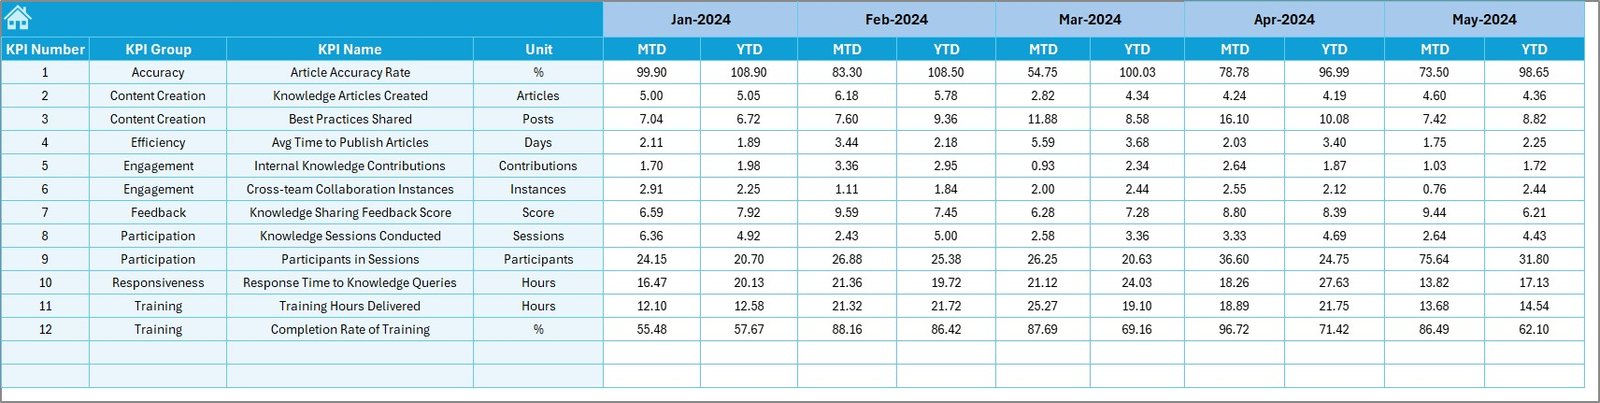
4. Actual Number Sheet Tab
This sheet is where users input the actual performance data for MTD and YTD for each KPI.
Key Features:
- Monthly Data Entry: Input the actual numbers for each KPI corresponding to the first month of the year (via Range E1).
5. Target Sheet Tab
The Target Sheet allows you to set monthly and annual targets for each KPI.
Key Features:
- Enter Monthly and YTD Targets: Input the targets for each KPI, which will then be compared to actual performance.
Click to buy Knowledge Sharing KPI Dashboard in Excel
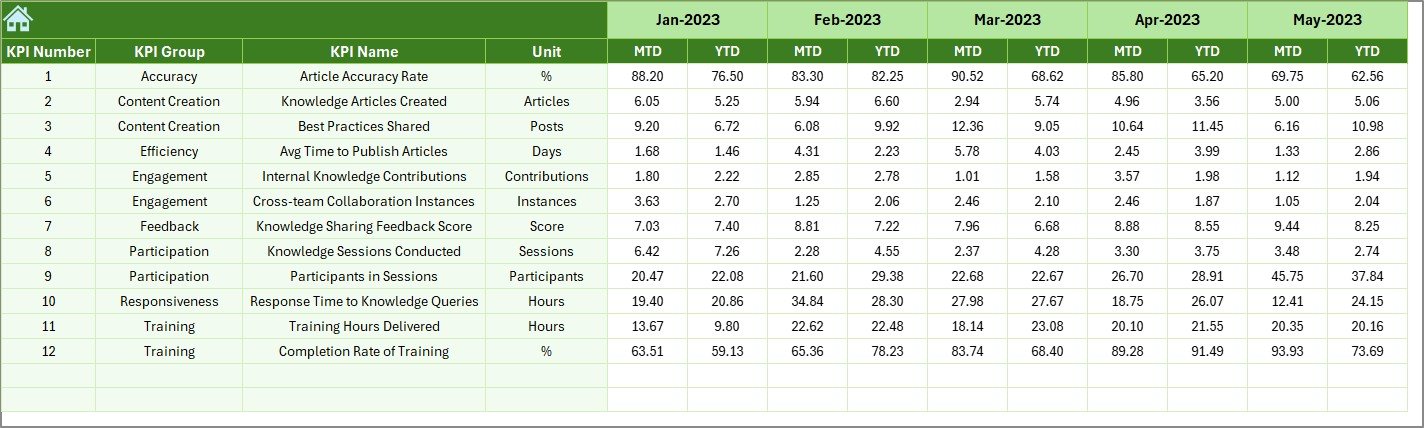
6. Previous Year Number Sheet Tab
This sheet is used to enter data from the previous year, allowing comparisons between the current year and last year’s performance.
Key Features:
- Historical Data Entry: Enter the previous year’s data for each KPI to enable accurate year-over-year comparisons.
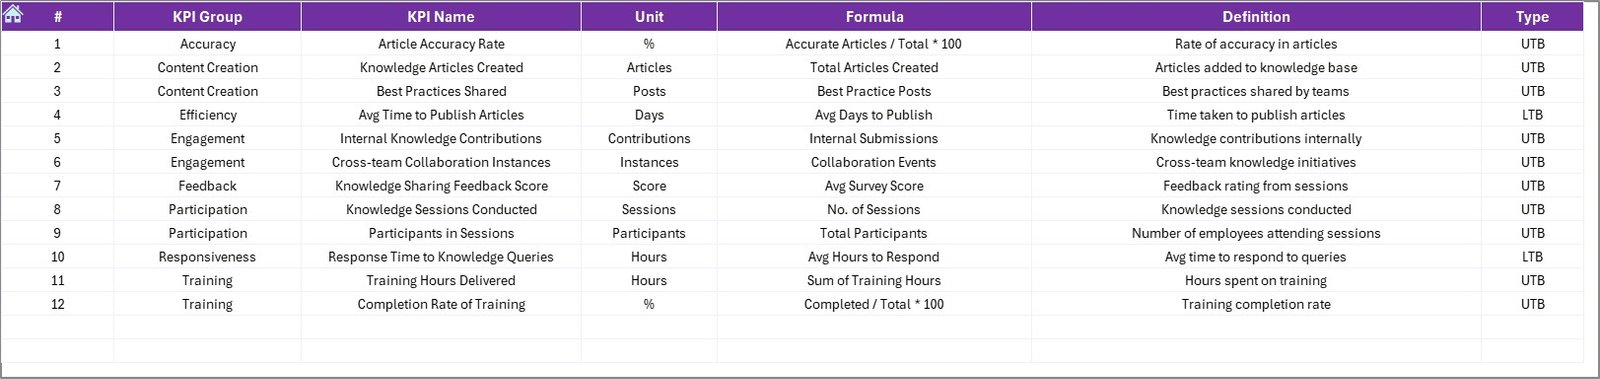
7. KPI Definition Sheet Tab
This sheet provides a comprehensive list of all KPIs, including their definitions, groups, units, and formulas.
Key Features:
- Detailed KPI Information: Capture the KPI Name, Group, Unit, Formula, and Definition for each KPI, ensuring clarity and consistency.
Click to buy Knowledge Sharing KPI Dashboard in Excel
Advantages of Using the Knowledge Sharing KPI Dashboard
The Knowledge Sharing KPI Dashboard provides several benefits to organizations:
- Data-Driven Decision Making; By tracking these KPIs, businesses can make informed decisions about how to improve their knowledge-sharing initiatives.
- Centralized Data: All information is stored in one place, making it easier to access and analyze knowledge-sharing activities.
- Real-Time Tracking: The dashboard is updated automatically as new data is entered, providing real-time insights into knowledge-sharing performance.
- Customization: The dashboard is highly customizable, allowing organizations to tailor it to their specific needs and track KPIs that are most relevant to them.
Opportunities for Improvement in the Knowledge Sharing Dashboard
While the dashboard is highly effective, there are some opportunities for improvement:
- Integration with Other Tools: Integrating with collaboration tools or knowledge management platforms could automate data entry and save time.
- Advanced Analytics: Incorporating advanced analytics, such as sentiment analysis, could provide deeper insights into the effectiveness of knowledge-sharing activities.
Best Practices for Using the Knowledge Sharing KPI Dashboard
Click to buy Knowledge Sharing KPI Dashboard in Excel
To make the most of the Knowledge Sharing KPI Dashboard, follow these best practices:
- Update Regularly: Update the dashboard regularly to ensure that it reflects the most current data.
- Monitor Trends; Track the trends over time to see how knowledge sharing improves or declines and make necessary adjustments.
- Engage Employees: Encourage employee participation in knowledge-sharing initiatives by setting clear goals and measuring progress against KPIs.
Frequently Asked Questions (FAQs)
What are Knowledge Sharing KPIs?
Knowledge Sharing KPIs are metrics used to measure the effectiveness of knowledge sharing within an organization. These KPIs help businesses track the impact of sharing knowledge on employee productivity and performance.
How do I use the Knowledge Sharing KPI Dashboard in Excel?
Simply enter the actual and target data for each KPI into the relevant tabs. The dashboard will update automatically to show the performance comparisons and trends.
Can I customize the KPIs in the Knowledge Sharing Dashboard?
Yes, the KPIs are fully customizable, and you can add or remove KPIs based on your organization’s knowledge-sharing objectives.
Conclusion
Click to buy Knowledge Sharing KPI Dashboard in Excel
The Knowledge Sharing KPI Dashboard in Excel is an invaluable tool for organizations looking to monitor and improve their knowledge-sharing efforts. By tracking relevant KPIs and using the customizable dashboard, organizations can foster a more collaborative and productive environment, ultimately boosting overall performance.
Visit our YouTube channel to learn step-by-step video tutorials
Click to buy Knowledge Sharing KPI Dashboard in Excel