In today’s global healthcare environment, medical tourism has become a fast-growing industry. Patients travel across countries to receive high-quality and cost-effective treatments. However, managing this complex ecosystem requires accurate data tracking and performance monitoring.
So, how can healthcare providers track KPIs, monitor targets, and improve patient outcomes efficiently?
Medical Tourism KPI Dashboard in Power BI.
In this comprehensive guide, you will learn everything about this powerful dashboard. Moreover, you will understand its features, benefits, structure, and best practices. By the end, you will be able to use this dashboard to make smarter, data-driven decisions.
What is a Medical Tourism KPI Dashboard in Power BI?
A Medical Tourism KPI Dashboard in Power BI is an advanced analytics tool that helps healthcare organizations track and evaluate key performance indicators (KPIs) related to medical tourism.
Instead of using multiple reports and spreadsheets, this dashboard provides:
- Centralized KPI tracking
- Real-time performance insights
- Comparison of actual vs target values
- Year-over-Year performance analysis
Moreover, it simplifies complex healthcare data into easy-to-understand visuals.
Why is KPI Tracking Important in Medical Tourism?
Before we dive into the dashboard details, let’s understand why KPI tracking matters.
How Does KPI Tracking Improve Healthcare Performance?
KPI tracking helps healthcare organizations:
- Monitor patient inflow and treatment success
- Track financial performance
- Improve operational efficiency
- Compare performance with targets
As a result, hospitals and medical tourism agencies can improve both service quality and profitability.
What Does This Dashboard Include?
This dashboard is designed in Power BI and uses Excel as a data source. It contains three powerful pages that provide complete insights.
Let’s explore each page in detail.
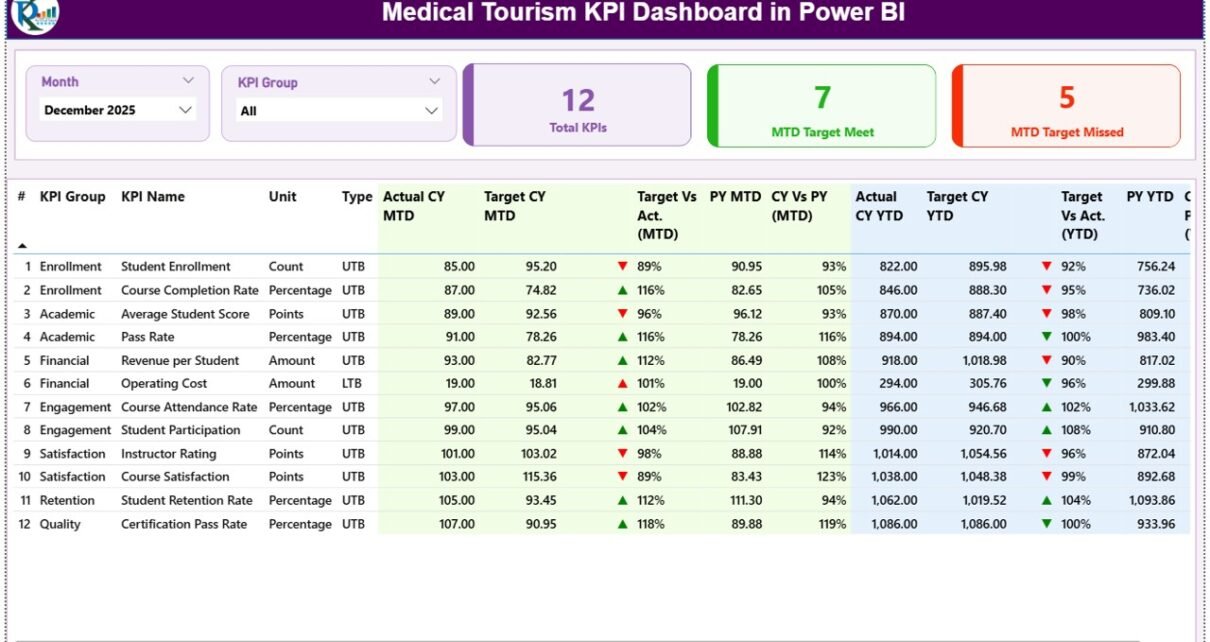
Summary Page: How Can You Monitor KPIs at a Glance?
Click to Buy Medical Tourism KPI Dashboard in Power BI
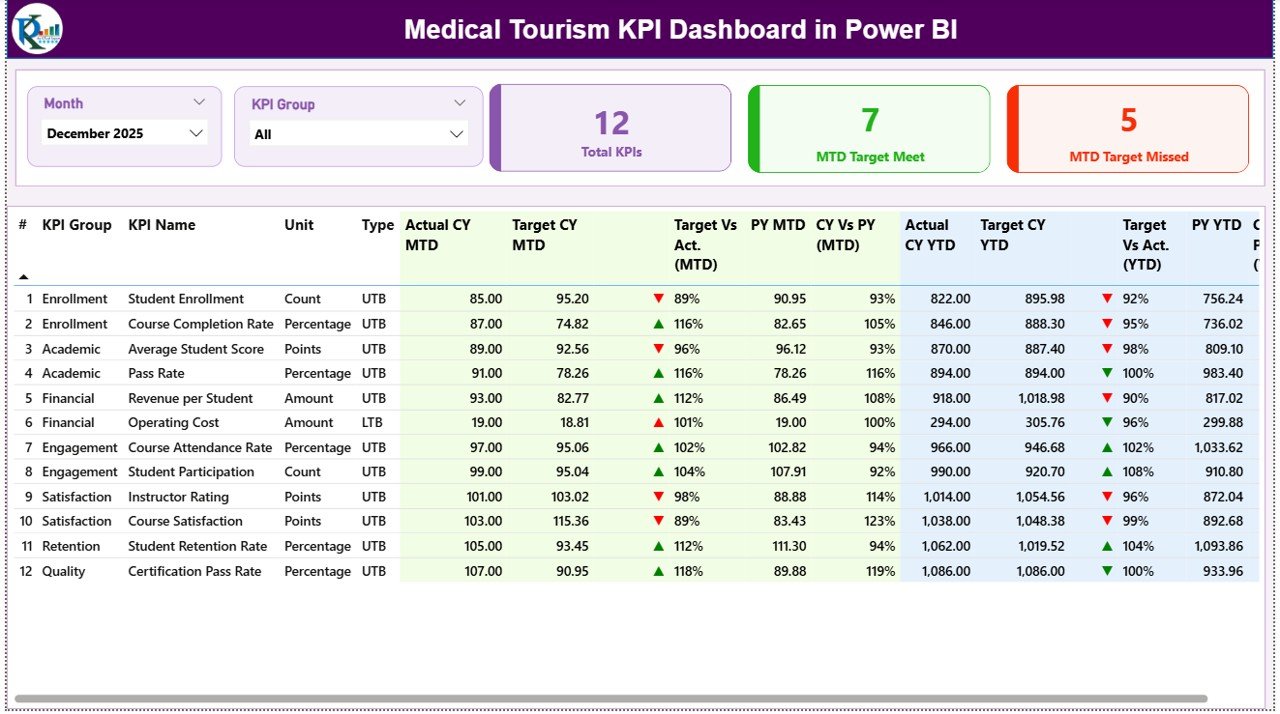
The Summary Page is the main page of the dashboard. It provides a complete overview of all KPIs.
🔹 Top-Level Controls
- Month Slicer → Filter data by selected month
- KPI Group Slicer → Filter by KPI category
These filters allow users to analyze data dynamically.
Key KPI Cards
At the top, you will find three important cards:
- Total KPIs Count
- MTD Target Met Count
- MTD Target Missed Count
Detailed KPI Table
The dashboard includes a detailed table with the following fields:
KPI Information
- KPI Number → Unique identifier
- KPI Group → Category of KPI
- KPI Name → KPI title
- Unit → Measurement unit
- Type (LTB/UTB)
- LTB = Lower the Better
- UTB = Upper the Better
MTD (Month-to-Date) Metrics
- Actual CY MTD → Current year actual value
- Target CY MTD → Target value
- MTD Icon (▲ ▼) → Performance indicator
- Target vs Actual (MTD) → % comparison
- PY MTD → Previous year MTD
- CY vs PY (MTD) → Growth comparison
YTD (Year-to-Date) Metrics
- Actual CY YTD → Current year YTD value
- Target CY YTD → Target value
- YTD Icon (▲ ▼) → Performance indicator
- Target vs Actual (YTD) → % comparison
- PY YTD → Previous year YTD
- CY vs PY (YTD) → Growth comparison
Click to Buy Medical Tourism KPI Dashboard in Power BI
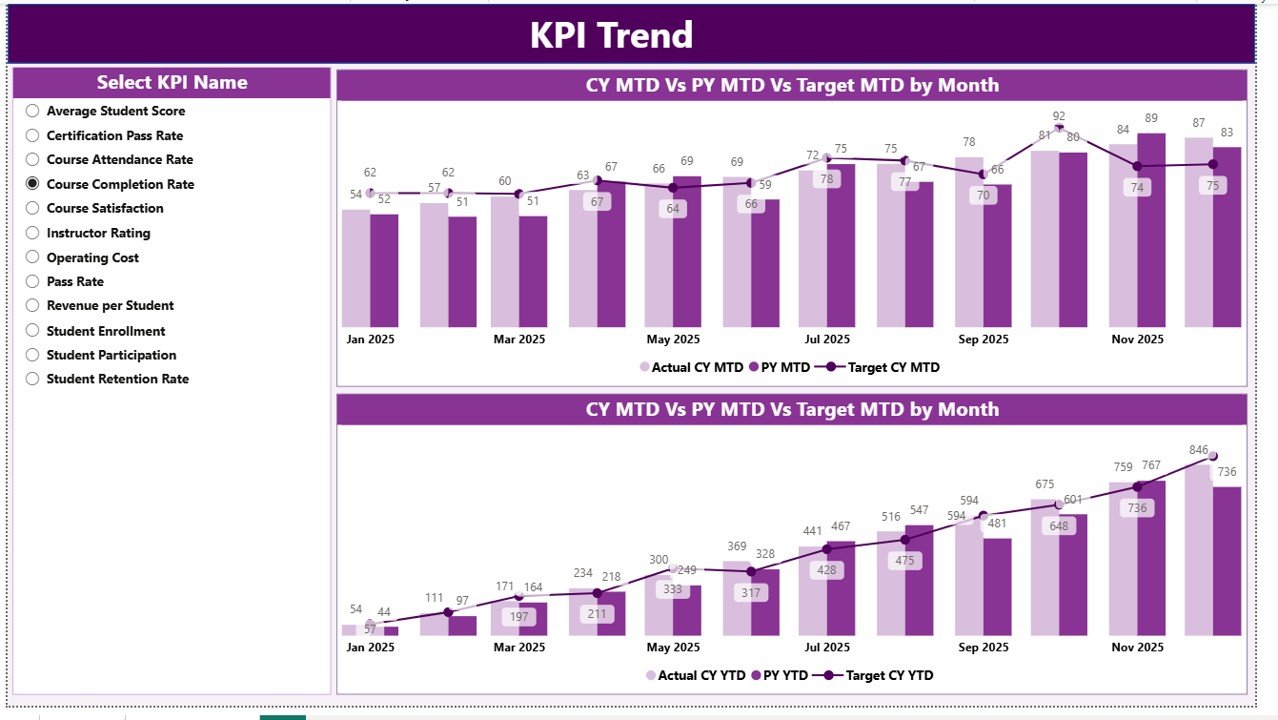
KPI Trend Page: How Do KPIs Change Over Time?
The KPI Trend Page helps you analyze trends and patterns.
Key Features
- Two combo charts
- Compare:
- Current Year Actual
- Previous Year Actual
- Targets
Analysis Types
- MTD Trends
- YTD Trends
Slicer
- KPI selection slicer on the left
Click to Buy Medical Tourism KPI Dashboard in Power BI
KPI Definition Page: What Do Your KPIs Mean?
The KPI Definition Page is a hidden drill-through page.
What Can You See?
- KPI Formula
- KPI Definition
- KPI Type
How to Access?
- Drill through from the Summary Page
- Use the back button to return
KPI Definition Page
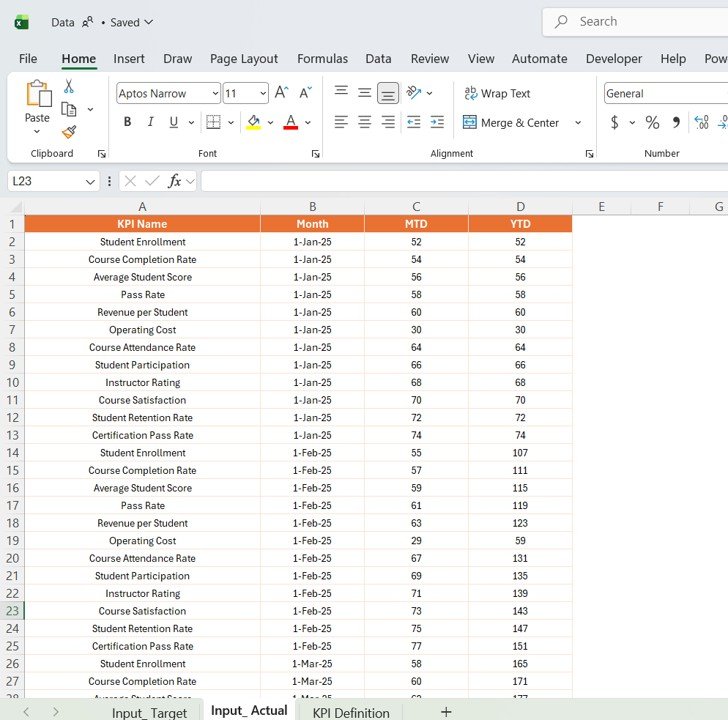
Excel Data Source: How Does the Backend Work?
The dashboard uses an Excel file with three worksheets.
Input_Actual Sheet
In this sheet, you need to enter:
- KPI Name
- Month (First date of month)
- MTD Values
- YTD Values
Click to Buy Medical Tourism KPI Dashboard in Power BI
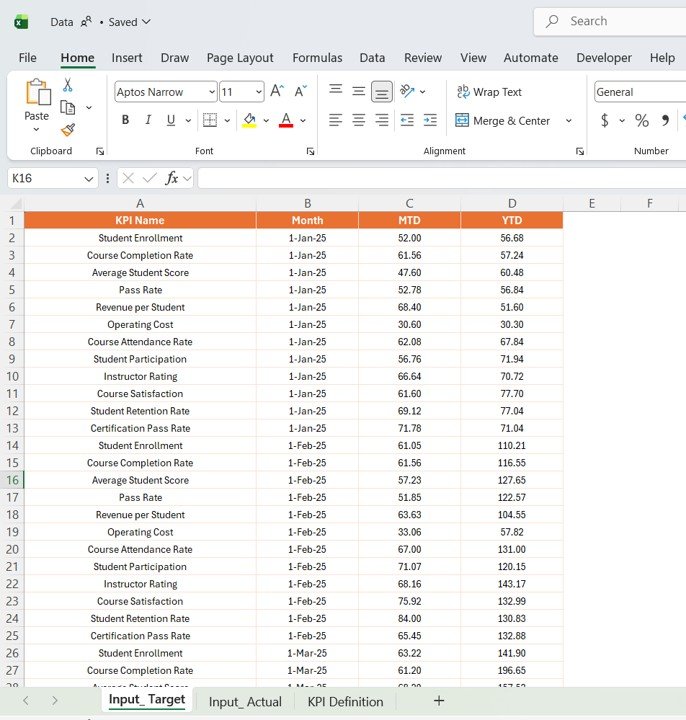
Input_Target Sheet
Here, you enter:
- KPI Name
- Month
- Target MTD Values
- Target YTD Values
Click to Buy Medical Tourism KPI Dashboard in Power BI
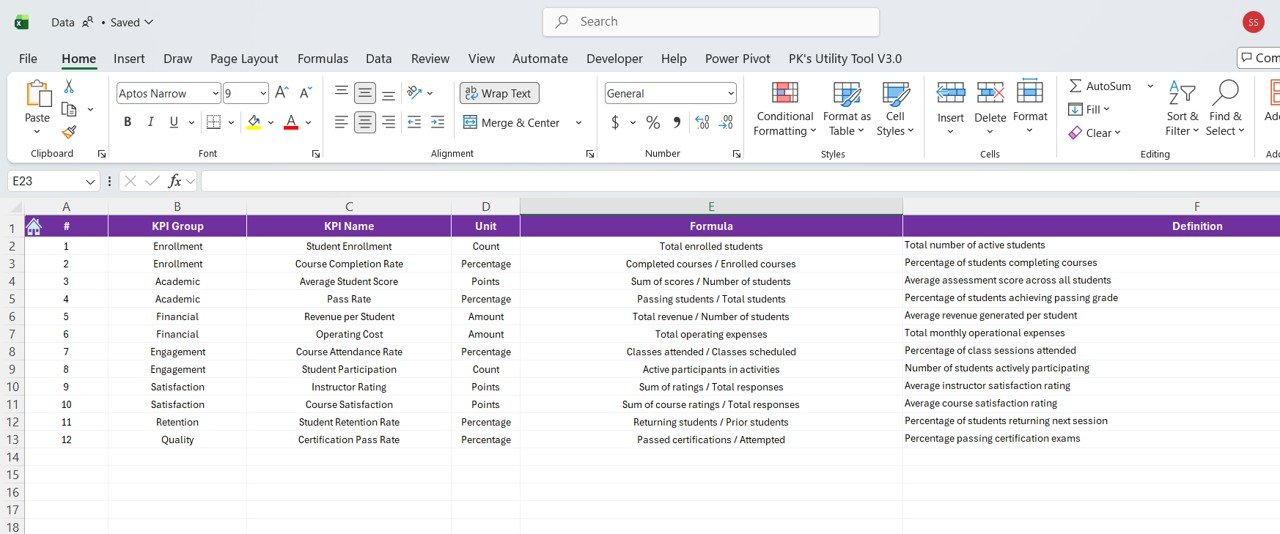
KPI Definition Sheet
This sheet includes:
- KPI Number
- KPI Group
- KPI Name
- Unit
- Formula
- Definition
- Type (LTB/UTB)
How Does This Dashboard Improve Decision-Making?
This dashboard transforms raw data into actionable insights.
Key Benefits
- Real-time performance monitoring
- Faster decision-making
- Improved data accuracy
- Better KPI tracking
Moreover, it helps management focus on important metrics.
Advantages of Medical Tourism KPI Dashboard in Power BI
Click to Buy Medical Tourism KPI Dashboard in Power BI
🚀 Key Advantages
- Centralized Dashboard → All KPIs in one place
- Interactive Filters → Easy data exploration
- MTD & YTD Tracking → Monitor performance easily
- Target Comparison → Identify gaps quickly
- Visual Indicators → Instant performance insights
- Drill-Through Features → Deep analysis
Opportunities for Improvement in KPI Tracking
Even though the dashboard is powerful, improvements are always possible.
Areas to Improve
- Automate data refresh
- Integrate real-time hospital systems
- Add more KPIs
- Improve data accuracy
- Include predictive analytics
Best Practices for the Medical Tourism KPI Dashboard in Power BI
Click to Buy Medical Tourism KPI Dashboard in Power BI
To get maximum value, follow these best practices.
Best Practices
- Keep Data Clean → Avoid errors
- Update Data Regularly → Maintain accuracy
- Focus on Key KPIs → Avoid clutter
- Use Clear Definitions → Ensure consistency
- Train Users → Improve adoption
- Validate Data Frequently → Maintain reliability
Who Can Benefit from This Dashboard?
👥 Target Users
- Hospital Administrators
- Healthcare Analysts
- Medical Tourism Agencies
- Finance Teams
- Consultants
🏥 Use Cases
- Patient performance tracking
- Financial monitoring
- KPI benchmarking
- Operational improvements
Conclusion: Why This Dashboard is Essential?
Click to Buy Medical Tourism KPI Dashboard in Power BI
To sum up, the Medical Tourism KPI Dashboard in Power BI is a powerful tool for healthcare organizations.
It helps track KPIs, compare targets, and improve performance. Moreover, it simplifies complex data into clear insights.
Therefore, if you want to enhance decision-making and improve healthcare outcomes, this dashboard is a must-have.
Visit our YouTube channel to learn step-by-step video tutorials
Click to Buy Medical Tourism KPI Dashboard in Power BI