Managing multiple projects simultaneously can be a challenging task for any organization. To keep track of various projects, their budgets, progress, and milestones, it’s crucial to have an efficient management system. The Multiple Projects Management Dashboard in Power BI is a ready-to-use tool designed to streamline project management tasks. This powerful tool integrates all the essential project metrics into one comprehensive dashboard, allowing you to monitor, evaluate, and analyze multiple projects effectively.
In this article, we will explore the key features, benefits, and how this dashboard can help you manage your projects with ease.
What is the Multiple Projects Management Dashboard in Power BI?
The Multiple Projects Management Dashboard in Power BI is a data visualization tool that allows project managers to track and manage multiple projects efficiently. Using Power BI, this dashboard consolidates project data into an interactive, easy-to-read format. It includes essential metrics such as project completion status, budget analysis, milestone achievement, and department performance.
This tool can be customized based on the unique needs of your organization, making it a flexible solution for various industries and types of projects.
Key Features of the Multiple Projects Management Dashboard
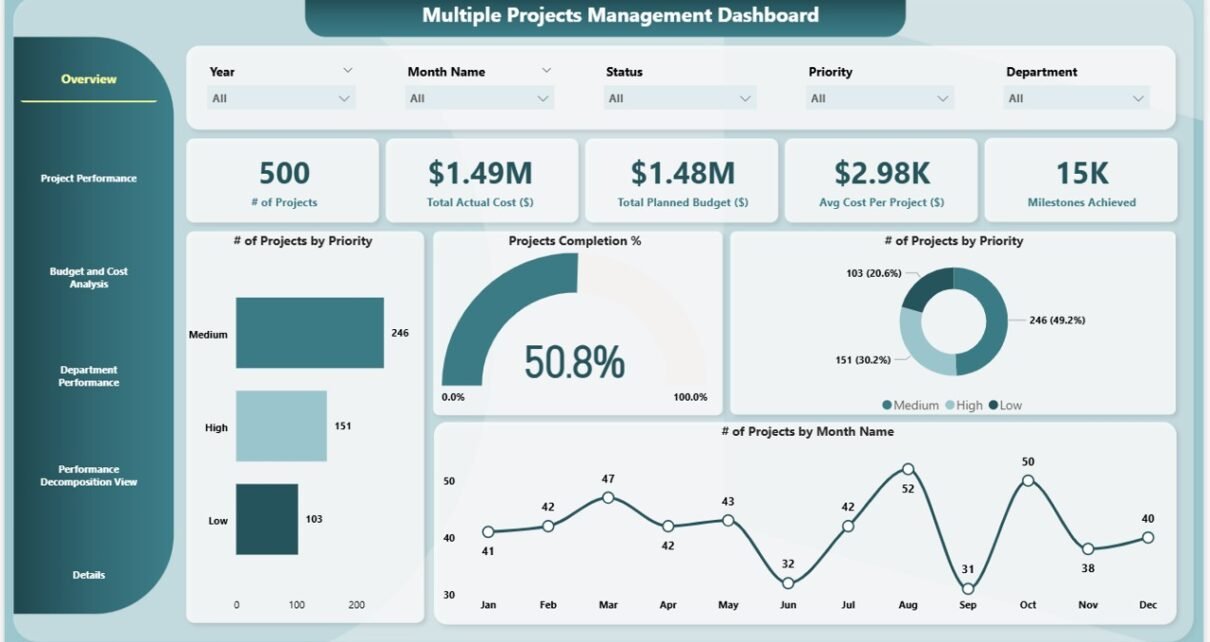
Overview Page: A Snapshot of All Projects
The Overview Page serves as the main dashboard where you get a comprehensive snapshot of all ongoing projects. Here’s what it includes:
Cards:
- # of Projects: Displays the total number of active projects.
- Actual Cost: Shows the actual cost incurred so far for all projects.
- Total Planned Budget: Shows the total planned budget allocated for all projects.
- Average Cost per Project: Calculates the average cost per project.
- Milestones Achieved: Displays the total number of milestones achieved across all projects.
Charts:
- # of Projects by Priority: Breaks down the number of projects by their priority level (high, medium, low).
- Projects Completion Percentage: Displays the overall project completion percentage.
- # of Projects by Month: Shows how many projects are being worked on in each month.
- # of Projects by Priority: Provides insights into the distribution of projects based on priority.

Project Performance Page: Detailed Insights into Project Progress
The Project Performance Page provides detailed charts that show how well each project is performing. This page includes:
Charts:
- Achieved vs Total Milestones by Project Name: This chart shows the milestones that have been achieved compared to the total number of milestones for each project.
- Completed vs Pending Projects by Project Name: Tracks which projects are completed and which are pending, helping you identify delays or areas needing attention.

Budget and Cost Analysis Page: Financial Overview of Projects
The Budget and Cost Analysis Page helps track the financial aspects of each project, comparing actual costs with planned budgets.
Charts:
- Actual vs Budget by Month: Displays the actual expenditure versus the planned budget for each month.
- Total Actual Cost and Planned Budget by Priority: This chart compares the planned budgets and actual costs of projects based on their priority level.
- Total Planned Budget and Actual Cost by Project Manager: Shows the financial performance of each project by project manager.
- Total Planned Budget and Actual Cost by Project Name: Provides insights into each project’s financials, showing both the planned budget and actual costs.

Department Performance Page: Tracking Departmental Contributions
The Department Performance Page focuses on departmental achievements, giving you insights into how different departments are performing within various projects.
Charts:
- Total Milestones and Milestones Achieved by Department: This chart compares the total milestones set against the actual milestones achieved by each department.
- Projects Completion Percentage by Department: Displays the percentage of completion for projects managed by each department.
- # of Projects by Department: Tracks the number of projects being managed by each department.
- Total Planned Budget and Actual Cost by Department: Compares the planned budget and actual cost incurred by each department.

Performance Decomposition View Page: Analyzing Data with Decomposition Tree
The Performance Decomposition View Page provides a deeper level of analysis using a decomposition tree. This powerful feature breaks down complex data into various segments, helping you identify the root cause of any issues or inefficiencies.
Chart:
- Decomposition Tree: This tool allows you to drill down into the data and visualize how different factors (such as project priority, department, or budget) contribute to overall performance.

Details Page: Deep Dive into Project Data
The Details Page offers a comprehensive view of individual projects, showing detailed information about each project’s progress, budget, and milestones. This page allows project managers to drill down into any project for a closer look at its performance.

Benefits of Using the Multiple Projects Management Dashboard in Power BI
The Multiple Projects Management Dashboard in Power BI offers several advantages to organizations looking to streamline project management. Here are some of the key benefits:
-
Comprehensive Overview: The dashboard consolidates key metrics and data into one place, giving you a clear overview of all your projects.
-
Real-Time Data: By integrating with real-time data sources, the dashboard ensures that your project tracking is always up-to-date.
-
Improved Decision Making: The visual insights provided by Power BI allow managers to make data-driven decisions, improving project outcomes.
-
Enhanced Communication: The interactive charts and visualizations make it easier to communicate project performance to stakeholders, helping ensure transparency and alignment.
-
Time-Saving: Automating the collection and presentation of data saves time and reduces the risk of human error.
Best Practices for Using the Multiple Projects Management Dashboard
To get the most out of your Multiple Projects Management Dashboard in Power BI, here are some best practices to follow:
-
Regularly Update Data: Ensure that your data source (Excel or any other integrated system) is updated regularly to keep the dashboard relevant and accurate.
-
Focus on Key Metrics: While the dashboard provides a wealth of data, focus on the most critical metrics that align with your project goals and objectives.
-
Use Filters and Slicers: Utilize filters and slicers to analyze specific projects, departments, or time periods in more detail.
-
Leverage the Decomposition Tree: Use the decomposition tree to drill down and analyze performance in more granular detail, helping you identify areas of improvement.
-
Review Departmental Performance: Regularly review departmental performance to ensure each department is meeting its targets and milestones.
Conclusion
The Multiple Projects Management Dashboard in Power BI is an indispensable tool for project managers overseeing multiple projects simultaneously. With its comprehensive overview, detailed insights, and real-time data, it allows for better decision-making, enhanced project performance, and improved efficiency. Whether you’re tracking budgets, milestones, or departmental performance, this dashboard provides all the data you need in one easy-to-use interface.
Frequently Asked Questions (FAQs)
1. How often should I update the data in the Multiple Projects Management Dashboard?
It’s recommended to update the data at least once a week or monthly, depending on the frequency of changes in your project data. Regular updates ensure that the dashboard reflects the most current project status.
2. Can I customize the dashboard to fit my organization’s needs?
Yes, the dashboard is highly customizable. You can tailor the metrics, charts, and views to match your organization’s specific project management requirements.
3. Is it possible to integrate data from other systems?
Yes, Power BI supports integration with various data sources, including Excel, SQL databases, and cloud-based systems, making it easy to pull in data from other platforms.
4. How can the decomposition tree benefit project managers?
The decomposition tree allows project managers to break down complex data into smaller, more manageable segments, helping identify the root causes of issues and make informed decisions.
5. Is the dashboard suitable for both small and large organizations?
Absolutely! The dashboard is scalable and can be customized for both small teams and large organizations. It’s flexible enough to handle multiple projects of any size.
Watch the step-by-step video Demo:
Visit our YouTube channel to learn step-by-step video tutorials
Youtube.com/@NeotechNavigators