Managing the performance of nutrition and dietetics programs becomes easier when you use the right analytical tools. Dietitians, nutrition managers, and healthcare planners deal with many performance indicators every month. They track meal compliance, client satisfaction, calorie intake performance, case progress, diet adherence, and service delivery efficiency. Because these KPIs change often, teams need a simple and reliable way to measure results and improve outcomes.
A Nutrition & Dietetics KPI Dashboard in Power BI solves these challenges. It brings all KPIs into one interactive report and helps professionals understand performance at a glance. Since Power BI offers clean visuals, quick filtering options, and advanced drill-through insights, users can monitor daily, monthly, and yearly progress with ease.
In this detailed guide, you will learn everything about this dashboard—its structure, features, data flow, advantages, best practices, and answers to common questions. You will also see how this dashboard helps nutrition professionals make better decisions and deliver better outcomes.
Click to buy Nutrition & Dietetics KPI Dashboard in Power BI
What Is a Nutrition & Dietetics KPI Dashboard in Power BI?
A Nutrition & Dietetics KPI Dashboard in Power BI is a ready-to-use reporting solution that tracks all important performance indicators related to nutrition programs. It presents clear insights through interactive charts, slicers, and KPI cards. Since it pulls data from a simple Excel file, any nutrition team can update KPIs without advanced technical knowledge.
This dashboard gives a complete view of monthly trends, year-to-date values, target achievement, previous-year comparison, and KPI definitions. It also simplifies the process of identifying gaps and planning improvements.
Because the dashboard works inside Power BI, professionals save time and effort. They no longer move between multiple spreadsheets, and they avoid the chance of missing important data trends.
Why Do Nutrition & Dietetics Teams Need a KPI Dashboard?
Nutrition teams track many operational and outcome-based KPIs. These KPIs help dietitians and managers understand if programs meet their goals, support their clients, and follow standards. But when teams use manual spreadsheets, the process becomes slow and confusing.
A KPI dashboard helps because:
- It captures all KPIs in one place.
- It updates results instantly when you change the month or KPI group.
- It presents data in a simple, visual format.
- It highlights improvement areas and target gaps.
- It supports data-driven decision-making.
Because diet-related outcomes change regularly, a dashboard ensures that teams stay aligned and take quick action when needed.
Key Features of the Nutrition & Dietetics KPI Dashboard in Power BI
This dashboard includes three powerful pages inside Power BI:
Summary Page – The Main Performance Overview
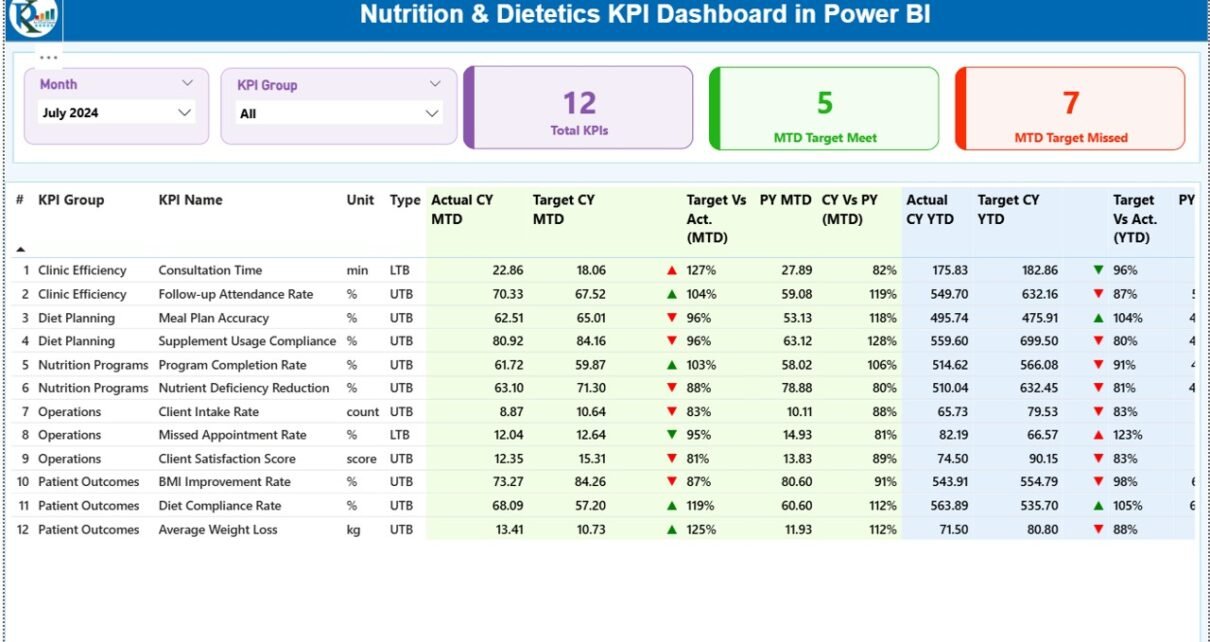
The Summary Page gives a complete view of all KPIs for the selected month. It includes:
Slicers
- Month Selector – choose any month to update the entire dashboard.
- KPI Group Selector – view specific categories like Meal Planning KPIs, Diet Compliance KPIs, Client Feedback KPIs, or Clinical Nutrition KPIs.
KPI Cards
The page displays:
- Total KPIs Count
- MTD Target Met Count
- MTD Target Missed Count
These cards help you understand overall performance in a few seconds.
Detailed KPI Table
The table includes many important fields:
- KPI Number – unique ID for each KPI
- KPI Group – category or domain
- KPI Name – indicator name
- Unit – measurement unit
- Type (LTB/UTB) – Lower-the-Better or Upper-the-Better
- Actual CY MTD – current year’s month-to-date actual value
- Target CY MTD – current year’s MTD target
- MTD Icon – ▲ or ▼ with green/red color for target status
- Target vs Actual (MTD) – % comparison
- PY MTD – previous year’s MTD value
- CY vs PY (MTD) – % comparison with previous year
- Actual CY YTD – year-to-date actual value
- Target CY YTD – year-to-date target
- YTD Icon – ▲ or ▼ for YTD target status
- Target vs Actual YTD – % comparison
- PY YTD – previous year’s YTD value
- CY vs PY (YTD) – % comparison
Since the table updates with every slicer selection, users get a dynamic analysis of performance.

Click to buy Nutrition & Dietetics KPI Dashboard in Power BI
KPI Trend Page – Visual Trend Analysis
The KPI Trend Page is useful for understanding how performance changes over time.
Main Features
- Two combo charts
- Shows Actuals, Targets, and Previous Year numbers
- Separate views for MTD and YTD trends
- A left-side slicer to select any KPI
Users can check patterns, growth, fluctuations, and improvements. This trend analysis helps nutrition teams plan better strategies for upcoming months.

Click to buy Nutrition & Dietetics KPI Dashboard in Power BI
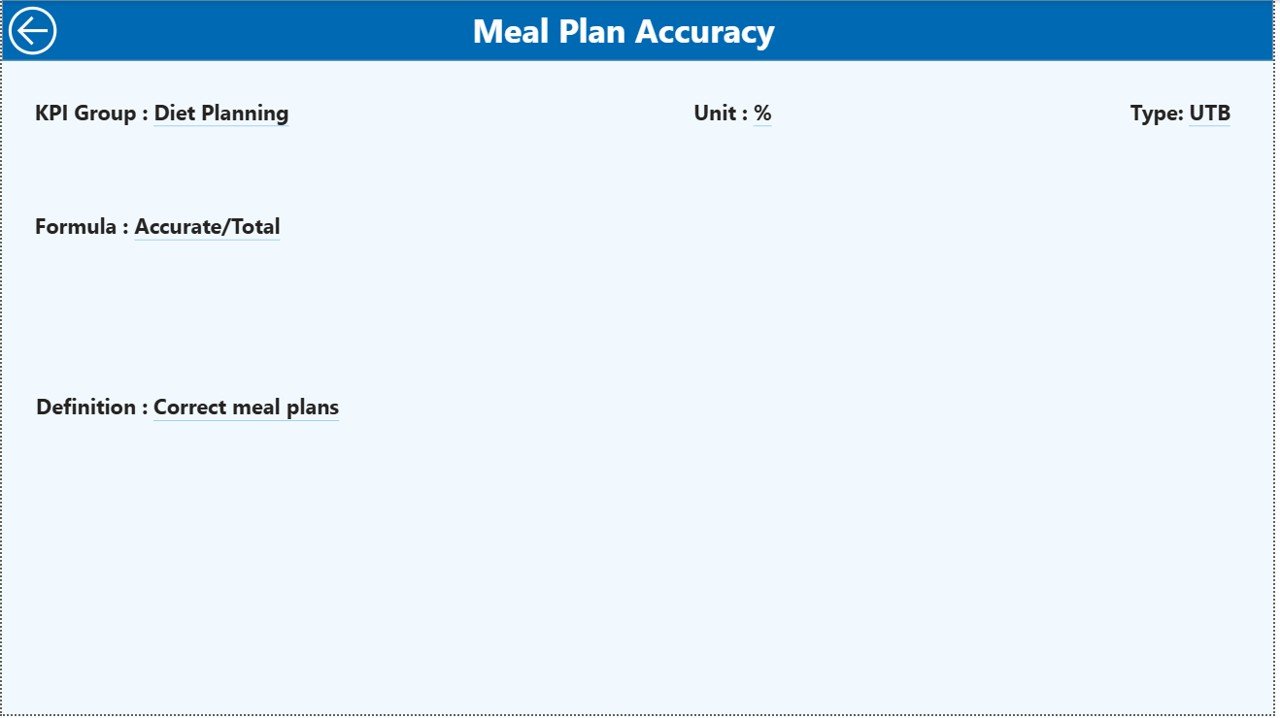
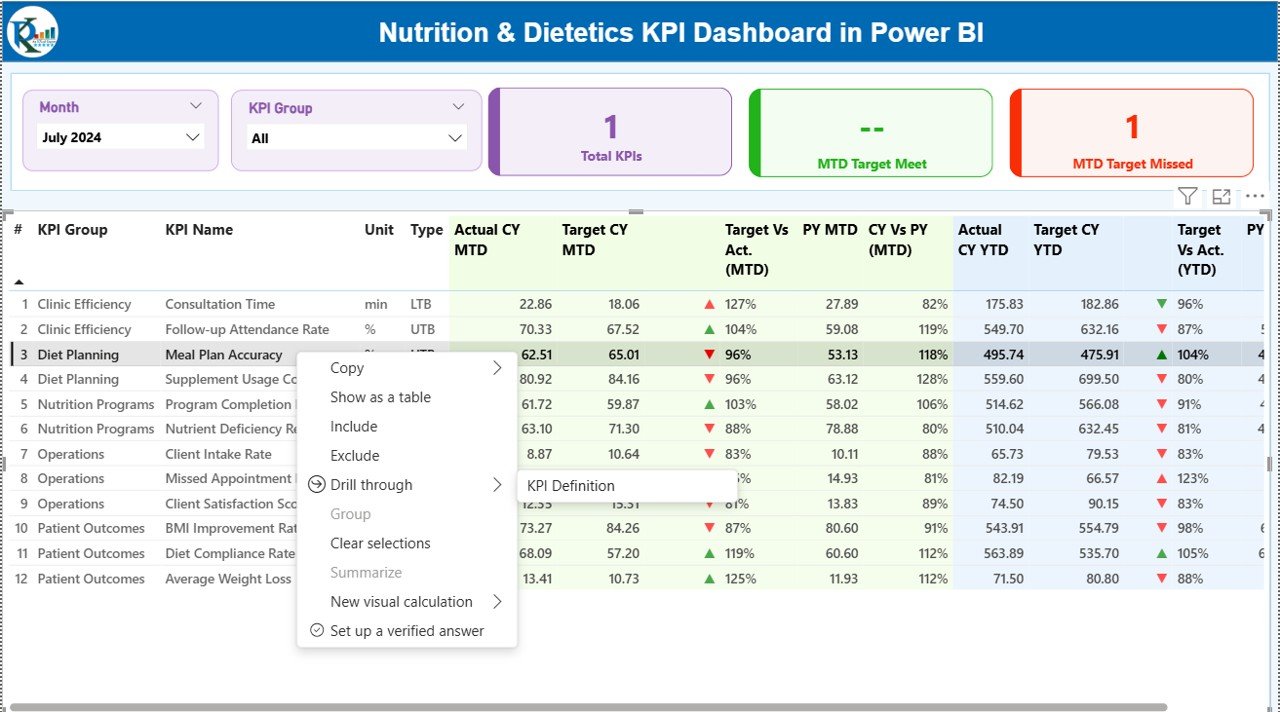
KPI Definition Page – Drill-Through Insights
The KPI Definition Page provides detailed information about every KPI. It includes:
- Formula
- KPI definition
- KPI category
- Measurement type
- Business logic
Users can access this page by drilling through from the Summary Page. A back button on the top-left corner helps users return to the main view.
This page stays hidden, which keeps the dashboard clean while still offering deeper insights when needed.
Click to buy Nutrition & Dietetics KPI Dashboard in Power BI
How the Dashboard Uses Excel Data
The dashboard works on three simple Excel sheets. Anyone can update these sheets, even without advanced Power BI knowledge.
- Input_Actual Sheet
This sheet stores:
- KPI Name
- Month (use the first day of the month)
- MTD Actual
- YTD Actual
You only enter numbers once every month, and Power BI refreshes the dashboard.
- Input_Target Sheet
This sheet includes:
- KPI Name
- Month
- MTD Target
- YTD Target
It helps the dashboard calculate target achievement.
- KPI Definition Sheet
This sheet has:
- KPI Number
- KPI Group
- KPI Name
- Unit
- Formula
- Definition
- Type (LTB or UTB)
This table feeds the drill-through page.
Because all sheets follow a clean structure, anyone can manage the entire dashboard with ease.
Click to buy Nutrition & Dietetics KPI Dashboard in Power BI
Which KPIs Can You Track in This Dashboard?
A Nutrition & Dietetics team can track many performance indicators. Some common examples include:
- Meal plan accuracy
- Diet adherence rate
- Client satisfaction score
- Calorie intake deviation
- Nutrient balance score
- Consultation completion rate
- Follow-up compliance
- Diet program success rate
- Client progress score
- Food waste percentage
- Supplement usage accuracy
- Nutrition program reach
The dashboard supports all types of KPIs, whether operational, clinical, or outcome-based.
Advantages of a Nutrition & Dietetics KPI Dashboard in Power BI
A KPI dashboard brings many benefits to nutrition teams. Below are the main advantages:
- You Get Clear and Real-Time Insights
The dashboard updates immediately when you refresh Power BI. You see current trends, target gaps, and progress indicators without manual calculation.
- You Improve Diet Program Performance
When nutrition teams compare actual and target values, they identify missing areas quickly. It helps them take action at the right time.
- You Make Better Decisions
When users see trends for MTD and YTD values, they make data-driven decisions. It becomes easy to plan nutrition programs and control operational processes.
- You Save Time and Reduce Manual Work
Teams enter data only once in Excel. Everything else happens automatically in Power BI. This saves hours every month.
- You Get Beautiful Visuals
The dashboard uses combo charts, KPI cards, and color-coded icons. Users understand performance without reading lengthy reports.
- You Improve Reporting Quality
Consistent KPIs and structured data improve reporting accuracy. Managers can trust the numbers and plan strategies confidently.
- You Standardize Performance Measurement
The dashboard ensures every nutrition team follows the same KPI logic. This brings structure to the entire workflow.
Best Practices for the Nutrition & Dietetics KPI Dashboard
You get better results when you follow the best practices listed below:
- Define Clear KPI Groups
Use meaningful groups like Clinical Nutrition KPIs, Diet Planning KPIs, Client Monitoring KPIs, or Quality KPIs.
- Keep the Excel Structure Clean
Avoid blank rows, spelling errors, merged cells, or duplicate KPI names.
- Update Data on the First Day of Every Month
This ensures MTD and YTD values stay accurate.
- Follow LTB and UTB Standards Correctly
- LTB – Lower values indicate better performance (e.g., food waste).
- UTB – Higher values indicate better performance (e.g., client satisfaction score).
- Review Trend Pages Regularly
Trend charts help you identify seasonality, improvements, and slowdowns.
- Use Drill-Through Page for Analysis
Check formula and definition before changing targets or KPI logic.
- Keep Visuals Simple
Too many visuals confuse users. Keep the layout clean and easy to understand.
- Refresh Power BI After Every Update
Always refresh the dashboard after updating Excel sheets.
How This Dashboard Helps Nutrition Professionals
Nutrition and dietetics professionals work with clients, programs, and health outcomes. They must track many metrics daily, weekly, and monthly. This dashboard helps them because:
- It simplifies monitoring.
- It offers clear comparisons.
- It highlights problem areas.
- It supports performance improvement.
- It provides transparency for audits and reporting.
- It helps maintain quality compliance.
Since results appear in an easy format, professionals stay focused on improving client health and nutrition outcomes.
Conclusion
A Nutrition & Dietetics KPI Dashboard in Power BI transforms the way nutrition teams track performance. It gives clear insights, removes manual work, and ensures accurate reporting. Because the dashboard connects with simple Excel files, anyone can maintain it without technical difficulty. This makes the dashboard a powerful tool for hospitals, diet clinics, wellness centers, fitness programs, school nutrition departments, and community nutrition projects.
When you use this dashboard regularly, you improve decision-making, strengthen client outcomes, and manage your nutrition programs with confidence.
Frequently Asked Questions (FAQs)
- Who can use a Nutrition & Dietetics KPI Dashboard?
Nutritionists, dietitians, healthcare managers, wellness trainers, food service teams, and clinical nutrition departments can use this dashboard.
- Do I need advanced Power BI skills to use it?
No. You only update Excel sheets. Power BI updates everything automatically.
- What are the main KPI types included?
MTD, YTD, Target, Previous Year, LTB, and UTB KPIs.
- Can I add more KPIs later?
Yes. Add them to the Excel file and refresh Power BI.
- Can this dashboard track client progress?
Yes. You can track diet adherence, calorie intake, satisfaction scores, and consultation completion.
- Can the dashboard show yearly trends?
Yes. The KPI Trend Page shows monthly performance and yearly comparison.
- Can I customize the visuals?
Yes. Power BI allows full customization.
- How often should I update the data?
It is ideal to update data every month or as per your reporting needs.
Visit our YouTube channel to learn step-by-step video tutorials
Watch the step-by-step video tutorial:
Click to buy Nutrition & Dietetics KPI Dashboard in Power BI