Managing port tenders involves complex processes, strict compliance, multiple stakeholders, and continuous performance monitoring. However, when organizations rely only on spreadsheets or manual tracking, they often face delays, errors, and lack of visibility. That is exactly why a Port Tender KPI Dashboard in Power BI becomes an essential business intelligence tool.
This detailed guide explains everything about the Port Tender KPI Dashboard in Power BI, including its structure, features, advantages, best practices, and real-world usage. Moreover, you will learn how this dashboard helps port authorities, logistics companies, and tender management teams track performance efficiently and make data-driven decisions.
What Is a Port Tender KPI Dashboard in Power BI?
A Port Tender KPI Dashboard in Power BI is a visual reporting solution that helps organizations monitor tender-related performance indicators using interactive charts, tables, and KPIs.
Instead of managing multiple Excel files and manual reports, this dashboard consolidates all tender data into a single, structured Power BI report. As a result, users can track progress, compare actuals with targets, and evaluate trends with ease.
Moreover, the dashboard uses Excel as a backend data source, which means data updates remain simple and user-friendly. Once the Excel file updates, Power BI refreshes the visuals automatically.
Why Do Ports Need a Tender KPI Dashboard?
Port operations involve multiple tenders for infrastructure, logistics, maintenance, and services. Therefore, performance tracking becomes critical for transparency and efficiency.
A Port Tender KPI Dashboard helps by:
- Improving visibility of tender performance
- Reducing manual reporting effort
- Monitoring monthly and yearly progress
- Identifying underperforming KPIs early
- Supporting data-driven decision-making
Furthermore, it ensures accountability by tracking targets against actual results.
Overview of the Port Tender KPI Dashboard Structure
The Port Tender KPI Dashboard in Power BI contains three main pages, each designed for a specific analytical purpose.
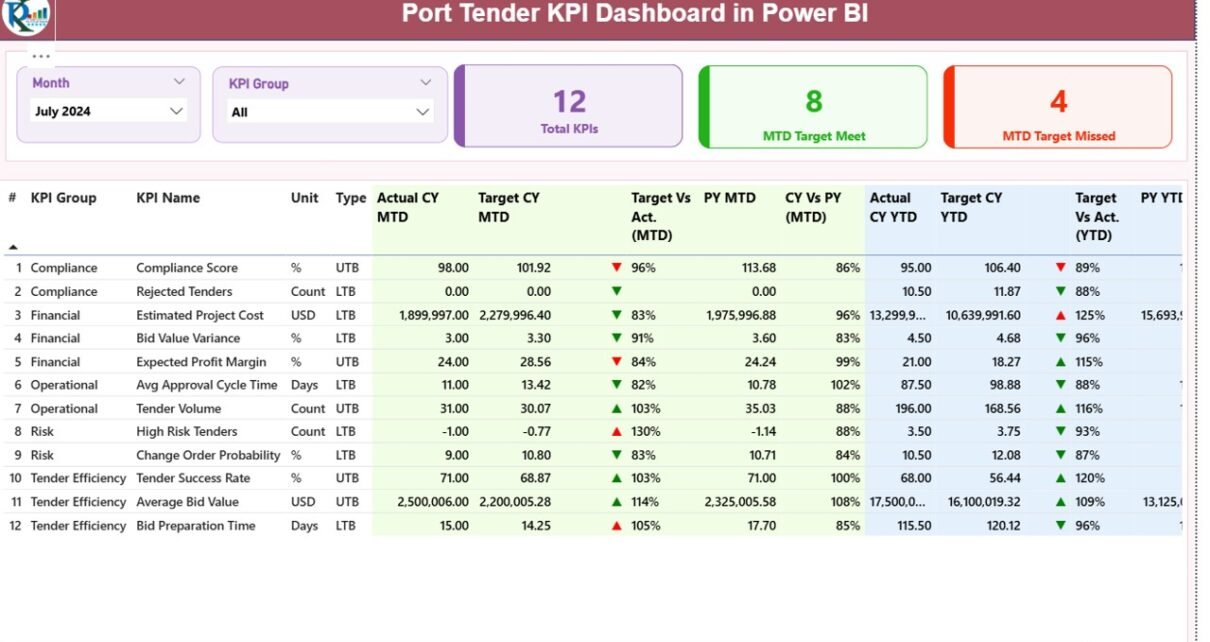
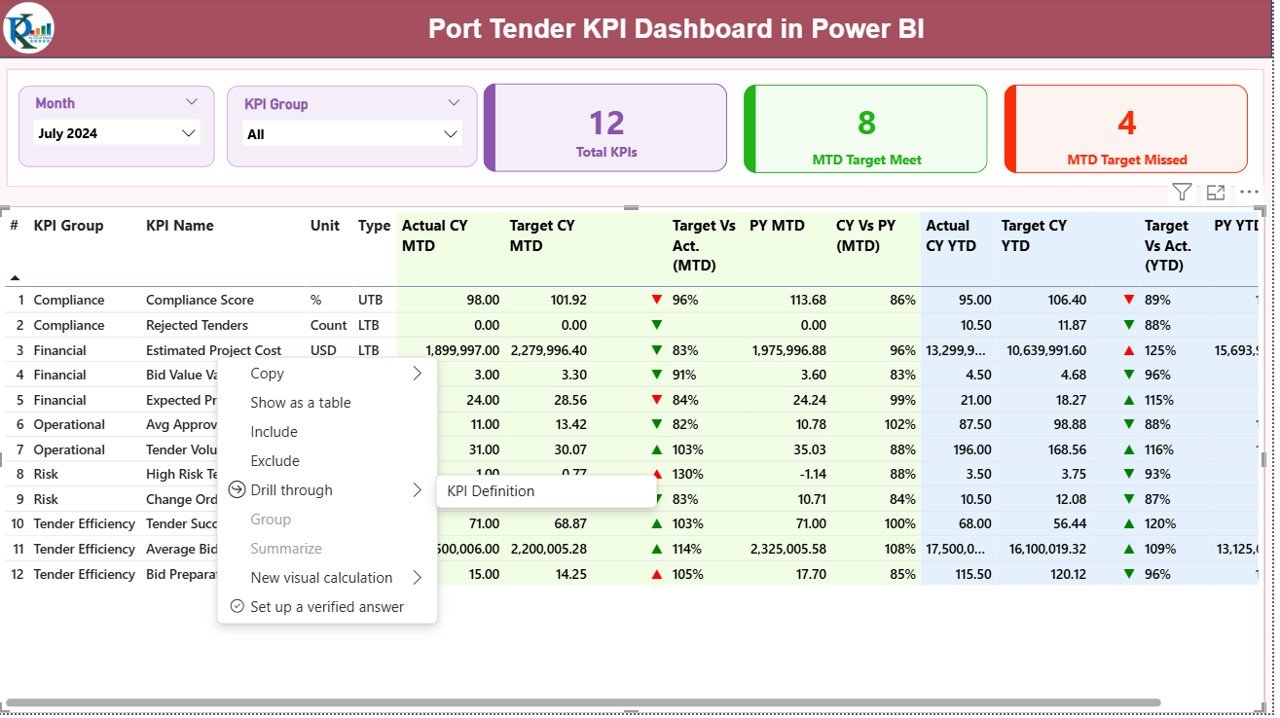
Summary Page – Performance Overview
The Summary Page serves as the main dashboard view. It provides a complete snapshot of tender performance at a glance.
Key Elements of the Summary Page
Slicers
- Month Slicer – Filters data by selected month
- KPI Group Slicer – Filters KPIs based on category
These slicers allow quick analysis without changing data manually.
KPI Summary Cards
At the top of the dashboard, you can see three important KPI cards:
- Total KPI Count
- MTD Target Met Count
- MTD Target Missed Count
These cards instantly highlight overall performance status.
Detailed KPI Table
The table provides in-depth KPI-level information, including:
- KPI Number – Unique identifier for each KPI
- KPI Group – Category or department of KPI
- KPI Name – Name of the performance metric
- Unit – Measurement unit (%, Days, Numbers, etc.)
- Type – LTB (Lower the Better) or UTB (Upper the Better)
Monthly Performance Metrics
- Actual CY MTD – Current Year Month-to-Date actual value
- Target CY MTD – Target value for the same period
MTD Icon –
Green arrow = Target achieved
Red arrow = Target missed
Target vs Actual (MTD)
Formula used:
Actual MTD ÷ Target MTD
- PY MTD – Previous Year Month-to-Date value
- CY vs PY (MTD) – Growth comparison between current and previous year
Year-to-Date (YTD) Metrics
- Actual CY YTD – Current year cumulative value
- Target CY YTD – Target value for the year
- YTD Icon – Performance indicator
- Target vs Actual (YTD) –
Formula: Actual YTD ÷ Target YTD - PY YTD – Previous year YTD value
- CY vs PY (YTD) – Year-over-year comparison
This structure helps management quickly understand performance trends.

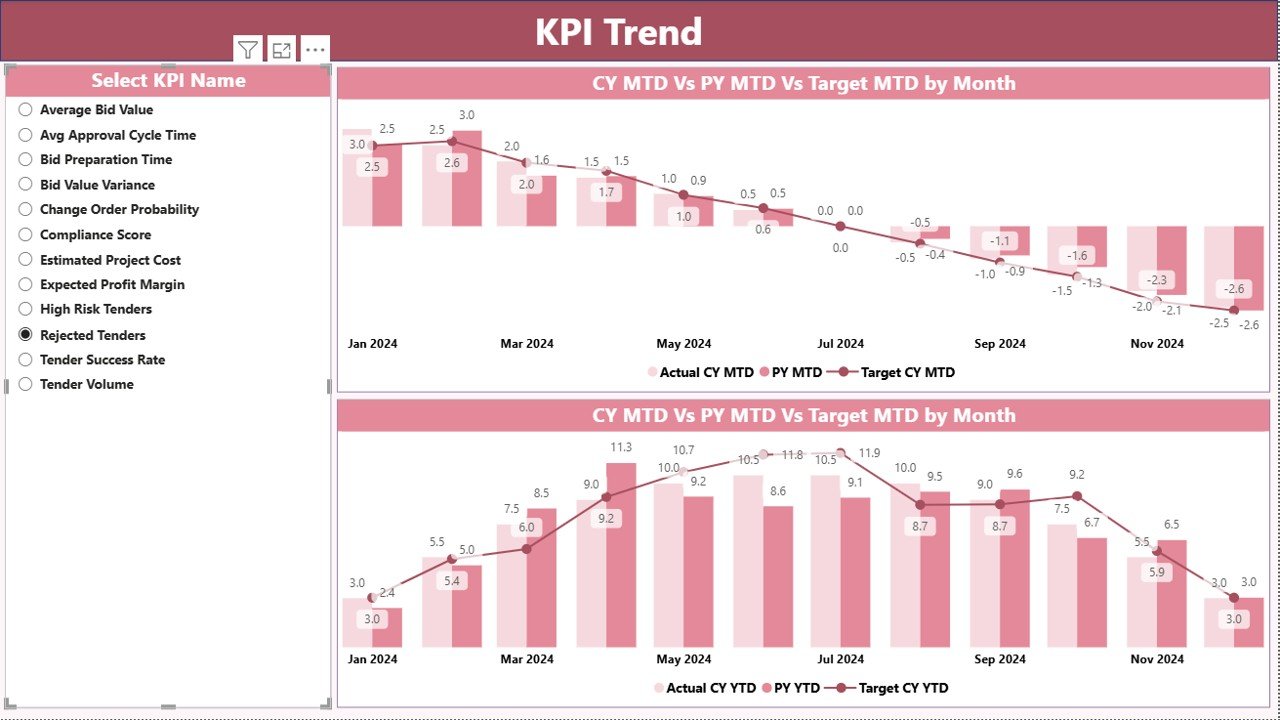
KPI Trend Page – Visual Performance Tracking
The KPI Trend Page focuses on trend analysis using visual charts.
Key Features of KPI Trend Page
Two combo charts for:
MTD performance
YTD performance
Displays:
Current Year Actual
Previous Year Actual
Target Values
KPI Slicer to select a specific KPI
This page helps identify:
- Growth patterns
- Performance drops
- Seasonal trends
- Target achievement consistency
Because visuals tell stories faster, this page plays a critical role during reviews and meetings.
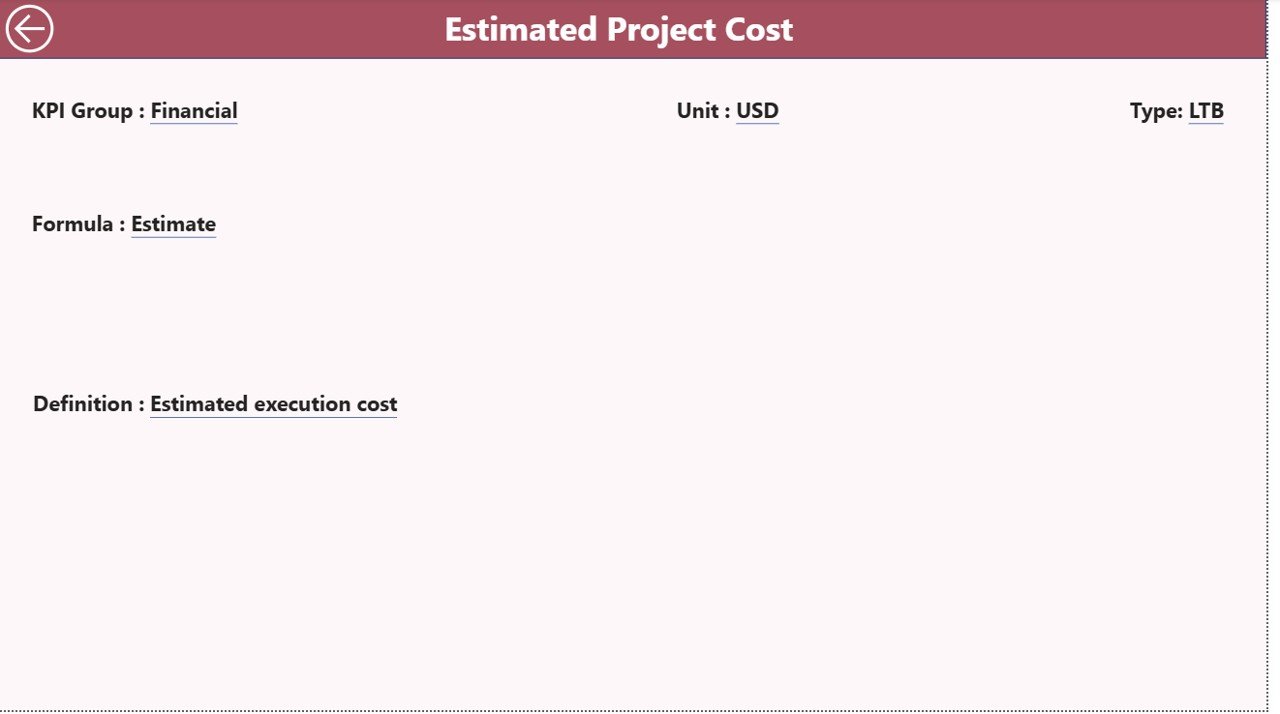
KPI Definition Page – Detailed KPI Explanation
The KPI Definition Page acts as a reference section.
Key Highlights:
- Drill-through enabled from Summary Page
Displays:
KPI Formula
KPI Definition
KPI Type (LTB or UTB)
Hidden from main navigation
- Accessible using a drill-through option
This ensures users always understand how each KPI works.
Excel Data Structure Used in the Dashboard
The dashboard uses an Excel file as its data source, which makes it flexible and easy to maintain.
Input_Actual Sheet
This sheet captures actual performance values.
Columns include:
- KPI Name
- Month (use first date of the month)
- MTD Value
- YTD Value
Input_Target Sheet
This sheet contains planned or target values.
Columns include:
- KPI Name
- Month
- Target MTD
- Target YTD
KPI Definition Sheet
This sheet defines each KPI.
Fields include:
- KPI Number
- KPI Group
- KPI Name
- Unit
- Formula
- Definition
- KPI Type (LTB / UTB)
Once these sheets are updated, Power BI automatically refreshes the visuals.
Advantages of Port Tender KPI Dashboard in Power BI
Centralized Performance Monitoring
You can track all tender KPIs from a single dashboard without switching tools.
Real-Time Insights
Power BI updates visuals instantly when Excel data changes.
Improved Decision-Making
Clear KPIs help managers take quick corrective actions.
Time-Saving Reporting
No more manual report preparation or calculations.
Accurate Target Tracking
Automatic calculations reduce human error.
Easy to Use
Even non-technical users can update data using Excel.
Professional Visualization
Perfect for management reviews and audits.
Best Practices for Using Port Tender KPI Dashboard
Maintain Data Accuracy
Always validate Excel inputs before refreshing the dashboard.
Update Data Regularly
Monthly updates ensure accurate MTD and YTD tracking.
Use Consistent KPI Definitions
Avoid changing KPI logic frequently.
Monitor Trends, Not Just Numbers
Trends help identify long-term issues.
Use Filters Effectively
Apply slicers to analyze specific KPI groups.
Review KPI Performance Periodically
Conduct monthly and quarterly reviews.
Train Users Properly
Ensure users understand KPI meanings and visuals.
Who Should Use This Dashboard?
This dashboard is ideal for:
- Port Authorities
- Logistics Companies
- Tender Management Teams
- Procurement Departments
- Operations Managers
- Performance Analysts
- Government Infrastructure Units
Conclusion
The Port Tender KPI Dashboard in Power BI provides a powerful, structured, and data-driven way to monitor tender performance. It simplifies complex data, improves visibility, and supports better decision-making.
With automated calculations, dynamic visuals, and Excel-based inputs, this dashboard eliminates manual effort while improving accuracy and efficiency. Whether you manage port operations, tender evaluation, or compliance tracking, this dashboard offers complete control over performance metrics.
If you want to improve transparency, efficiency, and accountability in port tender management, this dashboard is the perfect solution.
Frequently Asked Questions (FAQs)
- What is a Port Tender KPI Dashboard?
A Port Tender KPI Dashboard is a Power BI report that tracks and visualizes tender performance using key metrics such as MTD, YTD, targets, and comparisons.
- Can I update data using Excel?
Yes. The dashboard uses Excel as a data source, making updates simple and user-friendly.
- What KPIs can I track?
You can track tender volume, completion rate, compliance metrics, cost performance, and more.
- Does the dashboard support trend analysis?
Yes. It includes MTD and YTD trend charts with current and previous year comparisons.
- Is this dashboard suitable for management reporting?
Absolutely. The dashboard is designed for executive reviews and performance meetings.
- Can I customize KPIs?
Yes. You can easily modify KPIs using the KPI Definition sheet.
- Does it support drill-through analysis?
Yes. Users can drill down from the summary page to view KPI definitions.
Visit our YouTube channel to learn step-by-step video tutorials
Watch the step-by-step video tutorial: