Introduction
The Rehabilitation Homes KPI Dashboard is a powerful and ready-to-use template designed to monitor and manage key performance indicators efficiently. This dashboard helps rehabilitation centers track their monthly and yearly progress towards goals by providing an interactive and insightful overview of multiple KPIs. Whether you are a manager, analyst, or executive, this tool will simplify your data analysis and support strategic decision-making.
Key Features of Rehabilitation Homes KPI Dashboard
- Interactive month selection to dynamically update all KPI data.
- Comprehensive display of MTD (Month-to-Date) and YTD (Year-to-Date) actuals, targets, and previous year figures.
- Conditional formatting with up/down arrows for quick performance assessment against targets and previous year’s data.
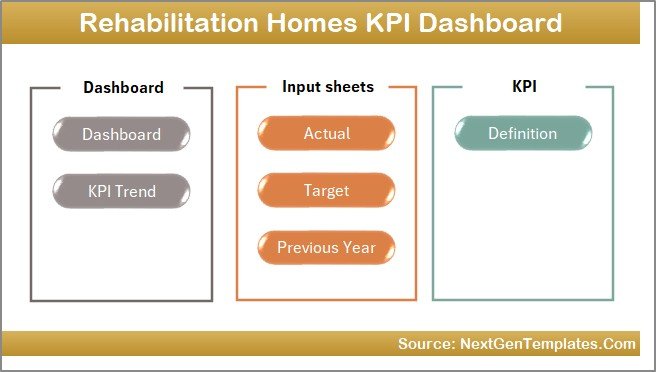
- Seven well-structured worksheets covering data input, KPI definitions, trends, and summarized dashboards.
- Drop-down selections for easy navigation and KPI filtering.
- User-friendly interface with clickable buttons for seamless sheet transitions.
- Visual trend charts for monitoring KPI performance over time.
Dashboard Pages Explanation
1. Home Sheet
This is the primary index page where users can navigate to the six other sheets effortlessly via six intuitive buttons.
 Home Page
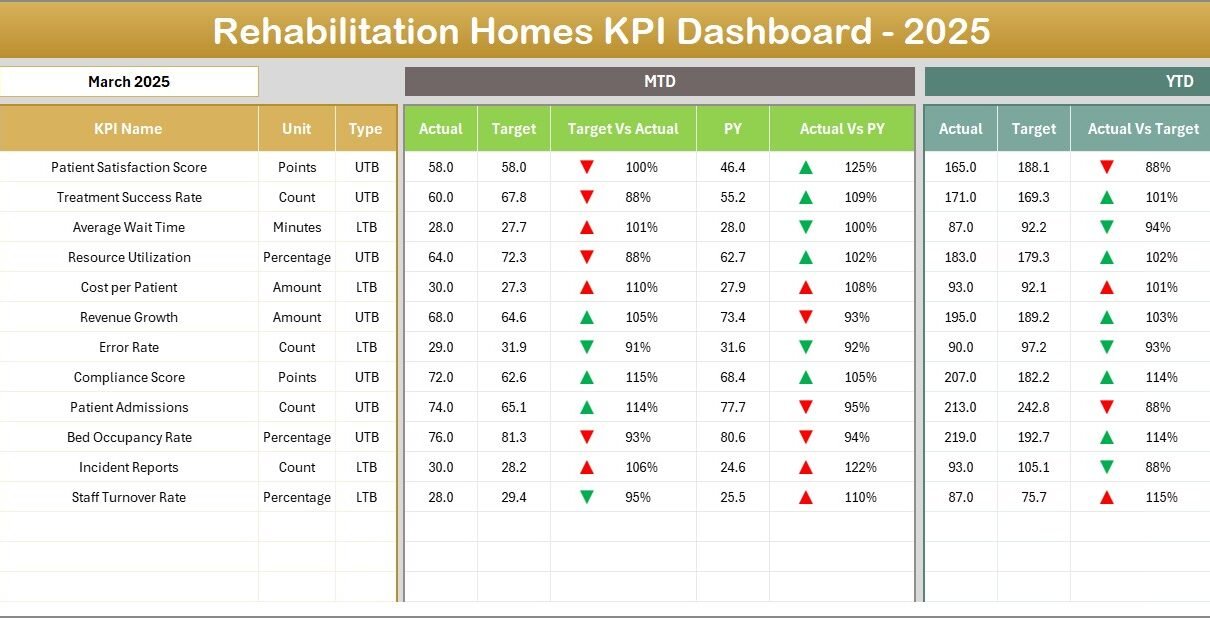
2. Dashboard Sheet
This main dashboard sheet provides an all-encompassing view of every key performance indicator. Users can select the month from a drop-down list located in cell D3, which dynamically updates all the displayed data for that month.
- Displays MTD Actual, Target, and Previous Year data side-by-side.
- Highlights performance differences between Target vs Actual and Previous Year vs Actual using conditional formatting with intuitive up/down arrows.
- Shows YTD summaries parallel to MTD for comprehensive tracking.
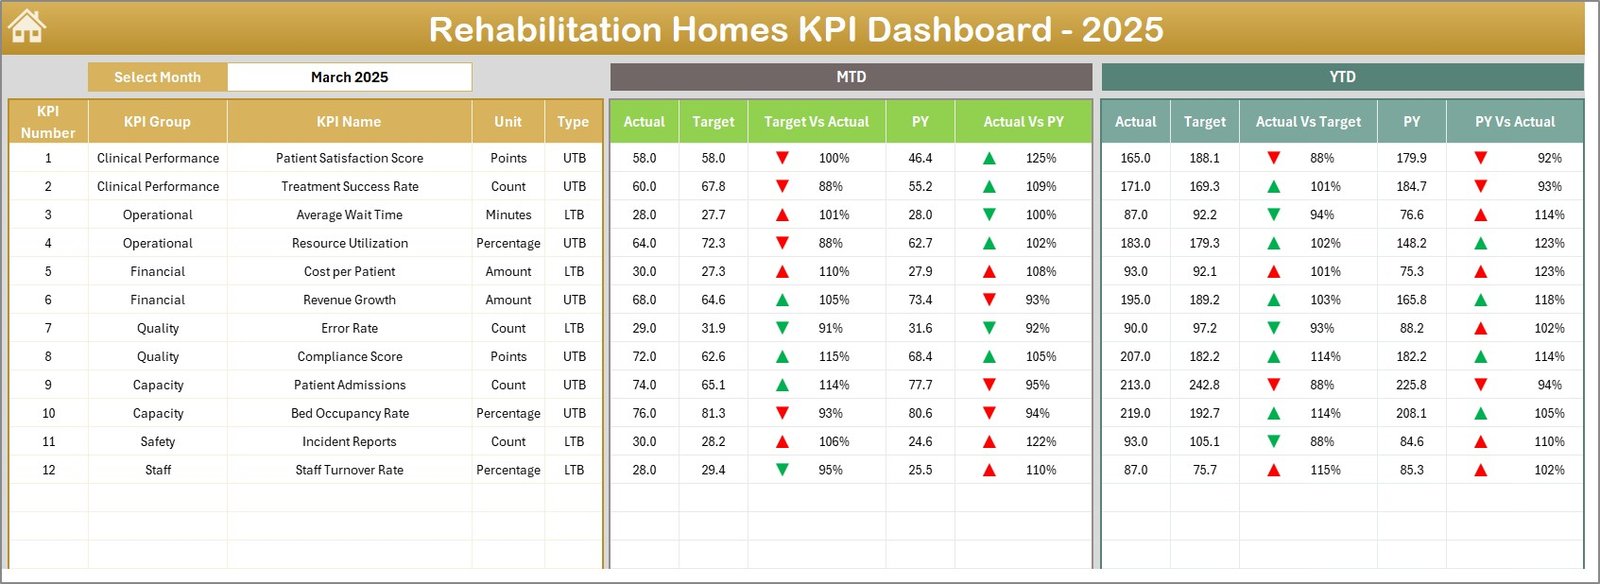 Rehabilitation Homes KPI Dashboard
3. KPI Trend Sheet
This sheet allows you to select a specific KPI from a drop-down menu in cell C3 for deeper analysis. It presents detailed information including KPI Group, Unit, KPI Type (Lower the Better or Upper the Better), Formula, and Definition.
- Displays MTD and YTD trend charts showing Actual, Target, and Previous Year figures.
- Helps users visualize performance trends and target achievements over time.
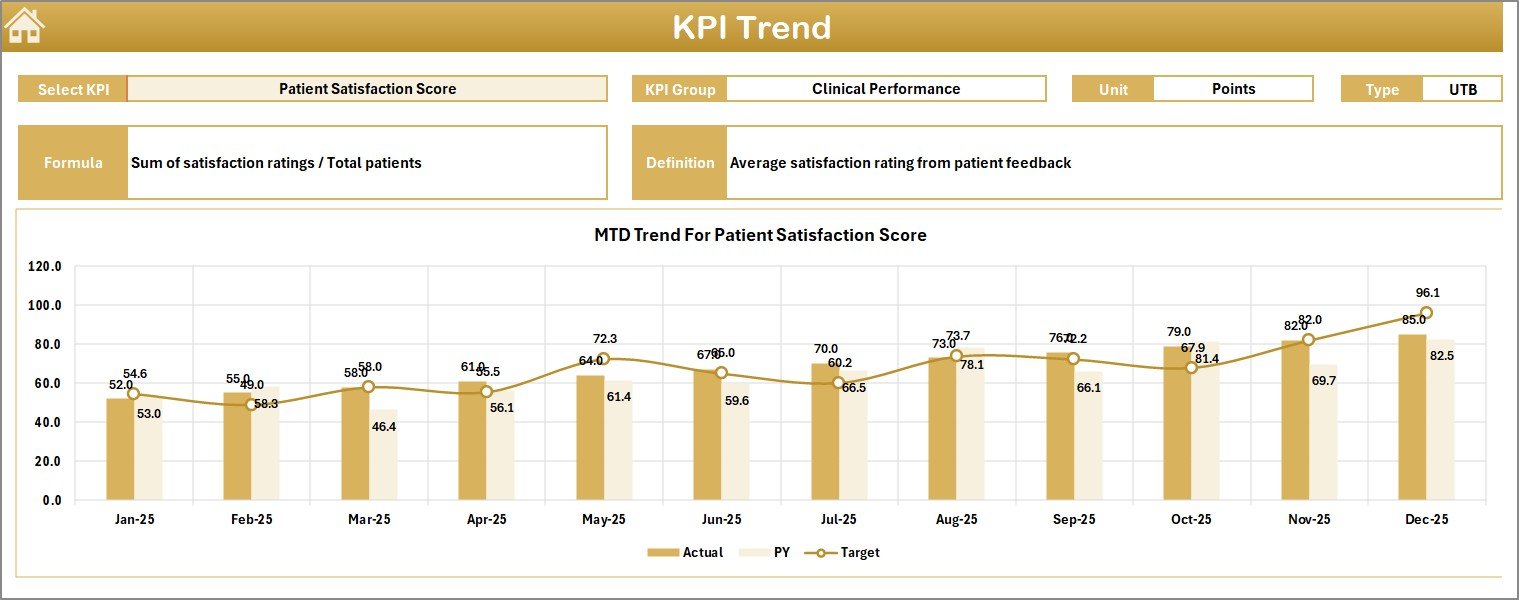 KPI Trend Sheet
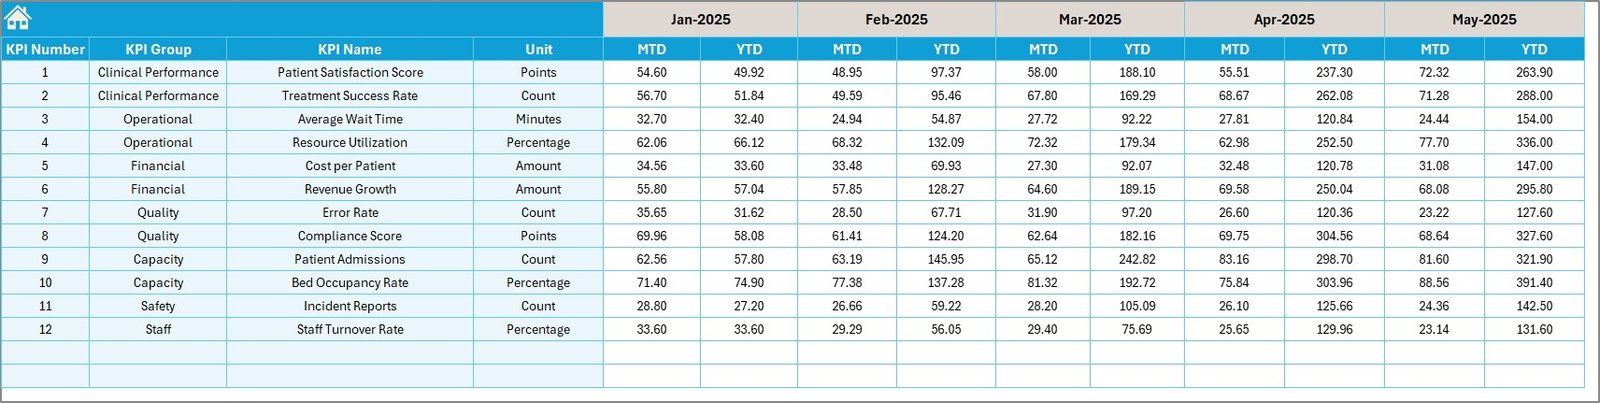
4. Actual Numbers Input Sheet
Enter the actual KPI data for MTD and YTD for each month here. Users can enter the first month of the year in cell E1, which helps align and control the data inputs for subsequent months.
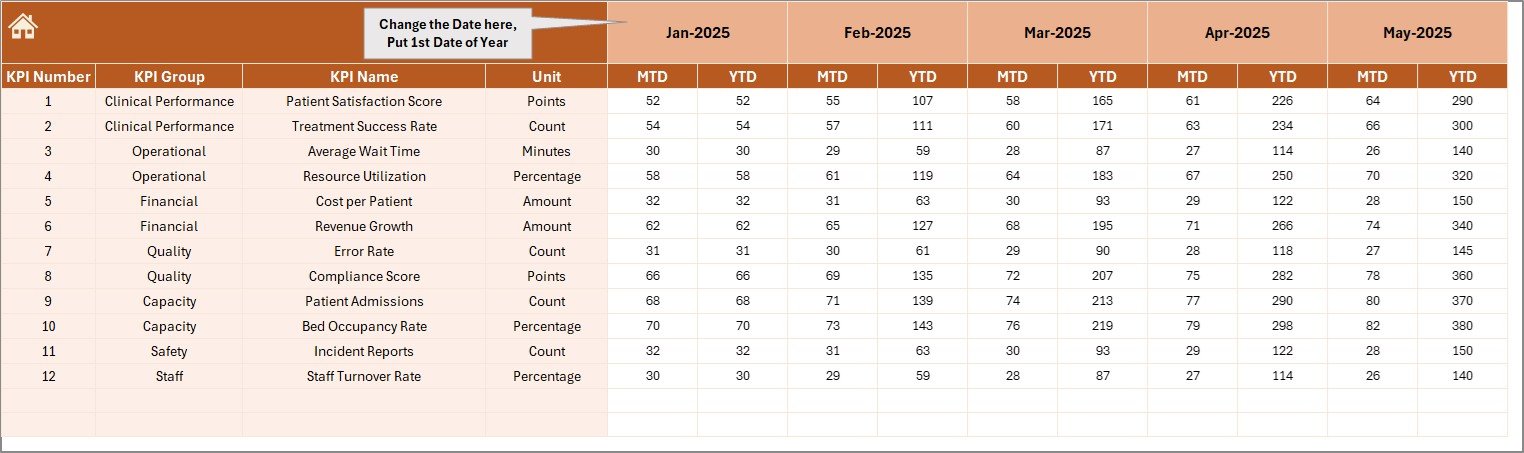 Actual Numbers Input sheet
5. Target Number Input Sheet
This sheet is dedicated to entering monthly and year-to-date target numbers for each KPI, facilitating goal setting and comparison against actual outcomes.
 Target Number Input sheet
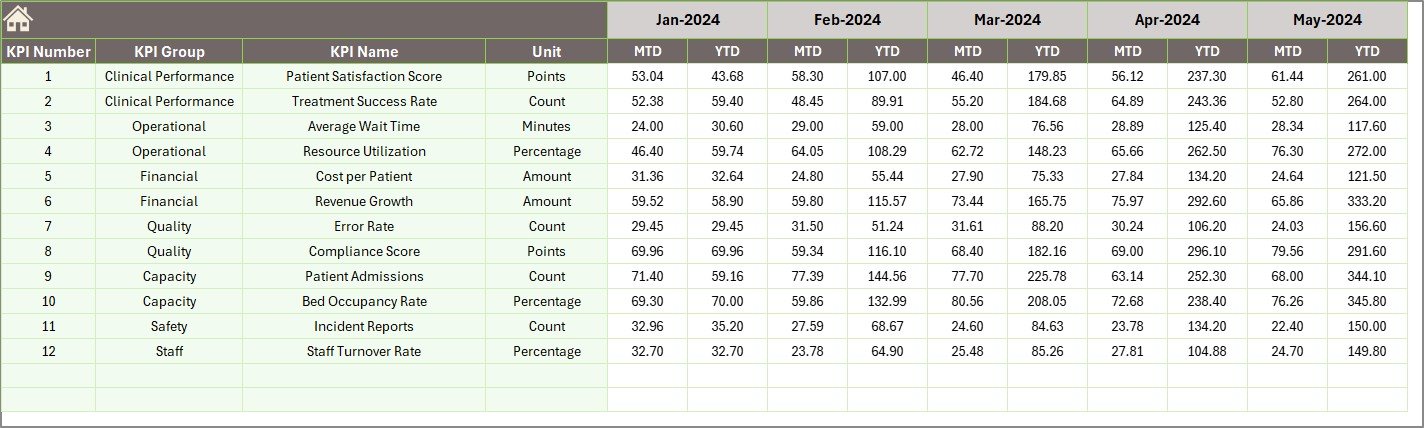
6. Previous Year Number Input Sheet
Input the same data as actual numbers but for the previous year to enable comparative analysis and track performance improvements.
 Previous Year Number Input sheet
7. KPI Definition Sheet
This sheet clarifies each KPI by listing its name, group, unit of measurement, calculation formula, and detailed definition. The last column specifies KPI type as either LTB (Lower the Better) or UTB (Upper the Better).
 KPI Definition sheet
Advantages of Rehabilitation Homes KPI Dashboard
- Data Consolidation: Brings all KPI-related info into a single, easy-to-navigate Excel workbook.
- Dynamic Updates: Drop-down month selection enables seamless and real-time data refresh.
- Visual Signals: Conditional formatting and trend charts make performance highlights instantly visible.
- Customizable: Input sheets allow easy updating of actuals, targets, and definitions tailored to your facility.
- User Friendly: Navigation buttons and dropdowns enhance usability even for non-technical users.
- Performance Insights: Facilitates more informed decision-making by tracking target adherence and year-on-year changes.
Opportunities for Improvement
- Integrate automated data import from hospital management systems to reduce manual data entry.
- Add role-based access control within the workbook for enhanced data security.
- Include customizable alerts for KPIs that deviate significantly from targets.
- Expand visualization options such as heat maps and advanced forecasting tools.
- Implement multi-language support to cater to international users.
Best Practices
Click to Buy Rehabilitation Homes KPI Dashboard in Excel
- Regularly update actual, target, and previous year data for accurate reporting.
- Review KPI definitions periodically to ensure alignment with organizational goals.
- Train team members on how to use the dashboard and interpret visual signals effectively.
- Utilize trend analysis to proactively address potential performance issues.
- Backup the dashboard file frequently to avoid data loss.
FAQs
Click to Buy Rehabilitation Homes KPI Dashboard in Excel
Can I customize the KPIs in this dashboard?
Yes, the KPI Definition sheet lets you add or modify KPIs along with their formulas and parameters.
Is this dashboard compatible with all Excel versions?
It is designed to work with Excel 2010 and above. Some advanced features may require newer versions.
Can multiple users work on this dashboard simultaneously?
The dashboard is primarily for single-user use; however, sharing via OneDrive or SharePoint allows collaboration but may have limitations.
How do I update the previous year’s data?
Input the prior year’s actual numbers in the Previous Year Number Input sheet tab to keep comparisons current.
Conclusion
Click to Buy Rehabilitation Homes KPI Dashboard in Excel
The Rehabilitation Homes KPI Dashboard is an invaluable tool to streamline KPI monitoring, improve data transparency, and empower decision-makers with meaningful insights. Its structured worksheets, interactive elements, and visual cues aid rehabilitation centers in achieving their performance goals effectively.
Leverage this ready-to-use template to unlock smarter tracking and enhanced organizational performance today!
For more detailed walkthroughs and demo videos, visit our YouTube channel.
Click to Buy Rehabilitation Homes KPI Dashboard in Excel