In today’s fast-paced retail environment, having access to real-time data is crucial for making informed decisions. One of the best ways to track key performance indicators (KPIs) and understand your business’s performance is through a Retail Dashboard in Excel. A dashboard enables you to analyze multiple data points at once, visualize trends, and assess various aspects of your retail operations. This guide will walk you through how to create a comprehensive retail dashboard using Excel, covering essential features like charts, cards, slicers, and much more.
What is a Retail Dashboard in Excel?
Click to buy Retail Dashboard in Excel
A Retail Dashboard in Excel is a dynamic and visual tool that helps retail managers track, analyze, and report on different aspects of retail performance. It typically includes various sheets and charts that allow you to explore data related to sales, inventory, customer behavior, store performance, and more. Excel provides the flexibility and power to customize dashboards according to your business needs.
Key Features of a Retail Dashboard
-
Charts: Visual representations of your sales, inventory, and customer data, making it easier to identify trends.
-
Cards: These display key metrics like sales totals, average discounts, and quantities sold.
-
Slicers: These allow users to filter data dynamically, enabling detailed exploration by category, location, or other criteria.
-
Sheets: Multiple sheets dedicated to various aspects of the business, such as sales, performance by product, store analysis, and customer insights.
Overview of the Retail Dashboard in Excel
The Retail Dashboard consists of several sheets that showcase different facets of retail operations. Let’s take a closer look at each sheet, chart, and functionality included in the dashboard.
1. Overview Sheet Tab
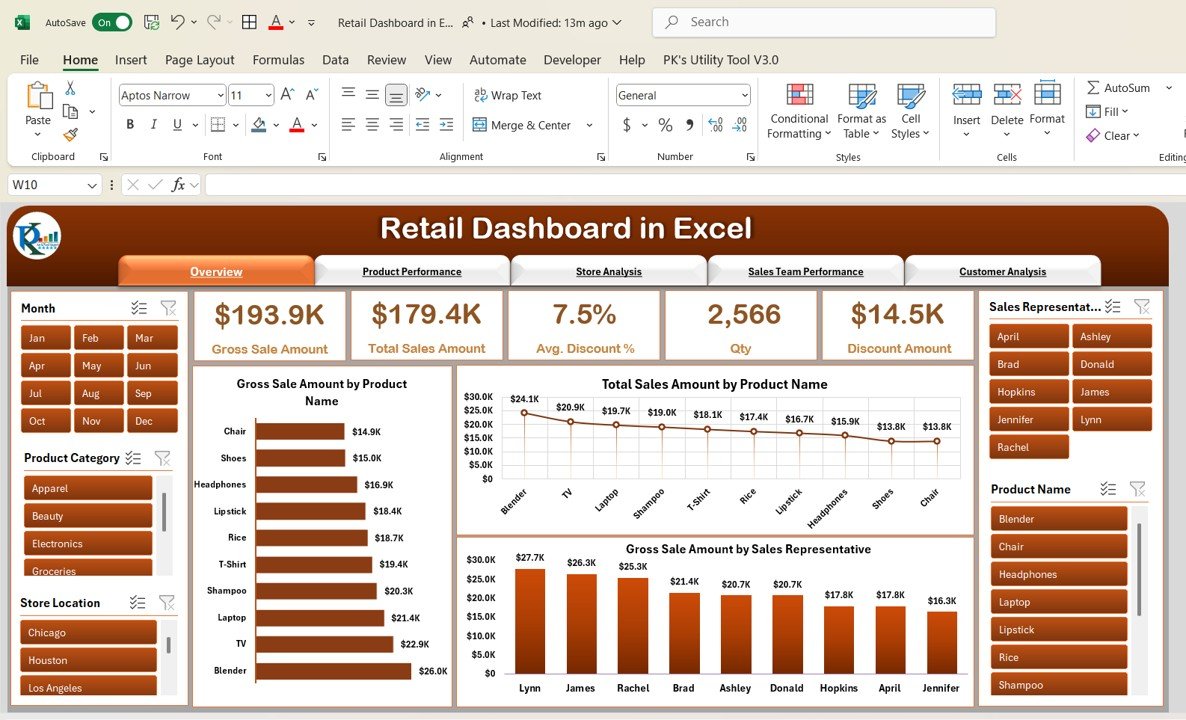
The Overview Sheet provides a snapshot of essential sales data, highlighting key performance indicators that will give you an immediate understanding of how your business is performing.
Key Metrics Displayed as Cards:
-
Gross Sale Amount: Total value of products sold.
-
Total Sales Amount: The overall sales revenue generated.
-
Avg. Discount %: Average discount applied on products.
-
Quantity (Qty): Total number of products sold.
-
Discount Amount: Total discount given across all products.
Charts on the Overview Sheet:
-
Gross Sale Amount by Product Name: A bar chart displaying sales performance by individual products.
-
Total Sales Amount by Product Name: A line chart illustrating the total sales trends for each product.
-
Gross Sale Amount by Sales Representative: A column chart comparing the sales performance of each sales representative.
Click to buy Retail Dashboard in Excel
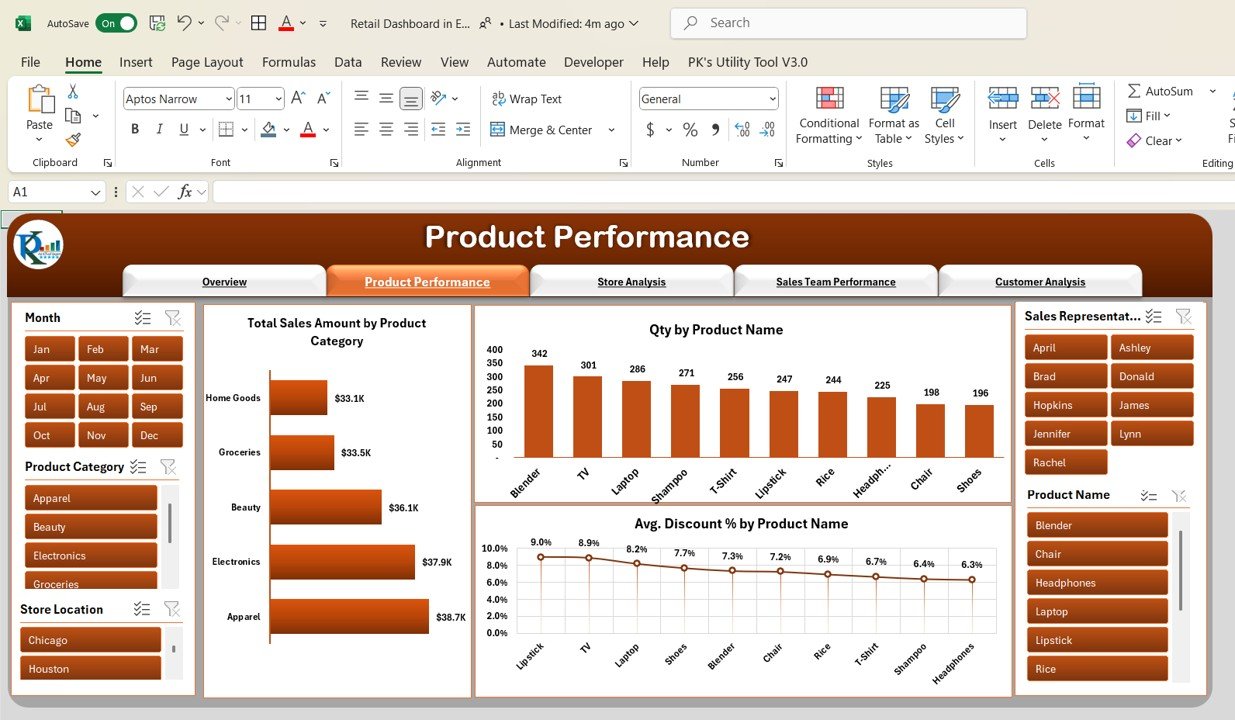
2. Product Performance Sheet Tab
The Product Performance Sheet helps you monitor how different products are performing across the business.
Charts on the Product Performance Sheet:
-
Total Sales Amount by Product Category: A bar chart that shows sales by product categories.
-
Qty by Product Name: A column chart displaying the quantity sold by each product.
-
Avg. Discount % by Product Name: A line chart tracking discount trends by product.
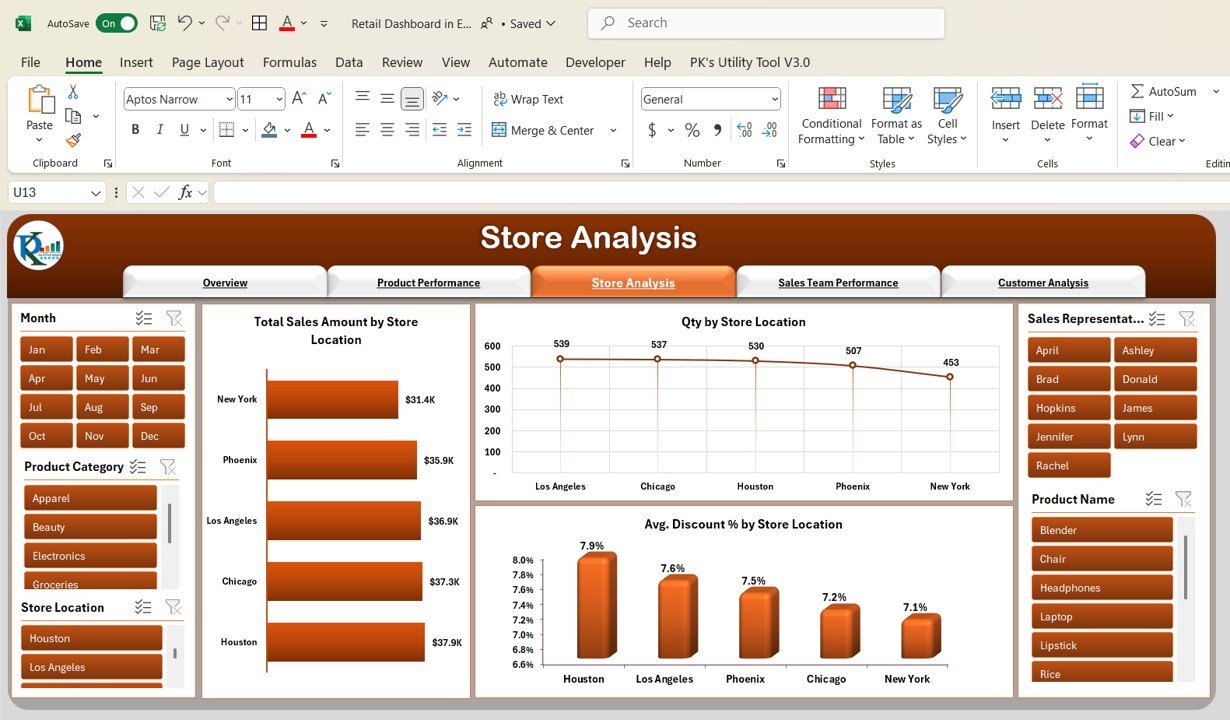
3. Store Analysis Sheet Tab
The Store Analysis Sheet provides insights into store-level performance.
Charts on the Store Analysis Sheet:
-
Total Sales Amount by Store Location: A bar chart showcasing sales performance by store.
-
Qty by Store Location: A line chart showing quantity sold per store location.
-
Avg. Discount % by Store Location: A column chart to assess discount patterns across different stores.
Click to buy Retail Dashboard in Excel
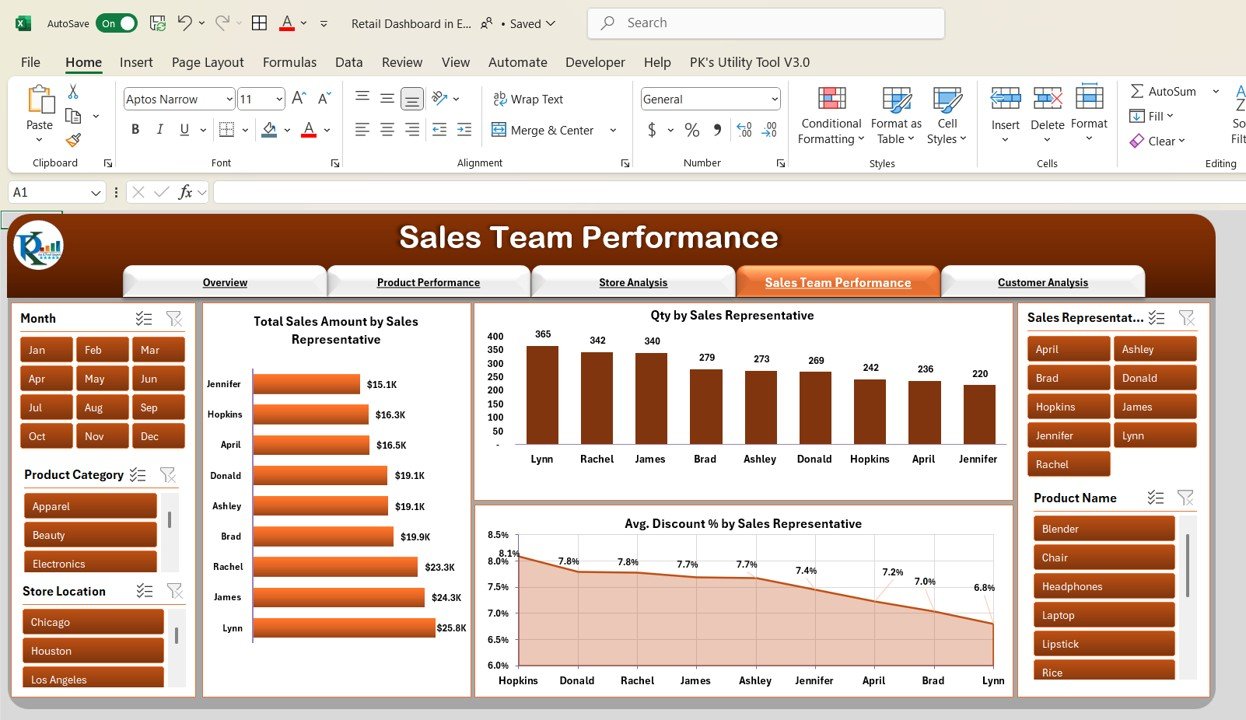
4. Sales Team Performance Sheet Tab
This sheet evaluates the performance of your sales team, helping you identify top performers and areas for improvement.
Charts on the Sales Team Performance Sheet:
-
Total Sales Amount by Sales Representative: A bar chart tracking total sales by each sales rep.
-
Qty by Sales Representative: A column chart that compares the number of units sold by each rep.
-
Avg. Discount % by Sales Representative: An area chart showing the average discount offered by each sales representative.
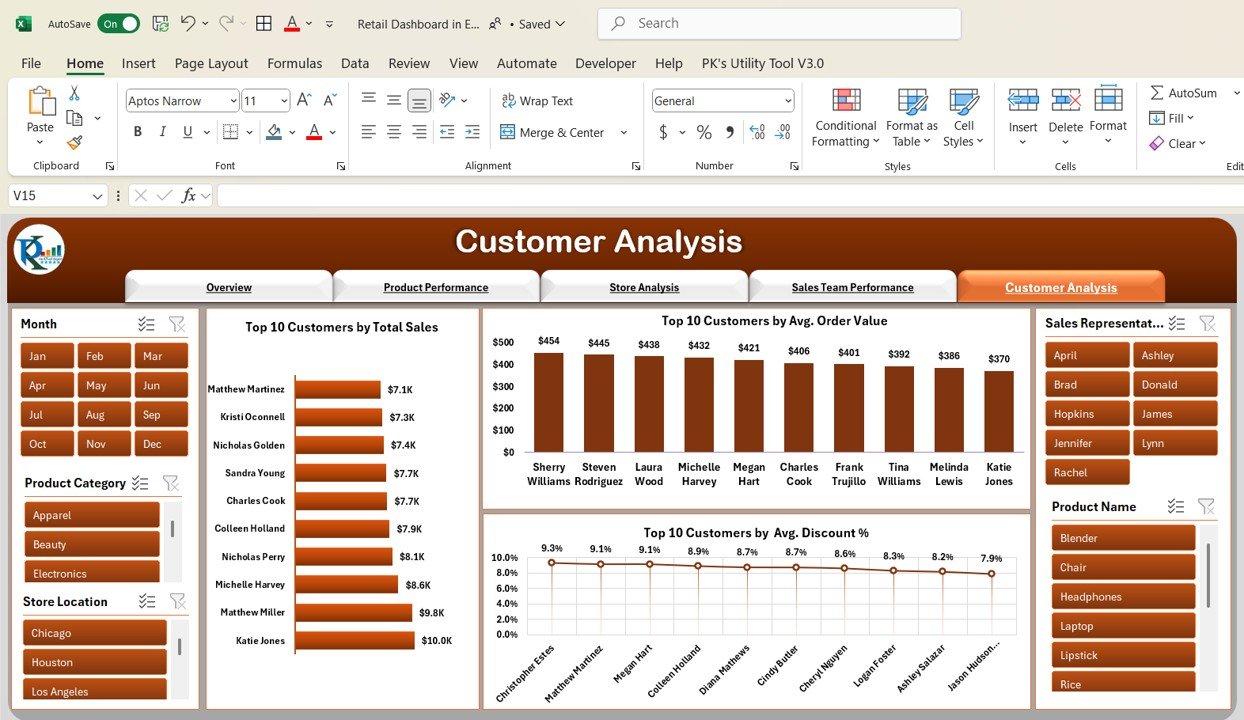
5. Customer Analysis Sheet Tab
The Customer Analysis Sheet enables you to better understand your customer base by highlighting purchasing behavior and sales figures.
Charts on the Customer Analysis Sheet:
-
Top 10 Customers by Total Sales: A bar chart displaying the top 10 customers ranked by total sales.
-
Top 10 Customers by Avg. Order Value: A column chart comparing average order value for the top 10 customers.
-
Top 10 Customers by Avg. Discount %: A line chart showing the average discount provided to the top 10 customers.
Click to buy Retail Dashboard in Excel
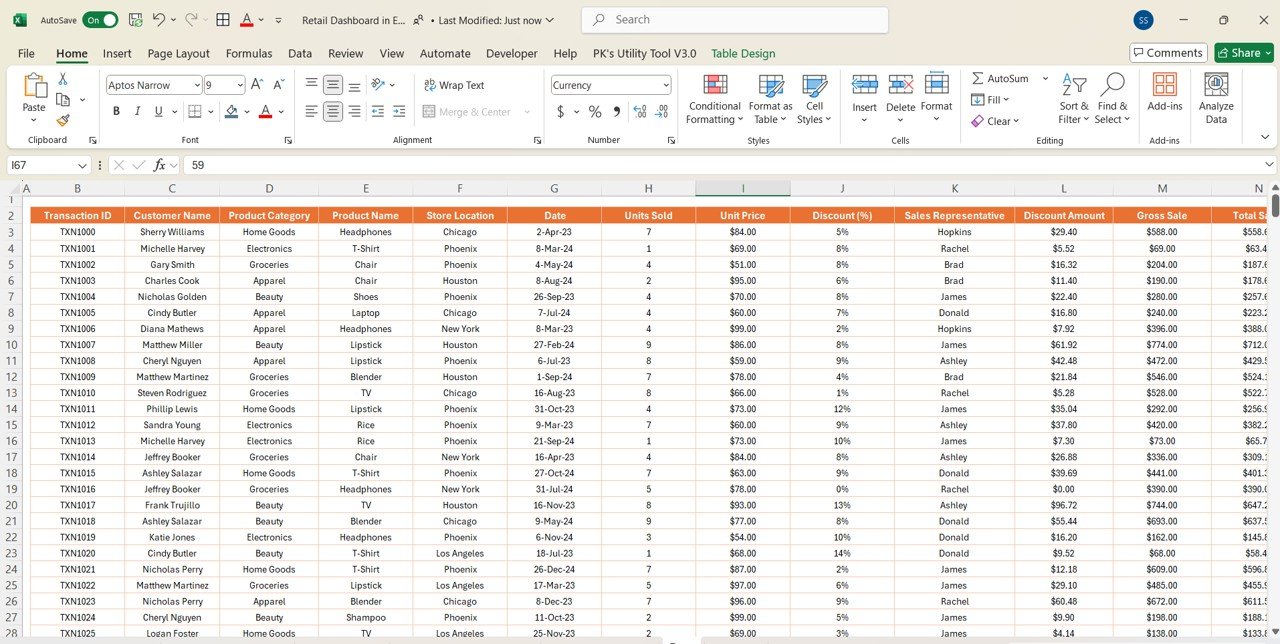
6. Data Sheet Tab
The Data Sheet serves as the input tab where all transactional data is recorded. This is where you enter information for each sale, including:
Advantages of Using a Retail Dashboard in Excel
A Retail Dashboard offers several benefits that make it an essential tool for retail businesses. Some of the major advantages include:
- Quick and Easy Data Analysis: Dashboards provide a consolidated view of all essential data, allowing retail managers to analyze key performance metrics quickly.
- Real-time Tracking: Retail dashboards allow real-time updates, helping businesses make quick adjustments and decisions.
- Improved Decision Making: Visual data representations, such as charts and graphs, help users make data-driven decisions without relying on spreadsheets alone.
- Increased Productivity: Automating data collection and reporting saves time and allows teams to focus on high-value tasks.
- Enhanced Customer Insights: With customer analysis features, businesses can identify trends and preferences, allowing them to tailor their offerings better.
Opportunities for Improvement in Retail Dashboards
Click to buy Retail Dashboard in Excel
While Retail Dashboards in Excel are highly useful, there are several opportunities for improvement to make them even more effective:
- Integration with Other Systems: Integrating the dashboard with point-of-sale (POS) systems or customer relationship management (CRM) platforms can automate data entry, ensuring real-time updates and reducing errors.
- Advanced Data Analysis Features: Incorporating features such as predictive analytics, machine learning algorithms, or more granular segmentation of data can provide deeper insights.
- Mobile Optimization: Many businesses are moving toward mobile-based solutions, so optimizing the dashboard for mobile use can help retail managers stay updated on the go.
- Customizability: Offering more options for dashboard customization based on different retail sectors or business sizes can help make dashboards more relevant to specific business needs.
Best Practices for Retail Dashboards in Excel
To maximize the effectiveness of your Retail Dashboard, consider following these best practices:
- Keep It Simple and Clean: Focus on the most relevant metrics and avoid cluttering the dashboard with unnecessary information.
- Use Clear Visuals: Choose chart types that are easy to understand. Use color coding to highlight key data and trends.
- Update Data Regularly: Ensure that data is updated frequently, especially if you are dealing with real-time sales data.
- Include Interactive Filters: Utilize slicers and filters to allow users to explore the data in more detail.
- Set Alerts and Notifications: Incorporate alerts for underperforming areas, such as low sales or high discounts, so that corrective actions can be taken promptly.
Click to buy Retail Dashboard in Excel
Frequently Asked Questions (FAQs)
1. What is a Retail Dashboard in Excel?
A Retail Dashboard in Excel is a visual tool used to track and analyze key retail metrics, such as sales, inventory, and customer behavior. It displays data in charts, tables, and cards for easy monitoring and decision-making.
2. Can I customize my Retail Dashboard?
Yes, Excel allows you to fully customize your Retail Dashboard, including the charts, tables, and slicers, to fit your specific business needs.
3. How do I update my Retail Dashboard data?
You can update your dashboard by adding new data into the data sheet. Once you update the data, the dashboard will automatically reflect the new information.
4. Can I use a Retail Dashboard for multiple stores?
Absolutely! The Retail Dashboard can be configured to track performance for multiple stores by adding location-based filters or including separate sheets for each store.
5. What other tools can I use alongside Excel for Retail Dashboards?
In addition to Excel, tools like Power BI, Tableau, or Google Data Studio can be used to create even more advanced retail dashboards with integration capabilities.
Visit our YouTube channel to learn step-by-step video tutorials
Watch the step-by-step video tutorial:
Click to buy Retail Dashboard in Excel