Ensuring workplace safety and regulatory compliance is crucial for organizations to protect employees, avoid penalties, and maintain operational efficiency. The Safety and Compliance Dashboard in Power BI is a ready-to-use tool designed to track incidents, monitor resolution progress, and analyze compliance metrics across departments and personnel.
In this article, we will explain the key features, advantages, best practices, and use cases of this dashboard.
What Is a Safety and Compliance Dashboard?
A Safety and Compliance Dashboard is a data visualization tool that consolidates safety incidents and compliance metrics into an interactive dashboard. It helps safety officers, HR teams, and compliance managers:
-
Track incidents in real time
-
Monitor resolution times and pending cases
-
Analyze trends by incident type, severity, and department
-
Identify high-risk areas and personnel for corrective actions
Power BI allows this data to be visualized with cards, charts, and detailed tables, making it easier to interpret and act upon.
Key Features of the Safety and Compliance Dashboard
Click to Buy Safety and Compliance Dashboard in Power BI
The dashboard includes multiple pages, each providing unique insights:
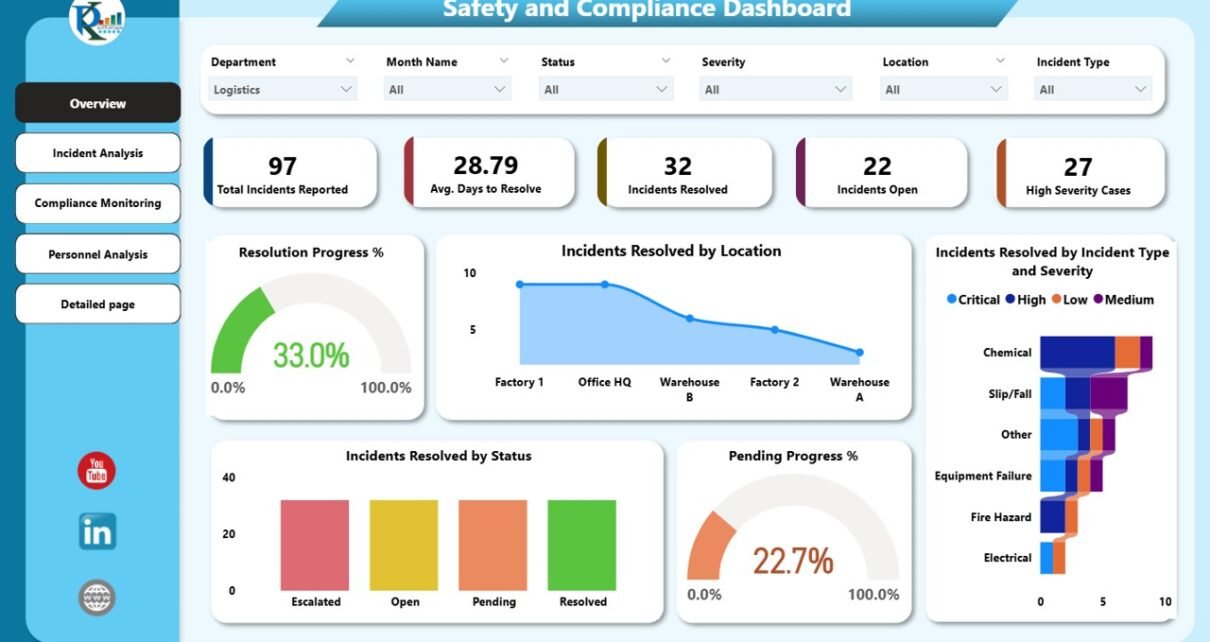
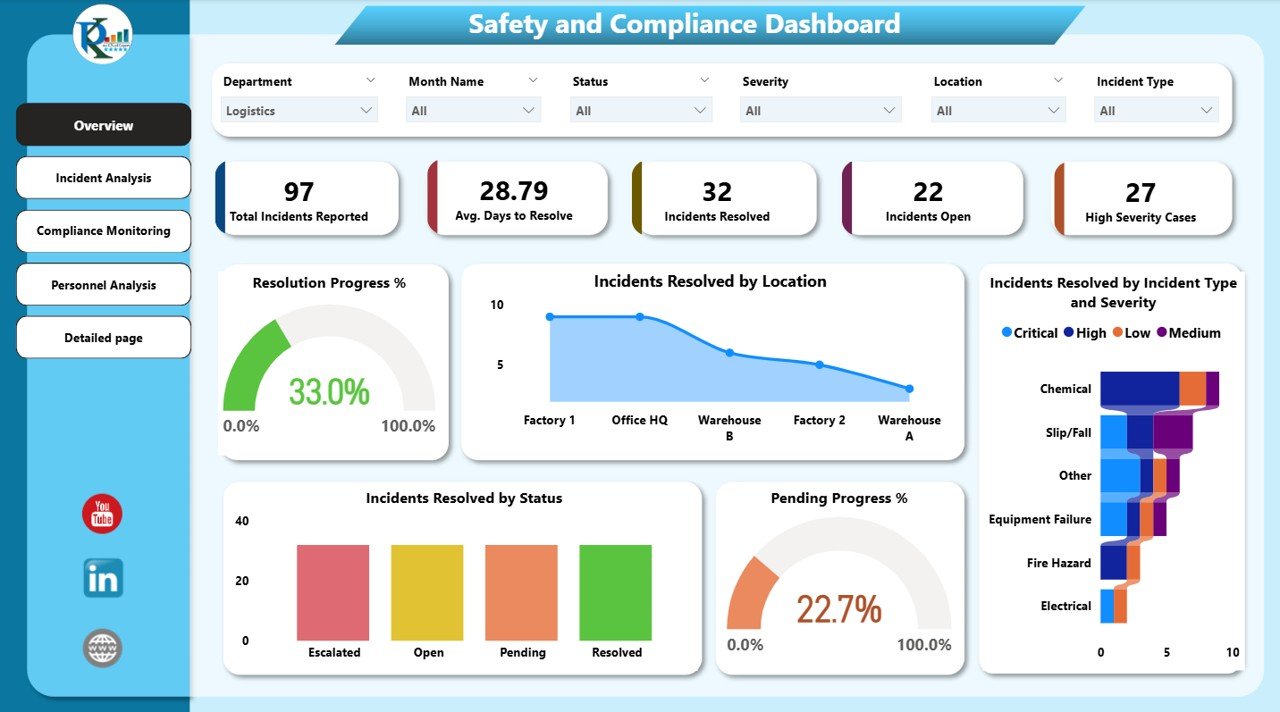
1. Overview Page
The Overview Page gives a high-level summary of all incidents and compliance metrics.
Cards:
-
Total Incidents Reported – Total number of reported incidents
-
Average Days to Resolve – Time taken to resolve incidents
-
Incidents Resolved – Total resolved cases
-
Incidents Open – Number of pending incidents
-
High Severity Cases – Count of critical incidents
Charts:
-
Resolution Progress % – Percentage of incidents resolved over time
-
Incidents Resolved by Location – Shows performance across different sites
-
Incidents Resolved by Status – Tracks resolved, pending, or open incidents
-
Pending Progress % – Highlights unresolved cases
-
Incidents Resolved by Incident Type and Severity – Breaks down incidents for detailed analysis
Click to Buy Safety and Compliance Dashboard in Power BI
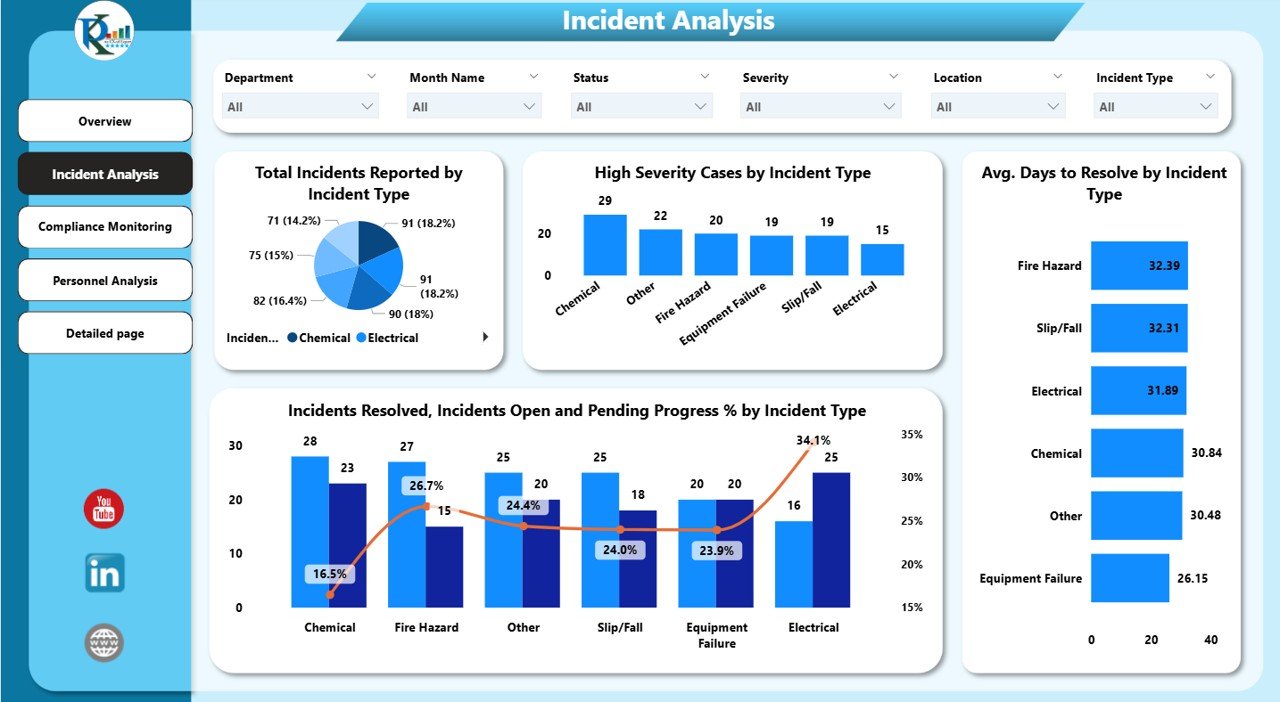
2. Incident Analysis Page
This page provides in-depth analysis of incident types and trends.
Charts:
-
Total Incidents Reported by Incident Type – Identifies most common incidents
-
High Severity Cases by Incident Type – Highlights critical incidents requiring immediate action
-
Incidents Resolved, Open, and Pending % by Incident Type – Measures efficiency by incident category
-
Average Days to Resolve by Incident Type – Tracks response time per type
This helps organizations prioritize resources and preventive measures.
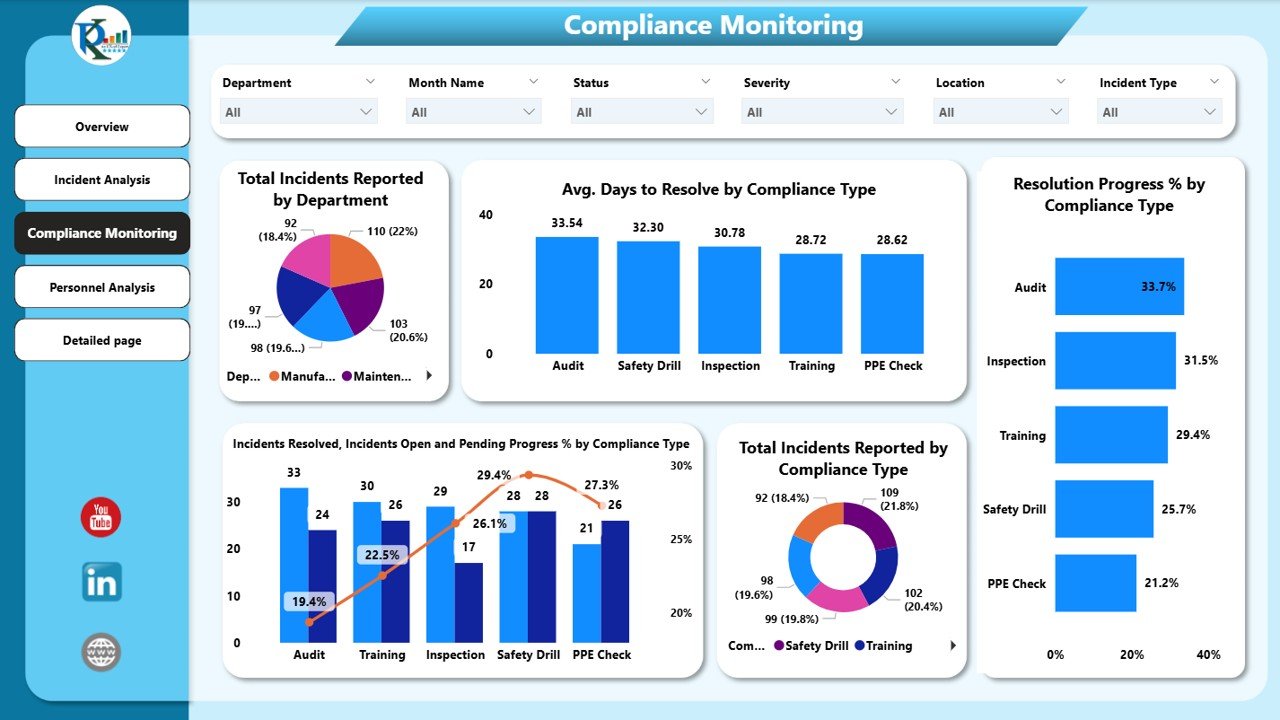
3. Compliance Monitoring Page
The Compliance Monitoring Page evaluates adherence to regulations and internal policies.
Charts:
-
Total Incidents Reported by Department – Department-wise incident tracking
-
Average Days to Resolve by Compliance Type – Measures effectiveness of compliance processes
-
Resolution Progress % by Compliance Type – Monitors compliance resolution trends
-
Incidents Resolved, Open, and Pending % by Compliance Type – Departmental performance insights
-
Total Incidents Reported by Compliance Type – Highlights areas of frequent non-compliance
Click to Buy Safety and Compliance Dashboard in Power BI
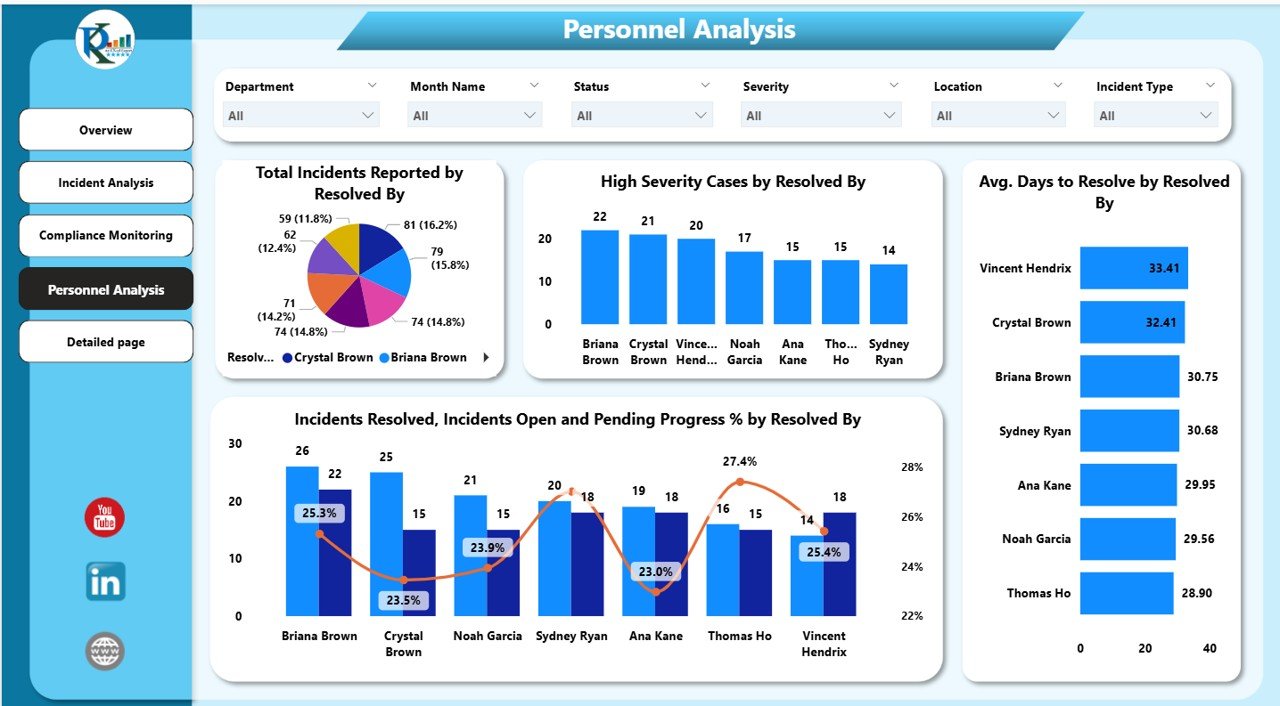
4. Personnel Analysis Page
This page tracks incidents based on personnel responsible for resolving them.
Charts:
-
Total Incidents Reported by Resolved By – Measures individual performance
-
High Severity Cases by Resolved By – Highlights personnel handling critical cases
-
Average Days to Resolve by Resolved By – Evaluates response efficiency
-
Incidents Resolved, Open, and Pending % by Resolved By – Tracks workload and resolution performance’
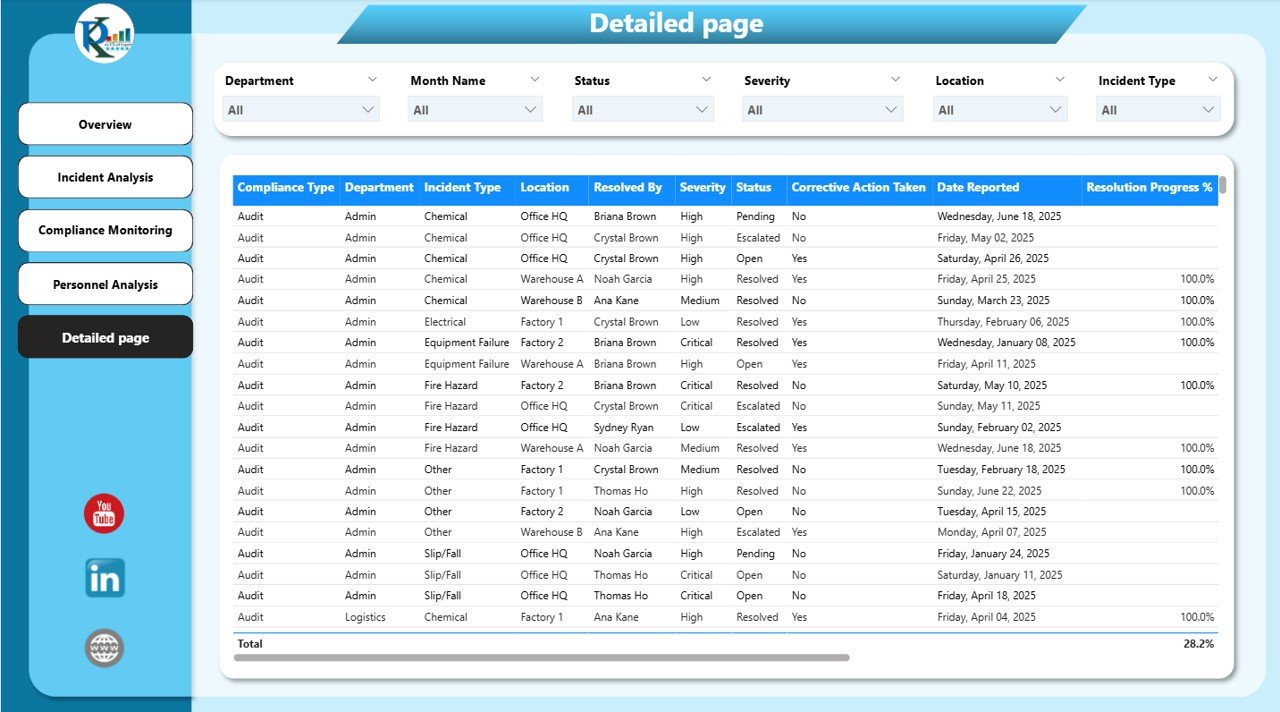
5. Detailed Page
The Detailed Page provides a granular view of incidents.
Features:
-
Tables – Detailed incident records including type, severity, department, assigned personnel, and resolution status
-
Charts – Visual representations for deeper analysis
This page is useful for compliance reporting, audits, and operational reviews.
Click to Buy Safety and Compliance Dashboard in Power BI
Advantages of Using a Safety and Compliance Dashboard
-
Real-Time Monitoring: Track incidents and compliance metrics instantly
-
Data-Driven Decisions: Identify high-risk areas and prioritize actions
-
Improved Compliance: Monitor adherence to regulations and internal policies
-
Enhanced Safety Performance: Reduce workplace accidents through timely insights
-
Personnel Accountability: Track individual performance and workload distribution
-
Trend Analysis: Understand patterns in incidents and compliance over time
Best Practices for Using the Dashboard
-
Regularly Update Data: Ensure all incidents and compliance metrics are entered promptly
-
Segment by Department and Incident Type: Analyze trends across different categories
-
Monitor Resolution Times: Focus on high-severity and overdue incidents
-
Use Conditional Formatting: Highlight critical or unresolved cases for quick action
-
Review Trends Monthly: Use charts and tables to identify recurring issues and implement preventive measures
-
Share Insights: Provide dashboards to management and safety teams to promote accountability
How the Dashboard Helps Organizations
Click to Buy Safety and Compliance Dashboard in Power BI
-
Enhances Workplace Safety: Identify hazards and mitigate risks proactively
-
Supports Regulatory Compliance: Ensure adherence to safety standards and regulations
-
Optimizes Resource Allocation: Assign personnel efficiently to resolve incidents
-
Improves Reporting: Generate detailed reports for audits and management reviews
-
Boosts Employee Confidence: Demonstrate commitment to a safe and compliant workplace
Frequently Asked Questions (FAQs)
Q1: Can I customize the KPIs in the dashboard?
Yes, you can add, remove, or adjust KPIs based on your organization’s safety and compliance requirements.
Q2: How often should the data be updated?
Ideally, update the data daily or weekly, depending on incident reporting frequency.
Q3: Can I track incidents by severity and department simultaneously?
Yes, Power BI slicers and filters allow multi-dimensional analysis.
Q4: Is this dashboard suitable for large organizations with multiple sites?
Absolutely. You can segment by location, department, or personnel for detailed insights.
Q5: Can this dashboard be used for compliance audits?
Yes, the Detailed Page and visual charts make it ideal for audit reporting and management review.
Conclusion
Click to Buy Safety and Compliance Dashboard in Power BI
The Safety and Compliance Dashboard in Power BI provides a comprehensive, interactive solution to monitor workplace safety and compliance. With real-time metrics, incident analysis, and personnel tracking, organizations can make informed decisions, ensure regulatory adherence, and enhance overall safety performance.
Visit our YouTube channel to learn step-by-step video tutorials
Watch the step-by-step video Demo:
Click to Buy Safety and Compliance Dashboard in Power BI