Understanding the sales process is crucial for improving conversion rates and optimizing sales strategies. The Sales Funnel Dashboard in Excel provides a comprehensive tool to track leads, opportunities, conversions, and performance across various sales stages. This ready-to-use dashboard is designed to help sales teams manage their sales funnel, monitor conversion rates, and make data-driven decisions to boost sales performance.
What is the Sales Funnel Dashboard in Excel?
The Sales Funnel Dashboard in Excel is an interactive and visual tool designed to help businesses manage and analyze their sales process. The dashboard provides key insights into various sales funnel stages, such as lead generation, opportunities, conversions, and closed deals. By using this dashboard, sales managers and teams can track key metrics like conversion rates, lead sources, and sales performance, making it easier to identify bottlenecks and optimize the sales process.
Key Features of the Sales Funnel Dashboard
The Sales Funnel Dashboard includes multiple sheets and charts, each focusing on different aspects of the sales funnel process. Here are the key features of each sheet:
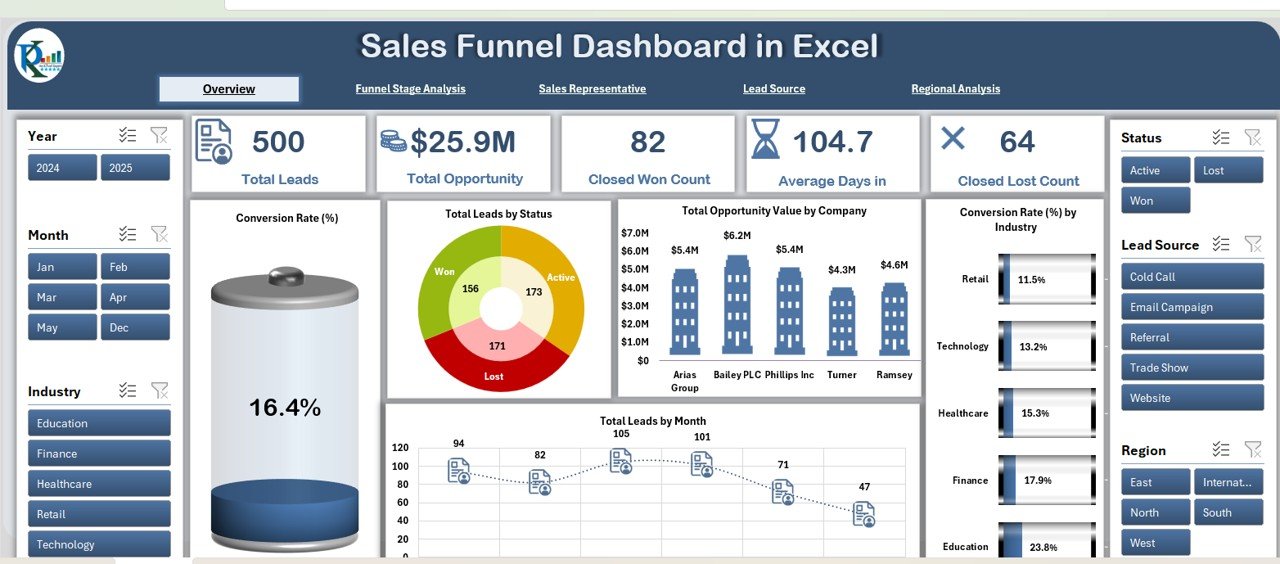
1. Overview Sheet Tab
The Overview sheet provides a high-level summary of your sales funnel performance. Key components include:
Cards:
- Total Leads: Displays the total number of leads generated.
- Total Opportunity Value: Shows the total value of opportunities in the funnel.
- Closed Won Count: Tracks the number of deals closed successfully.
- Average Days in Funnel: Displays the average number of days leads spend in the sales funnel.
- Closed Lost Count: Tracks the number of deals lost.
Charts:
- Conversion Rate (%): Shows the overall conversion rate across all leads.
- Total Leads by Status: Displays the breakdown of leads based on their current status (e.g., New, In Progress, Qualified).
- Total Opportunity Value by Company: Visualizes the total opportunity value by company.
- Conversion Rate (%) by Industry: Shows the conversion rate segmented by industry.
- Total Leads by Month: Tracks the number of leads generated each month.
Click to buy Sales Funnel Dashboard in Excel
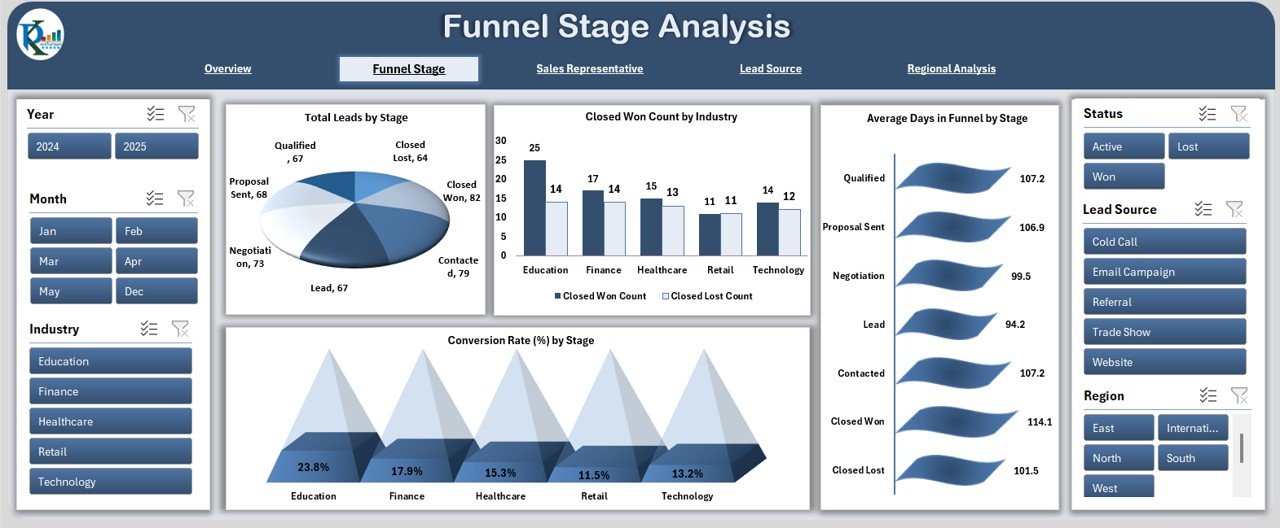
2. Funnel Stage Analysis Sheet Tab
The Funnel Stage Analysis page tracks performance at each stage of the sales funnel:
Charts:
- Total Leads by Stage: Displays the number of leads at each stage of the funnel (e.g., Initial Contact, Negotiation, Closing).
- Closed Won Count by Industry: Visualizes the number of deals won by industry.
- Average Days in Funnel by Stage: Shows how long leads stay at each stage of the funnel on average.
- Conversion Rate (%) by Stage: Tracks conversion rates at each stage of the funnel.
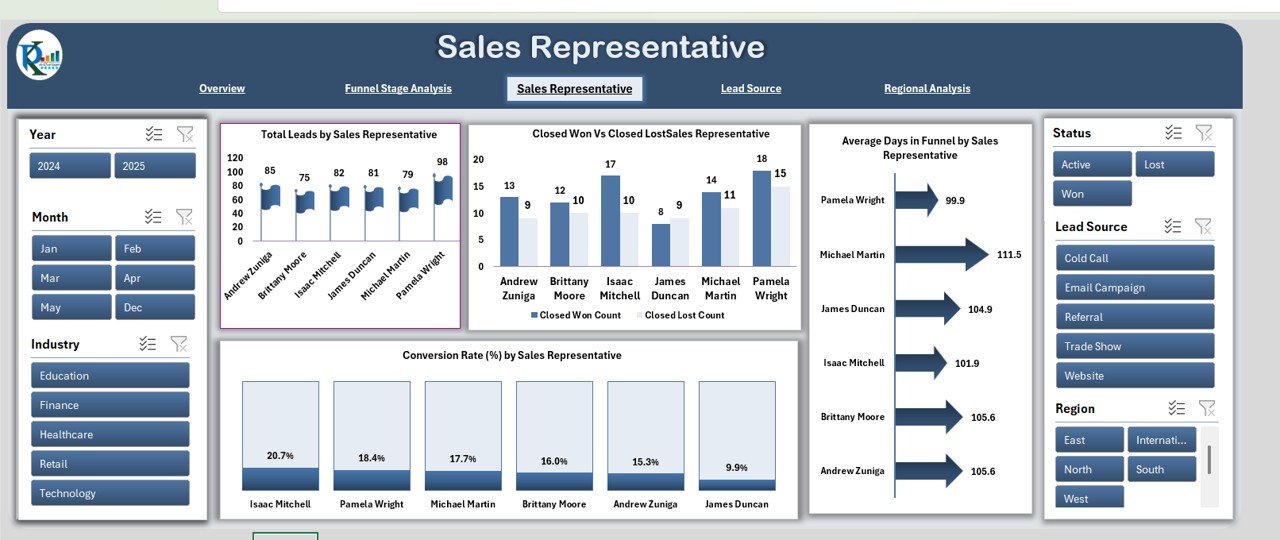
3. Sales Representative Sheet Tab
The Sales Representative sheet tracks the performance of individual sales reps:
- Charts:
- Total Leads by Sales Representative: Displays the number of leads handled by each sales rep.
- Closed Won vs. Closed Lost by Sales Representative: Compares the number of deals won vs lost by each sales rep.
- Average Days in Funnel by Sales Representative: Shows the average number of days leads spend in the funnel for each sales rep.
- Conversion Rate (%) by Sales Representative: Displays the conversion rate for each sales rep.
Click to buy Sales Funnel Dashboard in Excel
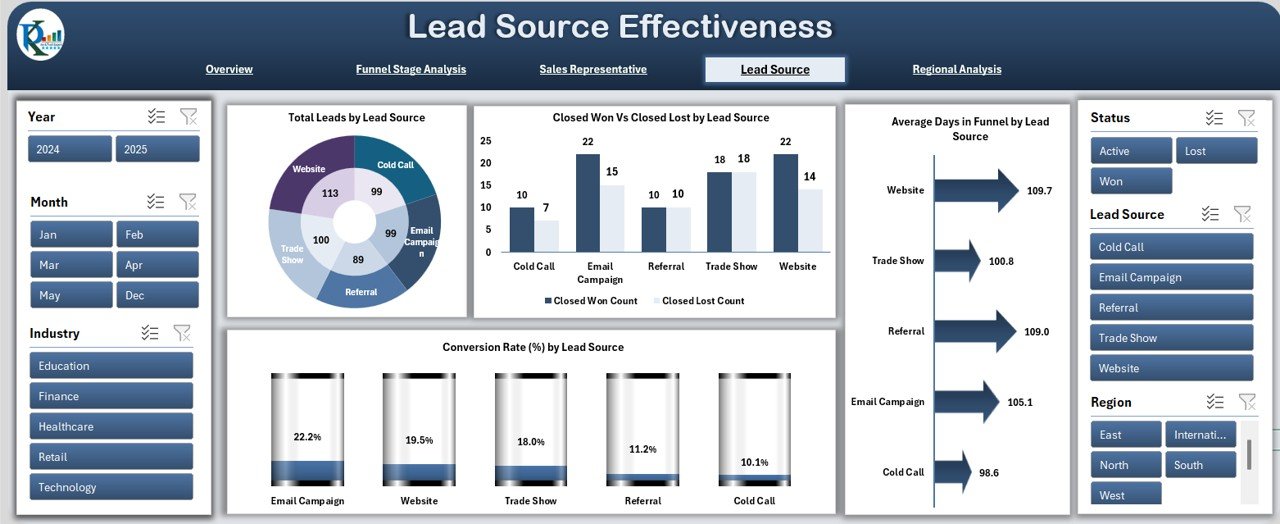
4. Lead Source Effectiveness Sheet Tab
The Lead Source Effectiveness sheet evaluates the performance of various lead sources:
Charts:
- Total Leads by Lead Source: Tracks the total number of leads generated by each lead source (e.g., website, social media, referrals).
- Closed Won vs. Closed Lost by Lead Source: Compares the number of deals won vs lost by lead source.
- Average Days in Funnel by Lead Source: Displays the average number of days leads from each source spend in the funnel.
- Conversion Rate (%) by Lead Source: Shows the conversion rate for each lead source.
5. Regional Analysis Sheet Tab
The Regional Analysis sheet helps evaluate sales performance by region:
Charts:
- Total Leads by Region: Displays the total number of leads generated by region.
- Closed Won vs. Closed Lost by Region: Compares the number of deals won vs lost by region.
- Average Days in Funnel by Region: Tracks the average time leads from each region spend in the funnel.
- Conversion Rate (%) by Region: Shows the conversion rate by region.

Click to buy Sales Funnel Dashboard in Excel
6. Data Sheet Tab
The Data Sheet is where you enter the detailed information for each lead and opportunity:
Benefits of Using the Sales Funnel Dashboard
-
Improved Decision-Making: The dashboard provides key insights into sales performance, allowing sales teams to make data-driven decisions.
-
Visual Performance Tracking: With charts and visualizations, the dashboard makes it easy to monitor sales performance and identify bottlenecks in the sales process.
-
Agent Performance Monitoring: Track individual sales rep performance to identify top performers and areas for improvement.
-
Lead Source Evaluation: Analyze the effectiveness of various lead sources and adjust marketing strategies accordingly.
-
Conversion Rate Optimization: By tracking conversion rates across different stages and regions, you can identify areas to optimize your sales process.
Best Practices for Using the Sales Funnel Dashboard
Click to buy Sales Funnel Dashboard in Excel
-
Regular Updates: Ensure that the Data Sheet is regularly updated with the latest lead and opportunity information for accurate tracking.
-
Review KPIs Frequently: Regularly monitor key metrics such as Conversion Rate, Total Leads, and Closed Won Count to stay on top of sales performance.
-
Set Clear Targets: Use the dashboard to set specific performance goals for your sales team, and track progress toward those goals.
-
Segment Data by Region and Source: Analyze leads by Region and Lead Source to tailor your marketing and sales strategies.
-
Monitor Sales Rep Performance: Regularly track the performance of individual sales reps, using the dashboard to identify areas where training or resources are needed.
Conclusion
The Sales Funnel Dashboard in Excel is a powerful tool for sales teams looking to optimize their sales processes, track leads, and improve conversion rates. By using this dashboard, you can monitor the sales pipeline, evaluate agent performance, and assess the effectiveness of lead sources, ultimately leading to higher sales and greater business success.
Frequently Asked Questions (FAQs)
Click to buy Sales Funnel Dashboard in Excel
1. How do I enter data into the Sales Funnel Dashboard?
Data is entered into the Data Sheet, where you can input lead details, sales rep assignments, and opportunity values.
2. Can I customize the Sales Funnel Dashboard?
Yes, the dashboard is fully customizable. You can add new KPIs, modify charts, and adjust the layout based on your needs.
3. How does the Regional Analysis sheet help?
The Regional Analysis sheet allows you to track lead performance by region, helping you identify regional trends and optimize your strategy accordingly.
4. How can I improve my Conversion Rate using this dashboard?
By regularly monitoring your Conversion Rate by Lead Source, Sales Rep, and Stage, you can identify areas to optimize the sales process and improve conversion rates.
Visit our YouTube channel to learn step-by-step video tutorials
Watch the step-by-step video Demo:
Click to buy Sales Funnel Dashboard in Excel